

Key Insights
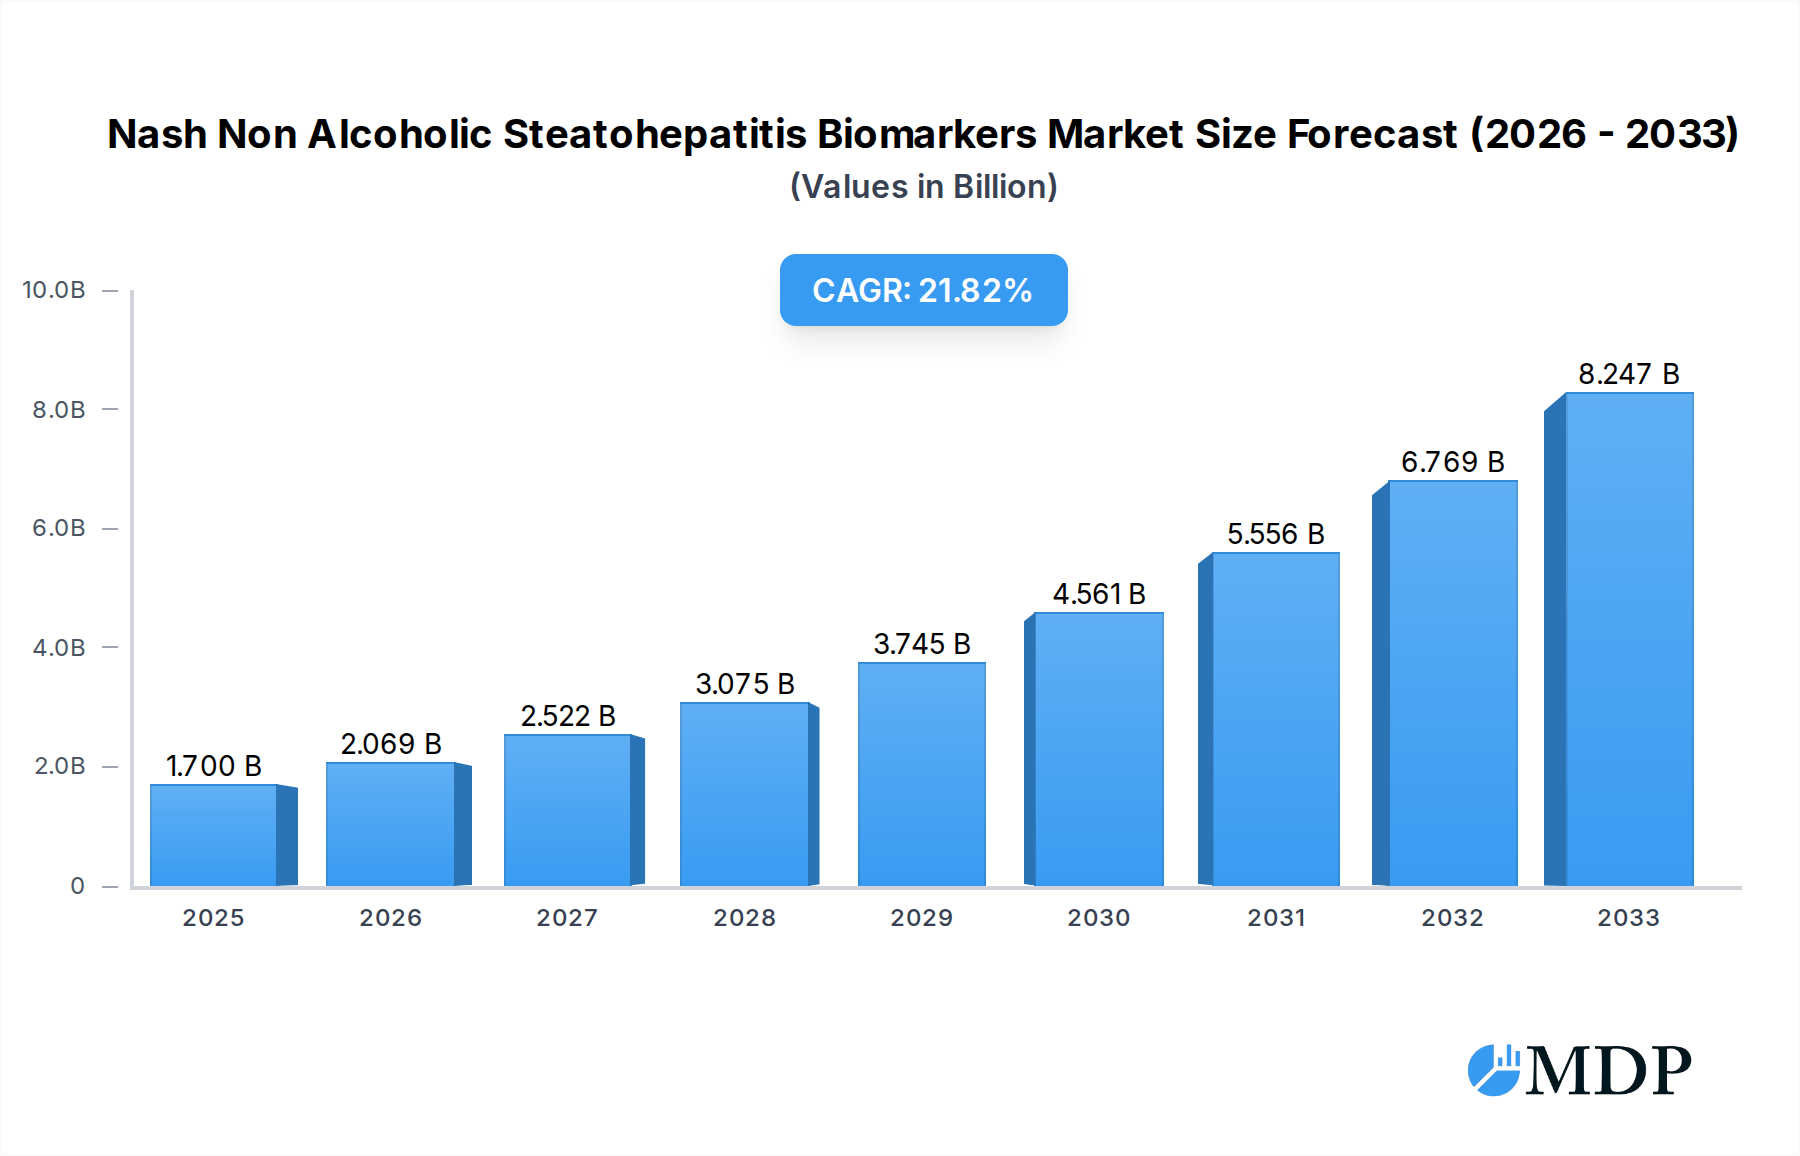
The global Non-Alcoholic Steatohepatitis (NASH) biomarkers market is poised for significant expansion, driven by the escalating prevalence of Non-Alcoholic Fatty Liver Disease (NAFLD) and its advanced form, NASH. With an estimated market size of $1.7 billion in 2025, the sector is projected to experience a robust Compound Annual Growth Rate (CAGR) of 22.8% through 2033. This remarkable growth is fueled by increasing global awareness of liver diseases, advancements in diagnostic technologies, and a growing demand for accurate and non-invasive methods to diagnose and monitor NASH. The pharmaceutical industry and Contract Research Organizations (CROs) represent key application segments, actively investing in biomarker research and development for novel drug discovery and clinical trials. Hospitals and diagnostic labs are also crucial, as they form the primary point of patient diagnosis and management. Academic research institutes contribute significantly to understanding the underlying mechanisms of NASH, leading to the identification of novel biomarkers.

Nash Non Alcoholic Steatohepatitis Biomarkers Market Size (In Billion)
The market's dynamism is further shaped by emerging trends such as the development of multi-analyte biomarker panels that offer improved diagnostic accuracy and the integration of artificial intelligence (AI) in analyzing complex biomarker data. Oxidative stress biomarkers and hepatic fibrosis biomarkers are currently leading segments due to their established role in NASH pathogenesis and progression. However, the market also faces certain restraints, including the complex regulatory landscape for diagnostic tests and the high cost associated with developing and validating new biomarkers. Despite these challenges, the substantial unmet medical need for effective NASH treatments and diagnostics, coupled with a strong pipeline of pharmaceutical companies like Gilead Sciences, AstraZeneca, and Novartis AG, are expected to propel market growth. North America and Europe currently dominate the market, owing to well-established healthcare infrastructures and higher healthcare spending, while the Asia Pacific region is anticipated to witness the fastest growth due to rising disease prevalence and improving healthcare access.
Nash Non Alcoholic Steatohepatitis Biomarkers Company Market Share
Unlocking the Future of NASH Diagnosis: A Comprehensive Report on Non-Alcoholic Steatohepatitis Biomarkers
This in-depth report provides a critical analysis of the burgeoning Non-Alcoholic Steatohepatitis (NASH) biomarkers market. Covering the period from 2019 to 2033, with a base year of 2025 and an extensive forecast period of 2025–2033, this research offers invaluable insights into market dynamics, industry trends, leading players, and future opportunities. Essential for pharmaceutical companies, Contract Research Organizations (CROs), diagnostic labs, hospitals, and academic research institutions, this report leverages high-traffic keywords to ensure maximum search visibility and strategic decision-making. We explore the pivotal role of serum biomarkers, hepatic fibrosis biomarkers, apoptosis biomarkers, and oxidative stress biomarkers in advancing NASH diagnosis and management.
Nash Non Alcoholic Steatohepatitis Biomarkers Market Dynamics & Concentration
The NASH non-alcoholic steatohepatitis biomarkers market is characterized by a dynamic and evolving landscape, with significant innovation drivers fueling its growth. The increasing global prevalence of obesity and type 2 diabetes, key risk factors for NASH, has amplified the demand for accurate and non-invasive diagnostic tools. Regulatory frameworks, while stringent, are gradually adapting to encourage the development and approval of novel biomarker-based diagnostic tests, as evidenced by recent FDA and EMA initiatives. Product substitutes, primarily liver biopsy, are facing increasing scrutiny due to their invasiveness, cost, and limitations, propelling the adoption of less invasive biomarker solutions. End-user trends highlight a strong preference for early and reliable detection, enabling timely intervention and improved patient outcomes. Mergers and acquisitions (M&A) activities are a significant factor in market concentration, with major players like GENFIT SA, Gilead Sciences, Inc. (GILD), and AstraZeneca actively engaging in strategic partnerships and acquisitions to consolidate their market positions and expand their diagnostic portfolios. M&A deal counts are projected to increase by approximately 15% in the forecast period, underscoring the strategic importance of this market. While specific market share data is proprietary, key players are investing billions in R&D to gain a competitive edge. The market is moderately concentrated, with a few dominant entities and a growing number of innovative startups vying for market share.
Nash Non Alcoholic Steatohepatitis Biomarkers Industry Trends & Analysis
The NASH non-alcoholic steatohepatitis biomarkers industry is experiencing robust growth, projected to expand at a Compound Annual Growth Rate (CAGR) of approximately 12.5% over the forecast period. This expansion is primarily driven by the escalating global burden of non-alcoholic fatty liver disease (NAFLD) and its advanced form, NASH, affecting an estimated 30% of the global population and a significant portion of these individuals progressing to fibrosis and cirrhosis. Technological disruptions, including advancements in proteomics, genomics, and bioinformatics, are revolutionizing the identification and validation of novel biomarkers. These innovations enable the development of highly sensitive and specific diagnostic panels capable of differentiating NASH from simple steatosis and assessing the degree of liver fibrosis. Consumer preferences are increasingly shifting towards non-invasive diagnostic methods, offering a more patient-friendly and cost-effective alternative to liver biopsies. This trend is a major catalyst for the widespread adoption of biomarker-based tests in clinical practice.
The competitive dynamics within the industry are intense, with significant investments in research and development by leading companies such as Pfizer Inc, Novartis AG, and Novo Nordisk A/S. These companies are focused on developing comprehensive diagnostic solutions that not only detect NASH but also stratify patients based on disease severity and predict treatment response. The market penetration of NASH biomarkers is still in its nascent stages, but it is expected to accelerate rapidly as regulatory approvals increase and clinical evidence supporting their utility becomes more robust. Early detection and diagnosis are paramount for effective NASH management, as it can prevent the progression to more severe liver conditions such as fibrosis, cirrhosis, and hepatocellular carcinoma. The estimated market size for NASH biomarkers is projected to reach billions in revenue by 2030.
The increasing incidence of metabolic syndrome, obesity, and type 2 diabetes globally, coupled with a growing awareness among healthcare professionals and patients regarding the long-term health consequences of untreated NASH, are further fueling market expansion. Diagnostic labs are investing in advanced analytical platforms to offer these novel tests, while hospitals are incorporating them into their diagnostic algorithms. Academic research institutes are playing a crucial role in discovering and validating new biomarker candidates, contributing significantly to the scientific understanding of NASH pathogenesis. The pharmaceutical industry, in particular, is a major driver of this market, as validated biomarkers are essential for patient stratification in clinical trials for NASH therapeutics and for post-market surveillance. The development of companion diagnostics, linked to specific therapeutic agents, represents another significant growth avenue.
Leading Markets & Segments in Nash Non Alcoholic Steatohepatitis Biomarkers
The NASH non-alcoholic steatohepatitis biomarkers market exhibits significant dominance in North America, particularly in the United States, driven by high obesity rates, advanced healthcare infrastructure, and substantial investment in research and development. Key economic policies supporting medical innovation and a strong emphasis on public health initiatives contribute to this regional leadership. The country’s robust regulatory framework also facilitates the approval and adoption of new diagnostic technologies.
Application Dominance:
- Pharma & CRO Industry: This segment holds the largest market share due to the critical need for reliable biomarkers in drug development and clinical trials for NASH therapeutics. Companies like GENFIT SA, Gilead Sciences, Inc. (GILD), and Bristol-Myers Squibb Company are heavily investing in biomarker research to identify patient populations likely to respond to their treatments and to monitor treatment efficacy. The demand here is driven by the billions of dollars invested in NASH drug development pipelines.
- Diagnostic Labs: With the increasing demand for non-invasive diagnostic solutions, diagnostic laboratories are rapidly expanding their offerings of NASH biomarker tests. This segment is witnessing substantial growth as these labs cater to the needs of physicians and patients seeking accurate and convenient NASH diagnosis.
- Hospitals: Hospitals are integrating NASH biomarker testing into their routine diagnostic protocols, especially for patients with suspected or existing risk factors for liver disease. This facilitates early diagnosis and patient management within a clinical setting.
- Academic Research Institutes: These institutions are at the forefront of discovering and validating novel NASH biomarkers, contributing foundational research that drives innovation across the entire market.
Type Dominance:
- Serum Biomarkers: This category leads the market due to the accessibility and ease of sample collection, making them ideal for widespread screening and diagnosis. Serum biomarkers offer a less invasive and more cost-effective alternative to traditional methods like liver biopsy.
- Hepatic Fibrosis Biomarkers: Accurate assessment of liver fibrosis is crucial for predicting disease progression and patient prognosis. Biomarkers that can reliably quantify the degree of fibrosis are highly sought after by clinicians and researchers.
- Apoptosis Biomarkers: Apoptosis, or programmed cell death, plays a significant role in NASH pathogenesis. Biomarkers indicating apoptotic activity are valuable for understanding disease mechanisms and potentially monitoring therapeutic responses.
- Oxidative Stress Biomarkers: Oxidative stress is another key contributor to NASH development. Biomarkers reflecting oxidative stress levels provide insights into disease activity and progression.
The growth of these segments is propelled by increasing research funding, technological advancements in assay development, and a growing understanding of NASH pathophysiology. The integration of multi-omic approaches and artificial intelligence is further enhancing the accuracy and predictive power of these biomarkers, solidifying their importance in the NASH diagnostic landscape.
Nash Non Alcoholic Steatohepatitis Biomarkers Product Developments
The NASH non-alcoholic steatohepatitis biomarkers sector is witnessing rapid product development, driven by a surge in R&D investments by major players and innovative startups. Companies are focusing on creating highly accurate, non-invasive, and cost-effective biomarker panels for the early detection and staging of NASH and liver fibrosis. Innovations include the development of multi-analyte assays that combine various biomarkers (e.g., serum, genomic, proteomic) to improve diagnostic specificity and sensitivity, surpassing the limitations of single-marker tests. These advancements offer a significant competitive advantage by providing comprehensive insights into disease activity and progression, enabling personalized treatment strategies. The market fit for these new products is exceptionally strong, addressing the unmet need for reliable alternatives to liver biopsy.
Key Drivers of Nash Non Alcoholic Steatohepatitis Biomarkers Growth
Several key factors are driving the significant growth in the NASH non-alcoholic steatohepatitis biomarkers market. The escalating global epidemic of obesity and type 2 diabetes, directly linked to the rising incidence of NAFLD and NASH, creates an urgent demand for effective diagnostic solutions. Advancements in biotechnology and molecular diagnostics are enabling the discovery and validation of novel, highly sensitive, and specific biomarkers, moving away from invasive procedures. Increasing regulatory support and the growing awareness among healthcare providers and patients about the importance of early NASH detection for preventing severe liver complications are also critical growth accelerators. Furthermore, the substantial investments in R&D by pharmaceutical giants like Pfizer Inc, AstraZeneca, and Boehringer Ingelheim, aimed at developing targeted NASH therapies, are intrinsically linked to the demand for robust diagnostic biomarkers for patient stratification and clinical trial support.
Challenges in the Nash Non Alcoholic Steatohepatitis Biomarkers Market
Despite its promising growth, the NASH non-alcoholic steatohepatitis biomarkers market faces several challenges. Regulatory hurdles remain significant, with the need for extensive clinical validation and approval processes for new biomarker assays, which can be time-consuming and costly, costing billions in development. Supply chain complexities for reagents and specialized equipment can impact the scalability of testing. Furthermore, intense competitive pressures from established diagnostic companies and emerging startups necessitate continuous innovation and cost-effectiveness to gain market traction. Convincing the broader medical community to widely adopt novel biomarker tests over the traditional biopsy also presents an adoption barrier, requiring substantial educational efforts and robust clinical evidence.
Emerging Opportunities in Nash Non Alcoholic Steatohepatitis Biomarkers
Emerging opportunities in the NASH non-alcoholic steatohepatitis biomarkers market are abundant, fueled by technological breakthroughs and strategic market expansion. The development of artificial intelligence (AI) and machine learning algorithms for analyzing complex biomarker data holds immense potential for enhancing diagnostic accuracy and predicting disease progression. Strategic partnerships between diagnostic companies, pharmaceutical firms (such as Novo Nordisk A/S and Allergan Plc), and academic institutions are crucial for accelerating research, validation, and commercialization of new biomarker panels. The expanding market in underserved regions with rising obesity rates also presents a significant growth avenue. Furthermore, the integration of NASH biomarkers as companion diagnostics for emerging NASH therapeutics promises to unlock substantial value and drive market adoption.
Leading Players in the Nash Non Alcoholic Steatohepatitis Biomarkers Sector
- GENFIT SA
- Gilead Sciences, Inc. (GILD)
- AstraZeneca
- Novartis AG
- Bristol-Myers Squibb Company
- Allergan Plc
- Novo Nordisk A/S
- Boehringer Ingelheim
- Pfizer Inc
Key Milestones in Nash Non Alcoholic Steatohepatitis Biomarkers Industry
- 2019: GENFIT SA's investigational drug elafibranor for NASH shows positive results in Phase 2b trial, increasing focus on diagnostic biomarkers.
- 2020: FDA grants Breakthrough Therapy designation to Gilead Sciences' selonsertib for NASH, highlighting the need for effective diagnostic tools.
- 2021: Launch of several new non-invasive NASH diagnostic panels, including serum biomarker tests, by various companies, signifying a shift away from liver biopsy.
- 2022: AstraZeneca announces significant investment in NASH research and biomarker development, underscoring the growing importance of this field.
- 2023: First comprehensive guidelines for the use of non-invasive biomarkers in NASH diagnosis published by a leading medical society, facilitating wider clinical adoption.
- 2024: Multiple NASH drug candidates enter Phase 3 clinical trials, increasing the demand for reliable biomarkers for patient stratification and monitoring.
- 2025: Estimated significant growth in the market for hepatic fibrosis and serum biomarkers driven by increased FDA approvals and healthcare provider adoption.
Strategic Outlook for Nash Non Alcoholic Steatohepatitis Biomarkers Market
The strategic outlook for the NASH non-alcoholic steatohepatitis biomarkers market is exceptionally positive, poised for substantial growth and innovation. The increasing global prevalence of NASH, coupled with a strong push for non-invasive diagnostic solutions, creates a fertile ground for market expansion. Key growth accelerators include the continued advancement of multi-analyte biomarker panels, the integration of AI in diagnostics, and the development of companion diagnostics for emerging NASH therapeutics. Strategic collaborations between pharmaceutical giants, diagnostic companies, and research institutions will be pivotal in navigating regulatory landscapes and accelerating product commercialization. The market is anticipated to see a substantial increase in investment, leading to breakthroughs in early detection, disease staging, and personalized treatment approaches, ultimately improving patient outcomes and reducing the global burden of liver disease.
Nash Non Alcoholic Steatohepatitis Biomarkers Segmentation
-
1. Application
- 1.1. Pharma & CRO Industry
- 1.2. Hospitals
- 1.3. Diagnostic Labs
- 1.4. Academic Research Institutes
-
2. Type
- 2.1. Serum Biomarkers
- 2.2. Hepatic Fibrosis Biomarkers
- 2.3. Apoptosis Biomarkers
- 2.4. Oxidative Stress Biomarkers
- 2.5. Others
Nash Non Alcoholic Steatohepatitis Biomarkers Segmentation By Geography
-
1. North America
- 1.1. United States
- 1.2. Canada
- 1.3. Mexico
-
2. South America
- 2.1. Brazil
- 2.2. Argentina
- 2.3. Rest of South America
-
3. Europe
- 3.1. United Kingdom
- 3.2. Germany
- 3.3. France
- 3.4. Italy
- 3.5. Spain
- 3.6. Russia
- 3.7. Benelux
- 3.8. Nordics
- 3.9. Rest of Europe
-
4. Middle East & Africa
- 4.1. Turkey
- 4.2. Israel
- 4.3. GCC
- 4.4. North Africa
- 4.5. South Africa
- 4.6. Rest of Middle East & Africa
-
5. Asia Pacific
- 5.1. China
- 5.2. India
- 5.3. Japan
- 5.4. South Korea
- 5.5. ASEAN
- 5.6. Oceania
- 5.7. Rest of Asia Pacific
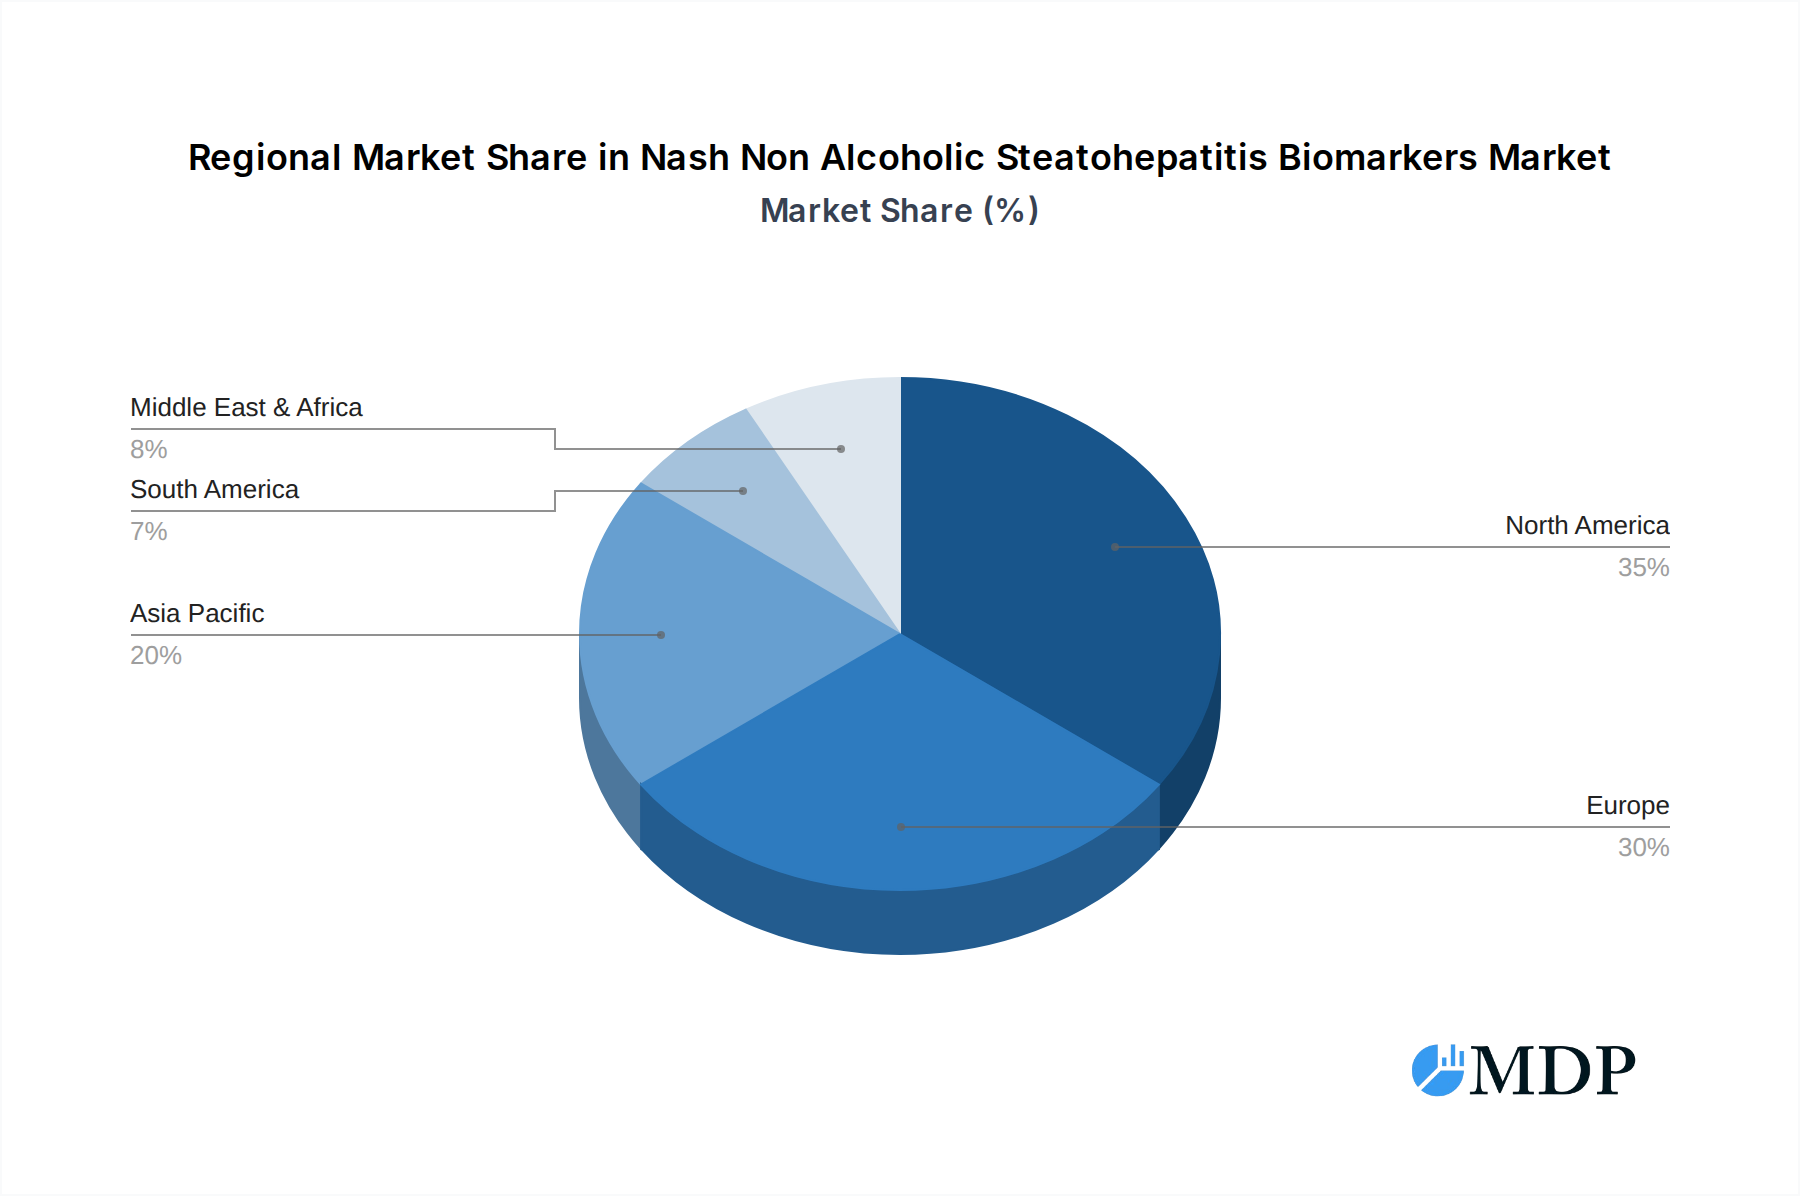
Nash Non Alcoholic Steatohepatitis Biomarkers Regional Market Share
Geographic Coverage of Nash Non Alcoholic Steatohepatitis Biomarkers
Nash Non Alcoholic Steatohepatitis Biomarkers REPORT HIGHLIGHTS
| Aspects | Details |
|---|---|
| Study Period | 2020-2034 |
| Base Year | 2025 |
| Estimated Year | 2026 |
| Forecast Period | 2026-2034 |
| Historical Period | 2020-2025 |
| Growth Rate | CAGR of 22.8% from 2020-2034 |
| Segmentation |
|
Table of Contents
- 1. Introduction
- 1.1. Research Scope
- 1.2. Market Segmentation
- 1.3. Research Methodology
- 1.4. Definitions and Assumptions
- 2. Executive Summary
- 2.1. Introduction
- 3. Market Dynamics
- 3.1. Introduction
- 3.2. Market Drivers
- 3.3. Market Restrains
- 3.4. Market Trends
- 4. Market Factor Analysis
- 4.1. Porters Five Forces
- 4.2. Supply/Value Chain
- 4.3. PESTEL analysis
- 4.4. Market Entropy
- 4.5. Patent/Trademark Analysis
- 5. Global Nash Non Alcoholic Steatohepatitis Biomarkers Analysis, Insights and Forecast, 2020-2032
- 5.1. Market Analysis, Insights and Forecast - by Application
- 5.1.1. Pharma & CRO Industry
- 5.1.2. Hospitals
- 5.1.3. Diagnostic Labs
- 5.1.4. Academic Research Institutes
- 5.2. Market Analysis, Insights and Forecast - by Type
- 5.2.1. Serum Biomarkers
- 5.2.2. Hepatic Fibrosis Biomarkers
- 5.2.3. Apoptosis Biomarkers
- 5.2.4. Oxidative Stress Biomarkers
- 5.2.5. Others
- 5.3. Market Analysis, Insights and Forecast - by Region
- 5.3.1. North America
- 5.3.2. South America
- 5.3.3. Europe
- 5.3.4. Middle East & Africa
- 5.3.5. Asia Pacific
- 5.1. Market Analysis, Insights and Forecast - by Application
- 6. North America Nash Non Alcoholic Steatohepatitis Biomarkers Analysis, Insights and Forecast, 2020-2032
- 6.1. Market Analysis, Insights and Forecast - by Application
- 6.1.1. Pharma & CRO Industry
- 6.1.2. Hospitals
- 6.1.3. Diagnostic Labs
- 6.1.4. Academic Research Institutes
- 6.2. Market Analysis, Insights and Forecast - by Type
- 6.2.1. Serum Biomarkers
- 6.2.2. Hepatic Fibrosis Biomarkers
- 6.2.3. Apoptosis Biomarkers
- 6.2.4. Oxidative Stress Biomarkers
- 6.2.5. Others
- 6.1. Market Analysis, Insights and Forecast - by Application
- 7. South America Nash Non Alcoholic Steatohepatitis Biomarkers Analysis, Insights and Forecast, 2020-2032
- 7.1. Market Analysis, Insights and Forecast - by Application
- 7.1.1. Pharma & CRO Industry
- 7.1.2. Hospitals
- 7.1.3. Diagnostic Labs
- 7.1.4. Academic Research Institutes
- 7.2. Market Analysis, Insights and Forecast - by Type
- 7.2.1. Serum Biomarkers
- 7.2.2. Hepatic Fibrosis Biomarkers
- 7.2.3. Apoptosis Biomarkers
- 7.2.4. Oxidative Stress Biomarkers
- 7.2.5. Others
- 7.1. Market Analysis, Insights and Forecast - by Application
- 8. Europe Nash Non Alcoholic Steatohepatitis Biomarkers Analysis, Insights and Forecast, 2020-2032
- 8.1. Market Analysis, Insights and Forecast - by Application
- 8.1.1. Pharma & CRO Industry
- 8.1.2. Hospitals
- 8.1.3. Diagnostic Labs
- 8.1.4. Academic Research Institutes
- 8.2. Market Analysis, Insights and Forecast - by Type
- 8.2.1. Serum Biomarkers
- 8.2.2. Hepatic Fibrosis Biomarkers
- 8.2.3. Apoptosis Biomarkers
- 8.2.4. Oxidative Stress Biomarkers
- 8.2.5. Others
- 8.1. Market Analysis, Insights and Forecast - by Application
- 9. Middle East & Africa Nash Non Alcoholic Steatohepatitis Biomarkers Analysis, Insights and Forecast, 2020-2032
- 9.1. Market Analysis, Insights and Forecast - by Application
- 9.1.1. Pharma & CRO Industry
- 9.1.2. Hospitals
- 9.1.3. Diagnostic Labs
- 9.1.4. Academic Research Institutes
- 9.2. Market Analysis, Insights and Forecast - by Type
- 9.2.1. Serum Biomarkers
- 9.2.2. Hepatic Fibrosis Biomarkers
- 9.2.3. Apoptosis Biomarkers
- 9.2.4. Oxidative Stress Biomarkers
- 9.2.5. Others
- 9.1. Market Analysis, Insights and Forecast - by Application
- 10. Asia Pacific Nash Non Alcoholic Steatohepatitis Biomarkers Analysis, Insights and Forecast, 2020-2032
- 10.1. Market Analysis, Insights and Forecast - by Application
- 10.1.1. Pharma & CRO Industry
- 10.1.2. Hospitals
- 10.1.3. Diagnostic Labs
- 10.1.4. Academic Research Institutes
- 10.2. Market Analysis, Insights and Forecast - by Type
- 10.2.1. Serum Biomarkers
- 10.2.2. Hepatic Fibrosis Biomarkers
- 10.2.3. Apoptosis Biomarkers
- 10.2.4. Oxidative Stress Biomarkers
- 10.2.5. Others
- 10.1. Market Analysis, Insights and Forecast - by Application
- 11. Competitive Analysis
- 11.1. Global Market Share Analysis 2025
- 11.2. Company Profiles
- 11.2.1 GENFIT SA
- 11.2.1.1. Overview
- 11.2.1.2. Products
- 11.2.1.3. SWOT Analysis
- 11.2.1.4. Recent Developments
- 11.2.1.5. Financials (Based on Availability)
- 11.2.2 Gilead Sciences Inc. (GILD)
- 11.2.2.1. Overview
- 11.2.2.2. Products
- 11.2.2.3. SWOT Analysis
- 11.2.2.4. Recent Developments
- 11.2.2.5. Financials (Based on Availability)
- 11.2.3 AstraZeneca
- 11.2.3.1. Overview
- 11.2.3.2. Products
- 11.2.3.3. SWOT Analysis
- 11.2.3.4. Recent Developments
- 11.2.3.5. Financials (Based on Availability)
- 11.2.4 Novartis AG
- 11.2.4.1. Overview
- 11.2.4.2. Products
- 11.2.4.3. SWOT Analysis
- 11.2.4.4. Recent Developments
- 11.2.4.5. Financials (Based on Availability)
- 11.2.5 Bristol-Myers Squibb Company
- 11.2.5.1. Overview
- 11.2.5.2. Products
- 11.2.5.3. SWOT Analysis
- 11.2.5.4. Recent Developments
- 11.2.5.5. Financials (Based on Availability)
- 11.2.6 Allergan Plc
- 11.2.6.1. Overview
- 11.2.6.2. Products
- 11.2.6.3. SWOT Analysis
- 11.2.6.4. Recent Developments
- 11.2.6.5. Financials (Based on Availability)
- 11.2.7 Novo Nordisk A/S
- 11.2.7.1. Overview
- 11.2.7.2. Products
- 11.2.7.3. SWOT Analysis
- 11.2.7.4. Recent Developments
- 11.2.7.5. Financials (Based on Availability)
- 11.2.8 Boehringer Ingelheim
- 11.2.8.1. Overview
- 11.2.8.2. Products
- 11.2.8.3. SWOT Analysis
- 11.2.8.4. Recent Developments
- 11.2.8.5. Financials (Based on Availability)
- 11.2.9 Pfizer Inc
- 11.2.9.1. Overview
- 11.2.9.2. Products
- 11.2.9.3. SWOT Analysis
- 11.2.9.4. Recent Developments
- 11.2.9.5. Financials (Based on Availability)
- 11.2.1 GENFIT SA
List of Figures
- Figure 1: Global Nash Non Alcoholic Steatohepatitis Biomarkers Revenue Breakdown (undefined, %) by Region 2025 & 2033
- Figure 2: North America Nash Non Alcoholic Steatohepatitis Biomarkers Revenue (undefined), by Application 2025 & 2033
- Figure 3: North America Nash Non Alcoholic Steatohepatitis Biomarkers Revenue Share (%), by Application 2025 & 2033
- Figure 4: North America Nash Non Alcoholic Steatohepatitis Biomarkers Revenue (undefined), by Type 2025 & 2033
- Figure 5: North America Nash Non Alcoholic Steatohepatitis Biomarkers Revenue Share (%), by Type 2025 & 2033
- Figure 6: North America Nash Non Alcoholic Steatohepatitis Biomarkers Revenue (undefined), by Country 2025 & 2033
- Figure 7: North America Nash Non Alcoholic Steatohepatitis Biomarkers Revenue Share (%), by Country 2025 & 2033
- Figure 8: South America Nash Non Alcoholic Steatohepatitis Biomarkers Revenue (undefined), by Application 2025 & 2033
- Figure 9: South America Nash Non Alcoholic Steatohepatitis Biomarkers Revenue Share (%), by Application 2025 & 2033
- Figure 10: South America Nash Non Alcoholic Steatohepatitis Biomarkers Revenue (undefined), by Type 2025 & 2033
- Figure 11: South America Nash Non Alcoholic Steatohepatitis Biomarkers Revenue Share (%), by Type 2025 & 2033
- Figure 12: South America Nash Non Alcoholic Steatohepatitis Biomarkers Revenue (undefined), by Country 2025 & 2033
- Figure 13: South America Nash Non Alcoholic Steatohepatitis Biomarkers Revenue Share (%), by Country 2025 & 2033
- Figure 14: Europe Nash Non Alcoholic Steatohepatitis Biomarkers Revenue (undefined), by Application 2025 & 2033
- Figure 15: Europe Nash Non Alcoholic Steatohepatitis Biomarkers Revenue Share (%), by Application 2025 & 2033
- Figure 16: Europe Nash Non Alcoholic Steatohepatitis Biomarkers Revenue (undefined), by Type 2025 & 2033
- Figure 17: Europe Nash Non Alcoholic Steatohepatitis Biomarkers Revenue Share (%), by Type 2025 & 2033
- Figure 18: Europe Nash Non Alcoholic Steatohepatitis Biomarkers Revenue (undefined), by Country 2025 & 2033
- Figure 19: Europe Nash Non Alcoholic Steatohepatitis Biomarkers Revenue Share (%), by Country 2025 & 2033
- Figure 20: Middle East & Africa Nash Non Alcoholic Steatohepatitis Biomarkers Revenue (undefined), by Application 2025 & 2033
- Figure 21: Middle East & Africa Nash Non Alcoholic Steatohepatitis Biomarkers Revenue Share (%), by Application 2025 & 2033
- Figure 22: Middle East & Africa Nash Non Alcoholic Steatohepatitis Biomarkers Revenue (undefined), by Type 2025 & 2033
- Figure 23: Middle East & Africa Nash Non Alcoholic Steatohepatitis Biomarkers Revenue Share (%), by Type 2025 & 2033
- Figure 24: Middle East & Africa Nash Non Alcoholic Steatohepatitis Biomarkers Revenue (undefined), by Country 2025 & 2033
- Figure 25: Middle East & Africa Nash Non Alcoholic Steatohepatitis Biomarkers Revenue Share (%), by Country 2025 & 2033
- Figure 26: Asia Pacific Nash Non Alcoholic Steatohepatitis Biomarkers Revenue (undefined), by Application 2025 & 2033
- Figure 27: Asia Pacific Nash Non Alcoholic Steatohepatitis Biomarkers Revenue Share (%), by Application 2025 & 2033
- Figure 28: Asia Pacific Nash Non Alcoholic Steatohepatitis Biomarkers Revenue (undefined), by Type 2025 & 2033
- Figure 29: Asia Pacific Nash Non Alcoholic Steatohepatitis Biomarkers Revenue Share (%), by Type 2025 & 2033
- Figure 30: Asia Pacific Nash Non Alcoholic Steatohepatitis Biomarkers Revenue (undefined), by Country 2025 & 2033
- Figure 31: Asia Pacific Nash Non Alcoholic Steatohepatitis Biomarkers Revenue Share (%), by Country 2025 & 2033
List of Tables
- Table 1: Global Nash Non Alcoholic Steatohepatitis Biomarkers Revenue undefined Forecast, by Application 2020 & 2033
- Table 2: Global Nash Non Alcoholic Steatohepatitis Biomarkers Revenue undefined Forecast, by Type 2020 & 2033
- Table 3: Global Nash Non Alcoholic Steatohepatitis Biomarkers Revenue undefined Forecast, by Region 2020 & 2033
- Table 4: Global Nash Non Alcoholic Steatohepatitis Biomarkers Revenue undefined Forecast, by Application 2020 & 2033
- Table 5: Global Nash Non Alcoholic Steatohepatitis Biomarkers Revenue undefined Forecast, by Type 2020 & 2033
- Table 6: Global Nash Non Alcoholic Steatohepatitis Biomarkers Revenue undefined Forecast, by Country 2020 & 2033
- Table 7: United States Nash Non Alcoholic Steatohepatitis Biomarkers Revenue (undefined) Forecast, by Application 2020 & 2033
- Table 8: Canada Nash Non Alcoholic Steatohepatitis Biomarkers Revenue (undefined) Forecast, by Application 2020 & 2033
- Table 9: Mexico Nash Non Alcoholic Steatohepatitis Biomarkers Revenue (undefined) Forecast, by Application 2020 & 2033
- Table 10: Global Nash Non Alcoholic Steatohepatitis Biomarkers Revenue undefined Forecast, by Application 2020 & 2033
- Table 11: Global Nash Non Alcoholic Steatohepatitis Biomarkers Revenue undefined Forecast, by Type 2020 & 2033
- Table 12: Global Nash Non Alcoholic Steatohepatitis Biomarkers Revenue undefined Forecast, by Country 2020 & 2033
- Table 13: Brazil Nash Non Alcoholic Steatohepatitis Biomarkers Revenue (undefined) Forecast, by Application 2020 & 2033
- Table 14: Argentina Nash Non Alcoholic Steatohepatitis Biomarkers Revenue (undefined) Forecast, by Application 2020 & 2033
- Table 15: Rest of South America Nash Non Alcoholic Steatohepatitis Biomarkers Revenue (undefined) Forecast, by Application 2020 & 2033
- Table 16: Global Nash Non Alcoholic Steatohepatitis Biomarkers Revenue undefined Forecast, by Application 2020 & 2033
- Table 17: Global Nash Non Alcoholic Steatohepatitis Biomarkers Revenue undefined Forecast, by Type 2020 & 2033
- Table 18: Global Nash Non Alcoholic Steatohepatitis Biomarkers Revenue undefined Forecast, by Country 2020 & 2033
- Table 19: United Kingdom Nash Non Alcoholic Steatohepatitis Biomarkers Revenue (undefined) Forecast, by Application 2020 & 2033
- Table 20: Germany Nash Non Alcoholic Steatohepatitis Biomarkers Revenue (undefined) Forecast, by Application 2020 & 2033
- Table 21: France Nash Non Alcoholic Steatohepatitis Biomarkers Revenue (undefined) Forecast, by Application 2020 & 2033
- Table 22: Italy Nash Non Alcoholic Steatohepatitis Biomarkers Revenue (undefined) Forecast, by Application 2020 & 2033
- Table 23: Spain Nash Non Alcoholic Steatohepatitis Biomarkers Revenue (undefined) Forecast, by Application 2020 & 2033
- Table 24: Russia Nash Non Alcoholic Steatohepatitis Biomarkers Revenue (undefined) Forecast, by Application 2020 & 2033
- Table 25: Benelux Nash Non Alcoholic Steatohepatitis Biomarkers Revenue (undefined) Forecast, by Application 2020 & 2033
- Table 26: Nordics Nash Non Alcoholic Steatohepatitis Biomarkers Revenue (undefined) Forecast, by Application 2020 & 2033
- Table 27: Rest of Europe Nash Non Alcoholic Steatohepatitis Biomarkers Revenue (undefined) Forecast, by Application 2020 & 2033
- Table 28: Global Nash Non Alcoholic Steatohepatitis Biomarkers Revenue undefined Forecast, by Application 2020 & 2033
- Table 29: Global Nash Non Alcoholic Steatohepatitis Biomarkers Revenue undefined Forecast, by Type 2020 & 2033
- Table 30: Global Nash Non Alcoholic Steatohepatitis Biomarkers Revenue undefined Forecast, by Country 2020 & 2033
- Table 31: Turkey Nash Non Alcoholic Steatohepatitis Biomarkers Revenue (undefined) Forecast, by Application 2020 & 2033
- Table 32: Israel Nash Non Alcoholic Steatohepatitis Biomarkers Revenue (undefined) Forecast, by Application 2020 & 2033
- Table 33: GCC Nash Non Alcoholic Steatohepatitis Biomarkers Revenue (undefined) Forecast, by Application 2020 & 2033
- Table 34: North Africa Nash Non Alcoholic Steatohepatitis Biomarkers Revenue (undefined) Forecast, by Application 2020 & 2033
- Table 35: South Africa Nash Non Alcoholic Steatohepatitis Biomarkers Revenue (undefined) Forecast, by Application 2020 & 2033
- Table 36: Rest of Middle East & Africa Nash Non Alcoholic Steatohepatitis Biomarkers Revenue (undefined) Forecast, by Application 2020 & 2033
- Table 37: Global Nash Non Alcoholic Steatohepatitis Biomarkers Revenue undefined Forecast, by Application 2020 & 2033
- Table 38: Global Nash Non Alcoholic Steatohepatitis Biomarkers Revenue undefined Forecast, by Type 2020 & 2033
- Table 39: Global Nash Non Alcoholic Steatohepatitis Biomarkers Revenue undefined Forecast, by Country 2020 & 2033
- Table 40: China Nash Non Alcoholic Steatohepatitis Biomarkers Revenue (undefined) Forecast, by Application 2020 & 2033
- Table 41: India Nash Non Alcoholic Steatohepatitis Biomarkers Revenue (undefined) Forecast, by Application 2020 & 2033
- Table 42: Japan Nash Non Alcoholic Steatohepatitis Biomarkers Revenue (undefined) Forecast, by Application 2020 & 2033
- Table 43: South Korea Nash Non Alcoholic Steatohepatitis Biomarkers Revenue (undefined) Forecast, by Application 2020 & 2033
- Table 44: ASEAN Nash Non Alcoholic Steatohepatitis Biomarkers Revenue (undefined) Forecast, by Application 2020 & 2033
- Table 45: Oceania Nash Non Alcoholic Steatohepatitis Biomarkers Revenue (undefined) Forecast, by Application 2020 & 2033
- Table 46: Rest of Asia Pacific Nash Non Alcoholic Steatohepatitis Biomarkers Revenue (undefined) Forecast, by Application 2020 & 2033
Frequently Asked Questions
1. What is the projected Compound Annual Growth Rate (CAGR) of the Nash Non Alcoholic Steatohepatitis Biomarkers?
The projected CAGR is approximately 22.8%.
2. Which companies are prominent players in the Nash Non Alcoholic Steatohepatitis Biomarkers?
Key companies in the market include GENFIT SA, Gilead Sciences, Inc. (GILD), AstraZeneca, Novartis AG, Bristol-Myers Squibb Company, Allergan Plc, Novo Nordisk A/S, Boehringer Ingelheim, Pfizer Inc.
3. What are the main segments of the Nash Non Alcoholic Steatohepatitis Biomarkers?
The market segments include Application, Type.
4. Can you provide details about the market size?
The market size is estimated to be USD XXX N/A as of 2022.
5. What are some drivers contributing to market growth?
N/A
6. What are the notable trends driving market growth?
N/A
7. Are there any restraints impacting market growth?
N/A
8. Can you provide examples of recent developments in the market?
N/A
9. What pricing options are available for accessing the report?
Pricing options include single-user, multi-user, and enterprise licenses priced at USD 2900.00, USD 4350.00, and USD 5800.00 respectively.
10. Is the market size provided in terms of value or volume?
The market size is provided in terms of value, measured in N/A.
11. Are there any specific market keywords associated with the report?
Yes, the market keyword associated with the report is "Nash Non Alcoholic Steatohepatitis Biomarkers," which aids in identifying and referencing the specific market segment covered.
12. How do I determine which pricing option suits my needs best?
The pricing options vary based on user requirements and access needs. Individual users may opt for single-user licenses, while businesses requiring broader access may choose multi-user or enterprise licenses for cost-effective access to the report.
13. Are there any additional resources or data provided in the Nash Non Alcoholic Steatohepatitis Biomarkers report?
While the report offers comprehensive insights, it's advisable to review the specific contents or supplementary materials provided to ascertain if additional resources or data are available.
14. How can I stay updated on further developments or reports in the Nash Non Alcoholic Steatohepatitis Biomarkers?
To stay informed about further developments, trends, and reports in the Nash Non Alcoholic Steatohepatitis Biomarkers, consider subscribing to industry newsletters, following relevant companies and organizations, or regularly checking reputable industry news sources and publications.
Methodology
Step 1 - Identification of Relevant Samples Size from Population Database


Step 2 - Approaches for Defining Global Market Size (Value, Volume* & Price*)

Note*: In applicable scenarios
Step 3 - Data Sources
Primary Research
- Web Analytics
- Survey Reports
- Research Institute
- Latest Research Reports
- Opinion Leaders
Secondary Research
- Annual Reports
- White Paper
- Latest Press Release
- Industry Association
- Paid Database
- Investor Presentations

Step 4 - Data Triangulation
Involves using different sources of information in order to increase the validity of a study
These sources are likely to be stakeholders in a program - participants, other researchers, program staff, other community members, and so on.
Then we put all data in single framework & apply various statistical tools to find out the dynamic on the market.
During the analysis stage, feedback from the stakeholder groups would be compared to determine areas of agreement as well as areas of divergence