

Key Insights
The global Music Visualizer market is poised for substantial growth, projected to reach an estimated $557 million in 2025. This expansion is driven by a confluence of factors, including the increasing demand for immersive audio-visual experiences across various platforms, the burgeoning creator economy, and the integration of advanced AI and machine learning technologies. The market is expected to witness a Compound Annual Growth Rate (CAGR) of 6.7% during the forecast period of 2025-2033. Key drivers include the growing adoption of music visualizers in live performances, online streaming, social media content creation, and gaming. Furthermore, the rising popularity of music production software and the continuous innovation in visual effects are fueling market expansion. Small and Medium-sized Enterprises (SMEs) are increasingly leveraging cost-effective cloud-based solutions, while larger enterprises are exploring sophisticated on-premises systems for greater control and customization. The market is also benefiting from the growing trend of personalized content experiences, where users seek dynamic and engaging visual accompaniments to their favorite music.
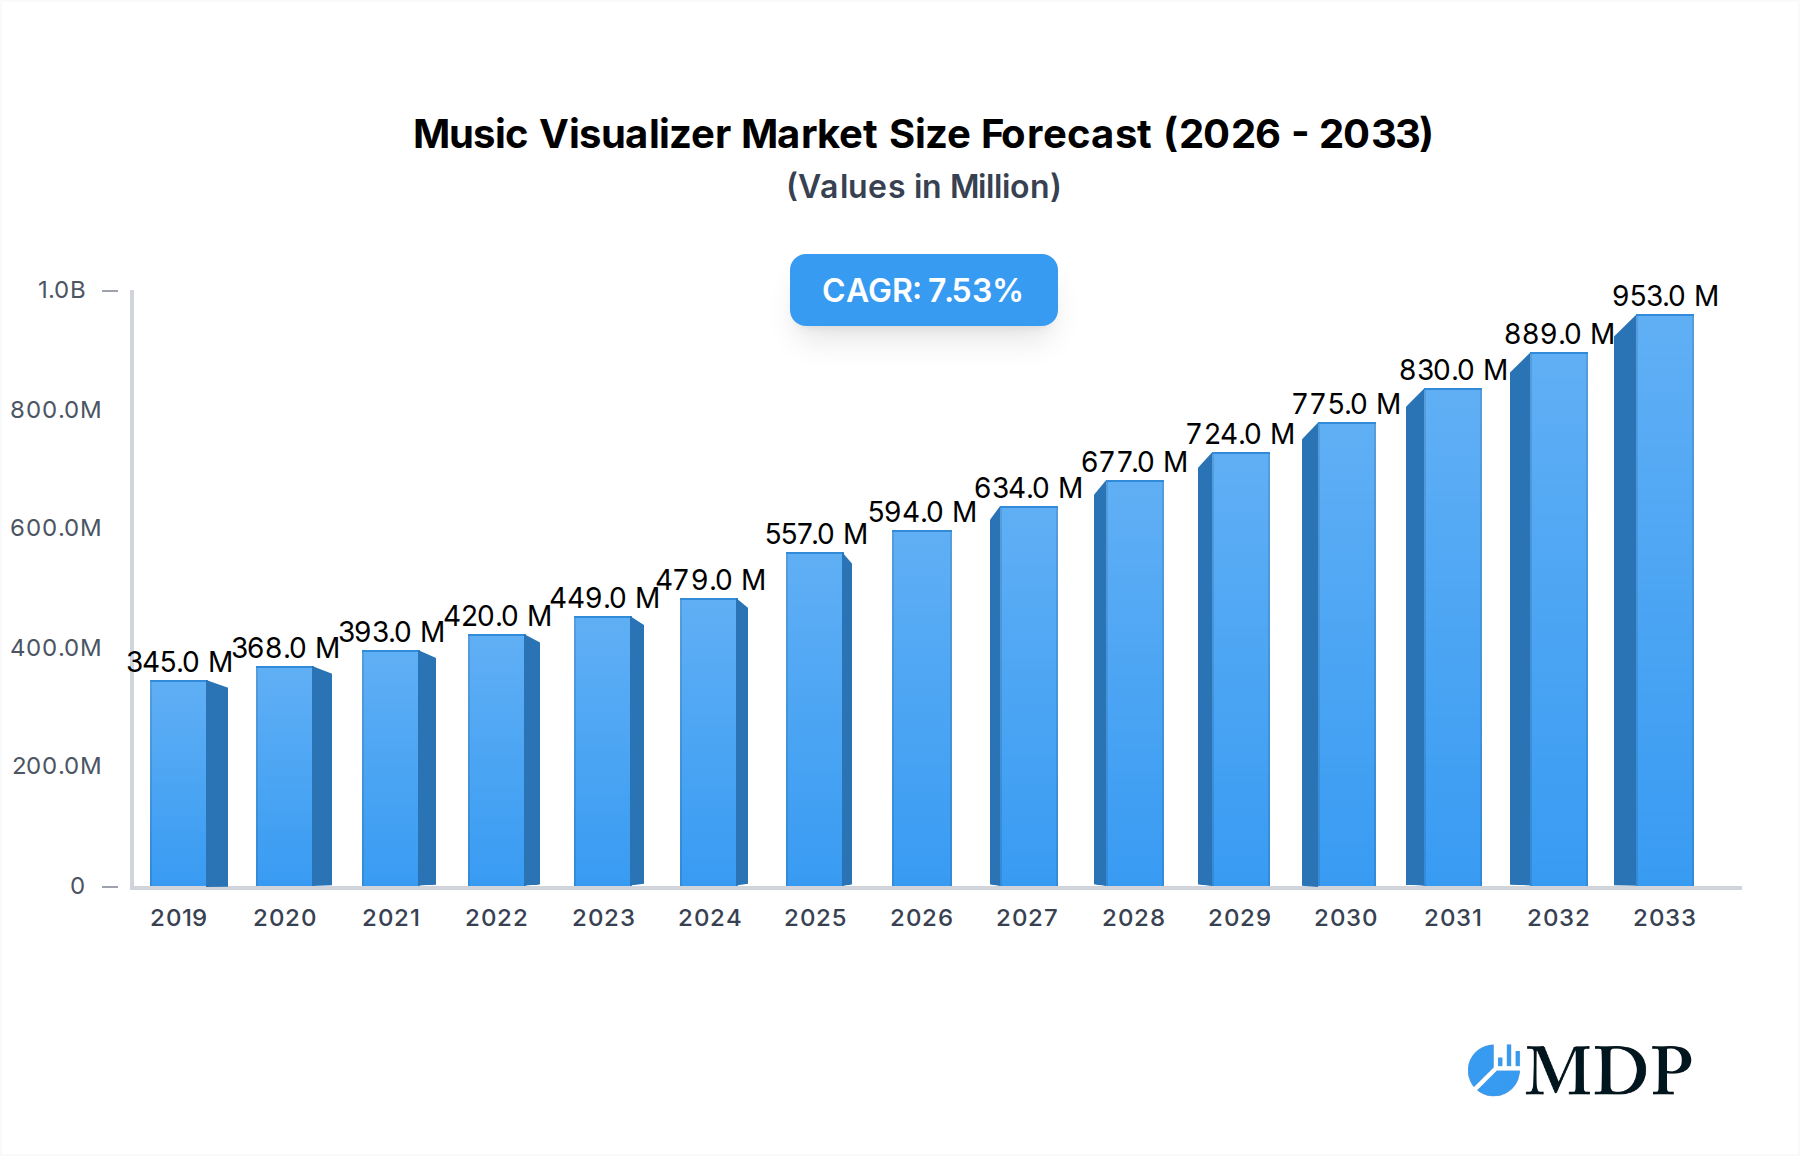
Music Visualizer Market Size (In Million)
The music visualizer landscape is characterized by a dynamic competitive environment with key players like Adobe, Renderforest, and Videobolt focusing on enhancing user-friendly interfaces and offering a wide array of customizable templates. Emerging trends include the integration of real-time audio analysis for more responsive visuals, the development of generative AI-powered visualizers that create unique imagery based on musical parameters, and the expansion of augmented reality (AR) and virtual reality (VR) applications for music visualization. While the market is vibrant, certain restraints such as the technical expertise required for advanced customization and the initial investment costs for high-end solutions for some segments could pose challenges. However, the increasing accessibility of powerful yet intuitive software, coupled with a growing demand for engaging digital content, is expected to mitigate these restraints and sustain the market's upward trajectory. The Asia Pacific region, particularly China and India, is anticipated to be a significant growth engine due to a rapidly expanding digital entertainment sector and a large youth population.

Music Visualizer Company Market Share
Music Visualizer Market Report: Unlocking Millions in Growth Opportunities (2019-2033)
Dive into the vibrant and rapidly evolving music visualizer market with this comprehensive report. Spanning the historical period of 2019-2024, with a base year of 2025 and a forecast period extending to 2033, this analysis provides an unparalleled deep dive into market dynamics, trends, and future projections. Discover how music visualization software, including advanced audio visualizers, real-time visualizers, and AI-powered visualizers, is reshaping content creation and audience engagement across industries. With an estimated market value projected to reach millions by 2025 and continue its upward trajectory, this report is an indispensable resource for SMEs and Large Enterprises alike, whether they leverage cloud-based or on-premises solutions. Uncover actionable insights to capitalize on millions in untapped potential within this burgeoning sector.
Music Visualizer Market Dynamics & Concentration
The music visualizer market exhibits a dynamic interplay of innovation and emerging trends. Market concentration is moderate, with a blend of established players and agile startups driving competition. Key innovation drivers include advancements in AI and machine learning for automated visualization generation, enhanced real-time audio processing, and the growing demand for interactive visual experiences. Regulatory frameworks are largely permissive, focusing on intellectual property and data privacy, with minimal direct impact on visualizer development. Product substitutes, such as static graphics or manual video editing, are becoming less competitive as visualizers offer more sophisticated and automated solutions. End-user trends indicate a significant surge in demand from content creators, streamers, and event organizers seeking to enhance viewer engagement. Merger and acquisition (M&A) activities are anticipated to increase as larger players seek to integrate cutting-edge visualizer technology and expand their market share. While precise M&A deal counts are proprietary, industry analysis suggests a growing number of strategic partnerships and acquisitions are likely to occur over the forecast period, particularly involving companies with unique video creation tools and audio reactive capabilities. The market share landscape is expected to see shifts as new technological breakthroughs gain traction, with leading companies continuously investing in R&D to maintain their competitive edge.
Music Visualizer Industry Trends & Analysis
The music visualizer industry is poised for substantial growth, driven by a confluence of factors that are redefining how audio is experienced visually. The market is projected to witness a Compound Annual Growth Rate (CAGR) exceeding millions in value over the forecast period. This robust expansion is fueled by the escalating demand for engaging and immersive content across digital platforms. Technological disruptions are at the forefront of this growth; the integration of artificial intelligence (AI) and machine learning (ML) algorithms is revolutionizing the creation of sophisticated and personalized visualizers. These advancements enable automated generation of dynamic visuals that are perfectly synchronized with music, reducing the manual effort required and democratizing access to high-quality visual content. Furthermore, the proliferation of high-speed internet and affordable hardware has significantly boosted the adoption of both cloud-based music visualizers and on-premises solutions. Consumer preferences are increasingly leaning towards visually stimulating experiences, particularly among younger demographics who consume music and video content concurrently. Platforms like YouTube, Twitch, and TikTok have normalized the expectation of accompanying visuals for audio content, further accelerating market penetration. Competitive dynamics are characterized by a healthy rivalry between established software providers and innovative startups, each vying to offer unique features such as customizable visualizers, branding integration, and live visual performances. The rise of the creator economy also plays a pivotal role, empowering independent artists and small businesses to leverage advanced visualizers to enhance their brand presence and connect with their audiences on a deeper level. This trend is expected to drive a significant portion of market growth, as businesses recognize the value of compelling visual storytelling in capturing attention and fostering brand loyalty in a crowded digital landscape. The increasing adoption of video editing software that incorporates advanced visualizer functionalities further underscores the market's upward trajectory.
Leading Markets & Segments in Music Visualizer
The music visualizer market is experiencing significant traction across various regions and application segments, with key markets demonstrating robust growth potential.
Dominant Region:
North America currently leads the music visualizer market, driven by a strong presence of technology companies, a highly engaged digital content creation ecosystem, and a significant consumer base for digital media.
- Key Drivers in North America:
- Technological Innovation Hubs: Proximity to major tech companies and research institutions fosters rapid adoption of new visualizer technologies.
- High Internet Penetration & Streaming Culture: Widespread access to high-speed internet and a deeply ingrained culture of music and video streaming fuels demand for engaging visual content.
- Growth of the Creator Economy: A substantial number of independent content creators, musicians, and digital artists utilize visualizers to enhance their online presence and monetize their work.
- Early Adoption of Emerging Technologies: North America often leads in the adoption of AI, VR, and AR technologies, which are increasingly being integrated into music visualizers.
Dominant Application Segment:
Within the application segment, SMEs represent a rapidly growing user base for music visualizers. While Large Enterprises have historically driven significant adoption, the affordability and accessibility of modern visualizer tools are making them increasingly indispensable for smaller businesses seeking to compete visually.
- Key Drivers for SMEs:
- Cost-Effectiveness: Cloud-based solutions and freemium models offer accessible entry points for SMEs with limited budgets.
- Ease of Use: Intuitive interfaces and AI-driven automation allow SMEs with limited technical expertise to create professional-looking visualizations.
- Enhanced Brand Engagement: SMEs leverage visualizers to create compelling marketing content, social media posts, and website elements to attract and retain customers.
- Democratization of Content Creation: Tools like Renderforest, Videobolt, and Veed empower SMEs to produce high-quality visual content that was previously only accessible to larger organizations.
Dominant Type Segment:
Cloud-Based music visualizers are emerging as the dominant type, offering scalability, accessibility, and cost-efficiency that appeals to a broad spectrum of users.
- Key Drivers for Cloud-Based Solutions:
- Accessibility & Collaboration: Users can access and work on visualizations from any device with an internet connection, facilitating collaboration among teams.
- Scalability & Flexibility: Cloud solutions can easily scale to accommodate growing needs and offer a pay-as-you-go model, making them ideal for fluctuating project demands.
- Automatic Updates & Maintenance: Software is continuously updated and maintained by the provider, reducing IT overhead for users.
- Integration Capabilities: Cloud-based platforms often integrate seamlessly with other cloud services and content management systems, streamlining workflows.
While on-premises solutions continue to be relevant for organizations with strict data security requirements or specialized hardware needs, the agility and cost-effectiveness of cloud-based visualizers are driving their widespread adoption across the music visualizer market.
Music Visualizer Product Developments
Product development in the music visualizer market is characterized by rapid innovation, focusing on enhanced AI-driven automation, seamless integration with music production workflows, and expanded customization options. Companies are pushing the boundaries with real-time audio analysis for hyper-responsive visuals and the incorporation of virtual reality (VR) and augmented reality (AR) elements. This allows for immersive experiences that go beyond traditional screen-based outputs. Key applications include dynamic content for live performances, engaging marketing campaigns, and personalized user experiences on streaming platforms. The competitive advantage lies in offering intuitive user interfaces, robust rendering capabilities, and unique visual styles that differentiate creators.
Key Drivers of Music Visualizer Growth
The music visualizer market is propelled by several key growth drivers. Technological advancements in AI and machine learning enable more sophisticated and automated visual creation, making advanced visualization accessible to a wider audience. The economic shift towards a creator economy and the increasing demand for engaging digital content across social media and streaming platforms are significant drivers. Furthermore, regulatory support for digital content creation and intellectual property rights indirectly fosters growth by providing a stable environment for innovation. The accessibility of user-friendly software like those offered by Adobe and Renderforest, coupled with the decreasing cost of high-performance computing, further fuels widespread adoption.
Challenges in the Music Visualizer Market
Despite its growth, the music visualizer market faces several challenges. Technological limitations in achieving perfectly photorealistic and complex real-time visualizations can still be a barrier for some high-end applications. High initial investment costs for sophisticated software and hardware can deter some smaller businesses and independent artists. Intense competition from a plethora of software providers, including both established players and emerging startups, necessitates continuous innovation and differentiation. Additionally, evolving copyright laws and the complexities of music licensing for visual synchronization can create regulatory hurdles.
Emerging Opportunities in Music Visualizer
Emerging opportunities in the music visualizer market are primarily driven by technological breakthroughs and evolving consumer expectations. The integration of virtual reality (VR) and augmented reality (AR) technologies presents a significant frontier, enabling truly immersive and interactive audio-visual experiences. AI-powered personalization will allow for dynamic visualizers that adapt to individual user preferences and listening habits. Strategic partnerships between music streaming services and visualizer developers can unlock new revenue streams and enhance user engagement. Furthermore, the expansion of the music visualizer market into live event production, interactive installations, and educational content creation offers substantial long-term growth potential.
Leading Players in the Music Visualizer Sector
- Adobe
- Renderforest
- Magic Music Visuals
- VSDC
- Winamp
- Media Monkey (Ventis Media)
- Videobolt
- VideoLAN
- PotPlayer
- SongRender
- Veed
- Trapp
- VSXu
- SoundSpectrum
- Sonic Visualiser
Key Milestones in Music Visualizer Industry
- 2019: Increased adoption of AI and machine learning in visualization algorithms, leading to more sophisticated automated generation.
- 2020: Surge in demand for online content creation tools driven by global lockdowns, boosting the popularity of accessible music visualizers.
- 2021: Advancements in real-time rendering capabilities, enabling smoother and more responsive visualizers for live streaming.
- 2022: Emergence of VR/AR integrated visualizers, hinting at future immersive audio-visual experiences.
- 2023: Significant improvements in cloud-based platforms, offering enhanced collaboration and scalability for a wider user base.
- 2024: Increased focus on sustainability and energy-efficient visualization rendering techniques.
- 2025 (Base Year): Estimated market valuation reaching millions, with strong growth indicators for AI-powered and cloud-based solutions.
Strategic Outlook for Music Visualizer Market
The strategic outlook for the music visualizer market is exceptionally positive, driven by continuous technological innovation and evolving consumer demand for immersive digital experiences. The growth accelerators include the pervasive integration of AI for personalized and automated content creation, the expansion of VR/AR applications for enhanced engagement, and strategic partnerships across the digital media ecosystem. Companies that focus on developing user-friendly interfaces, offering robust customization options, and demonstrating clear ROI for SMEs and large enterprises will be best positioned for success. The market's trajectory indicates sustained growth, with increasing opportunities in live event technology, interactive installations, and educational content.
Music Visualizer Segmentation
-
1. Application
- 1.1. SMEs
- 1.2. Large Enterprises
-
2. Type
- 2.1. Cloud Based
- 2.2. On-premises
Music Visualizer Segmentation By Geography
-
1. North America
- 1.1. United States
- 1.2. Canada
- 1.3. Mexico
-
2. South America
- 2.1. Brazil
- 2.2. Argentina
- 2.3. Rest of South America
-
3. Europe
- 3.1. United Kingdom
- 3.2. Germany
- 3.3. France
- 3.4. Italy
- 3.5. Spain
- 3.6. Russia
- 3.7. Benelux
- 3.8. Nordics
- 3.9. Rest of Europe
-
4. Middle East & Africa
- 4.1. Turkey
- 4.2. Israel
- 4.3. GCC
- 4.4. North Africa
- 4.5. South Africa
- 4.6. Rest of Middle East & Africa
-
5. Asia Pacific
- 5.1. China
- 5.2. India
- 5.3. Japan
- 5.4. South Korea
- 5.5. ASEAN
- 5.6. Oceania
- 5.7. Rest of Asia Pacific
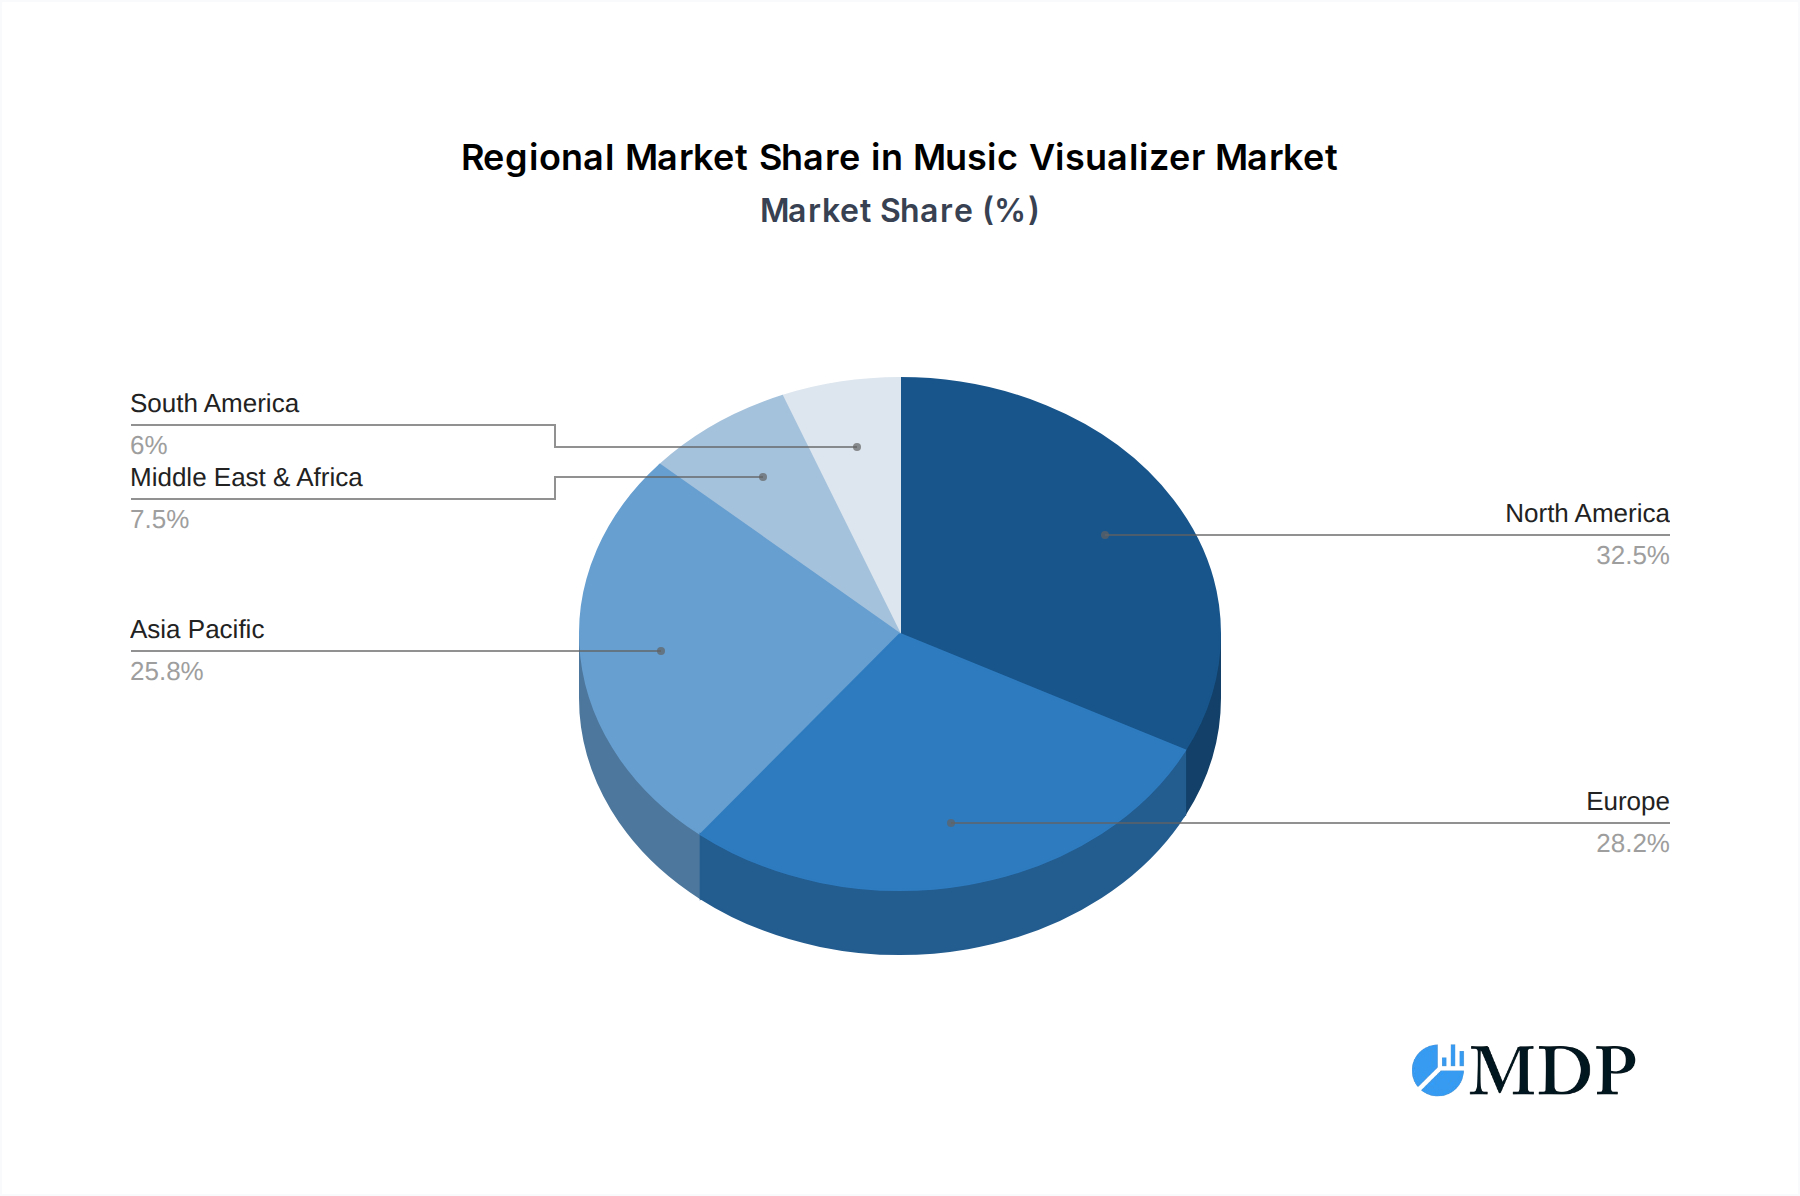
Music Visualizer Regional Market Share
Geographic Coverage of Music Visualizer
Music Visualizer REPORT HIGHLIGHTS
| Aspects | Details |
|---|---|
| Study Period | 2020-2034 |
| Base Year | 2025 |
| Estimated Year | 2026 |
| Forecast Period | 2026-2034 |
| Historical Period | 2020-2025 |
| Growth Rate | CAGR of 6.7% from 2020-2034 |
| Segmentation |
|
Table of Contents
- 1. Introduction
- 1.1. Research Scope
- 1.2. Market Segmentation
- 1.3. Research Methodology
- 1.4. Definitions and Assumptions
- 2. Executive Summary
- 2.1. Introduction
- 3. Market Dynamics
- 3.1. Introduction
- 3.2. Market Drivers
- 3.3. Market Restrains
- 3.4. Market Trends
- 4. Market Factor Analysis
- 4.1. Porters Five Forces
- 4.2. Supply/Value Chain
- 4.3. PESTEL analysis
- 4.4. Market Entropy
- 4.5. Patent/Trademark Analysis
- 5. Global Music Visualizer Analysis, Insights and Forecast, 2020-2032
- 5.1. Market Analysis, Insights and Forecast - by Application
- 5.1.1. SMEs
- 5.1.2. Large Enterprises
- 5.2. Market Analysis, Insights and Forecast - by Type
- 5.2.1. Cloud Based
- 5.2.2. On-premises
- 5.3. Market Analysis, Insights and Forecast - by Region
- 5.3.1. North America
- 5.3.2. South America
- 5.3.3. Europe
- 5.3.4. Middle East & Africa
- 5.3.5. Asia Pacific
- 5.1. Market Analysis, Insights and Forecast - by Application
- 6. North America Music Visualizer Analysis, Insights and Forecast, 2020-2032
- 6.1. Market Analysis, Insights and Forecast - by Application
- 6.1.1. SMEs
- 6.1.2. Large Enterprises
- 6.2. Market Analysis, Insights and Forecast - by Type
- 6.2.1. Cloud Based
- 6.2.2. On-premises
- 6.1. Market Analysis, Insights and Forecast - by Application
- 7. South America Music Visualizer Analysis, Insights and Forecast, 2020-2032
- 7.1. Market Analysis, Insights and Forecast - by Application
- 7.1.1. SMEs
- 7.1.2. Large Enterprises
- 7.2. Market Analysis, Insights and Forecast - by Type
- 7.2.1. Cloud Based
- 7.2.2. On-premises
- 7.1. Market Analysis, Insights and Forecast - by Application
- 8. Europe Music Visualizer Analysis, Insights and Forecast, 2020-2032
- 8.1. Market Analysis, Insights and Forecast - by Application
- 8.1.1. SMEs
- 8.1.2. Large Enterprises
- 8.2. Market Analysis, Insights and Forecast - by Type
- 8.2.1. Cloud Based
- 8.2.2. On-premises
- 8.1. Market Analysis, Insights and Forecast - by Application
- 9. Middle East & Africa Music Visualizer Analysis, Insights and Forecast, 2020-2032
- 9.1. Market Analysis, Insights and Forecast - by Application
- 9.1.1. SMEs
- 9.1.2. Large Enterprises
- 9.2. Market Analysis, Insights and Forecast - by Type
- 9.2.1. Cloud Based
- 9.2.2. On-premises
- 9.1. Market Analysis, Insights and Forecast - by Application
- 10. Asia Pacific Music Visualizer Analysis, Insights and Forecast, 2020-2032
- 10.1. Market Analysis, Insights and Forecast - by Application
- 10.1.1. SMEs
- 10.1.2. Large Enterprises
- 10.2. Market Analysis, Insights and Forecast - by Type
- 10.2.1. Cloud Based
- 10.2.2. On-premises
- 10.1. Market Analysis, Insights and Forecast - by Application
- 11. Competitive Analysis
- 11.1. Global Market Share Analysis 2025
- 11.2. Company Profiles
- 11.2.1 Adobe
- 11.2.1.1. Overview
- 11.2.1.2. Products
- 11.2.1.3. SWOT Analysis
- 11.2.1.4. Recent Developments
- 11.2.1.5. Financials (Based on Availability)
- 11.2.2 Renderforest
- 11.2.2.1. Overview
- 11.2.2.2. Products
- 11.2.2.3. SWOT Analysis
- 11.2.2.4. Recent Developments
- 11.2.2.5. Financials (Based on Availability)
- 11.2.3 Magic Music Visuals
- 11.2.3.1. Overview
- 11.2.3.2. Products
- 11.2.3.3. SWOT Analysis
- 11.2.3.4. Recent Developments
- 11.2.3.5. Financials (Based on Availability)
- 11.2.4 VSDC
- 11.2.4.1. Overview
- 11.2.4.2. Products
- 11.2.4.3. SWOT Analysis
- 11.2.4.4. Recent Developments
- 11.2.4.5. Financials (Based on Availability)
- 11.2.5 Winamp
- 11.2.5.1. Overview
- 11.2.5.2. Products
- 11.2.5.3. SWOT Analysis
- 11.2.5.4. Recent Developments
- 11.2.5.5. Financials (Based on Availability)
- 11.2.6 Media Monkey (Ventis Media)
- 11.2.6.1. Overview
- 11.2.6.2. Products
- 11.2.6.3. SWOT Analysis
- 11.2.6.4. Recent Developments
- 11.2.6.5. Financials (Based on Availability)
- 11.2.7 Videobolt
- 11.2.7.1. Overview
- 11.2.7.2. Products
- 11.2.7.3. SWOT Analysis
- 11.2.7.4. Recent Developments
- 11.2.7.5. Financials (Based on Availability)
- 11.2.8 VideoLAN
- 11.2.8.1. Overview
- 11.2.8.2. Products
- 11.2.8.3. SWOT Analysis
- 11.2.8.4. Recent Developments
- 11.2.8.5. Financials (Based on Availability)
- 11.2.9 PotPlayer
- 11.2.9.1. Overview
- 11.2.9.2. Products
- 11.2.9.3. SWOT Analysis
- 11.2.9.4. Recent Developments
- 11.2.9.5. Financials (Based on Availability)
- 11.2.10 SongRender
- 11.2.10.1. Overview
- 11.2.10.2. Products
- 11.2.10.3. SWOT Analysis
- 11.2.10.4. Recent Developments
- 11.2.10.5. Financials (Based on Availability)
- 11.2.11 Veed
- 11.2.11.1. Overview
- 11.2.11.2. Products
- 11.2.11.3. SWOT Analysis
- 11.2.11.4. Recent Developments
- 11.2.11.5. Financials (Based on Availability)
- 11.2.12 Trapp
- 11.2.12.1. Overview
- 11.2.12.2. Products
- 11.2.12.3. SWOT Analysis
- 11.2.12.4. Recent Developments
- 11.2.12.5. Financials (Based on Availability)
- 11.2.13 VSXu
- 11.2.13.1. Overview
- 11.2.13.2. Products
- 11.2.13.3. SWOT Analysis
- 11.2.13.4. Recent Developments
- 11.2.13.5. Financials (Based on Availability)
- 11.2.14 SoundSpectrum
- 11.2.14.1. Overview
- 11.2.14.2. Products
- 11.2.14.3. SWOT Analysis
- 11.2.14.4. Recent Developments
- 11.2.14.5. Financials (Based on Availability)
- 11.2.15 Sonic Visualiser
- 11.2.15.1. Overview
- 11.2.15.2. Products
- 11.2.15.3. SWOT Analysis
- 11.2.15.4. Recent Developments
- 11.2.15.5. Financials (Based on Availability)
- 11.2.1 Adobe
List of Figures
- Figure 1: Global Music Visualizer Revenue Breakdown (million, %) by Region 2025 & 2033
- Figure 2: North America Music Visualizer Revenue (million), by Application 2025 & 2033
- Figure 3: North America Music Visualizer Revenue Share (%), by Application 2025 & 2033
- Figure 4: North America Music Visualizer Revenue (million), by Type 2025 & 2033
- Figure 5: North America Music Visualizer Revenue Share (%), by Type 2025 & 2033
- Figure 6: North America Music Visualizer Revenue (million), by Country 2025 & 2033
- Figure 7: North America Music Visualizer Revenue Share (%), by Country 2025 & 2033
- Figure 8: South America Music Visualizer Revenue (million), by Application 2025 & 2033
- Figure 9: South America Music Visualizer Revenue Share (%), by Application 2025 & 2033
- Figure 10: South America Music Visualizer Revenue (million), by Type 2025 & 2033
- Figure 11: South America Music Visualizer Revenue Share (%), by Type 2025 & 2033
- Figure 12: South America Music Visualizer Revenue (million), by Country 2025 & 2033
- Figure 13: South America Music Visualizer Revenue Share (%), by Country 2025 & 2033
- Figure 14: Europe Music Visualizer Revenue (million), by Application 2025 & 2033
- Figure 15: Europe Music Visualizer Revenue Share (%), by Application 2025 & 2033
- Figure 16: Europe Music Visualizer Revenue (million), by Type 2025 & 2033
- Figure 17: Europe Music Visualizer Revenue Share (%), by Type 2025 & 2033
- Figure 18: Europe Music Visualizer Revenue (million), by Country 2025 & 2033
- Figure 19: Europe Music Visualizer Revenue Share (%), by Country 2025 & 2033
- Figure 20: Middle East & Africa Music Visualizer Revenue (million), by Application 2025 & 2033
- Figure 21: Middle East & Africa Music Visualizer Revenue Share (%), by Application 2025 & 2033
- Figure 22: Middle East & Africa Music Visualizer Revenue (million), by Type 2025 & 2033
- Figure 23: Middle East & Africa Music Visualizer Revenue Share (%), by Type 2025 & 2033
- Figure 24: Middle East & Africa Music Visualizer Revenue (million), by Country 2025 & 2033
- Figure 25: Middle East & Africa Music Visualizer Revenue Share (%), by Country 2025 & 2033
- Figure 26: Asia Pacific Music Visualizer Revenue (million), by Application 2025 & 2033
- Figure 27: Asia Pacific Music Visualizer Revenue Share (%), by Application 2025 & 2033
- Figure 28: Asia Pacific Music Visualizer Revenue (million), by Type 2025 & 2033
- Figure 29: Asia Pacific Music Visualizer Revenue Share (%), by Type 2025 & 2033
- Figure 30: Asia Pacific Music Visualizer Revenue (million), by Country 2025 & 2033
- Figure 31: Asia Pacific Music Visualizer Revenue Share (%), by Country 2025 & 2033
List of Tables
- Table 1: Global Music Visualizer Revenue million Forecast, by Application 2020 & 2033
- Table 2: Global Music Visualizer Revenue million Forecast, by Type 2020 & 2033
- Table 3: Global Music Visualizer Revenue million Forecast, by Region 2020 & 2033
- Table 4: Global Music Visualizer Revenue million Forecast, by Application 2020 & 2033
- Table 5: Global Music Visualizer Revenue million Forecast, by Type 2020 & 2033
- Table 6: Global Music Visualizer Revenue million Forecast, by Country 2020 & 2033
- Table 7: United States Music Visualizer Revenue (million) Forecast, by Application 2020 & 2033
- Table 8: Canada Music Visualizer Revenue (million) Forecast, by Application 2020 & 2033
- Table 9: Mexico Music Visualizer Revenue (million) Forecast, by Application 2020 & 2033
- Table 10: Global Music Visualizer Revenue million Forecast, by Application 2020 & 2033
- Table 11: Global Music Visualizer Revenue million Forecast, by Type 2020 & 2033
- Table 12: Global Music Visualizer Revenue million Forecast, by Country 2020 & 2033
- Table 13: Brazil Music Visualizer Revenue (million) Forecast, by Application 2020 & 2033
- Table 14: Argentina Music Visualizer Revenue (million) Forecast, by Application 2020 & 2033
- Table 15: Rest of South America Music Visualizer Revenue (million) Forecast, by Application 2020 & 2033
- Table 16: Global Music Visualizer Revenue million Forecast, by Application 2020 & 2033
- Table 17: Global Music Visualizer Revenue million Forecast, by Type 2020 & 2033
- Table 18: Global Music Visualizer Revenue million Forecast, by Country 2020 & 2033
- Table 19: United Kingdom Music Visualizer Revenue (million) Forecast, by Application 2020 & 2033
- Table 20: Germany Music Visualizer Revenue (million) Forecast, by Application 2020 & 2033
- Table 21: France Music Visualizer Revenue (million) Forecast, by Application 2020 & 2033
- Table 22: Italy Music Visualizer Revenue (million) Forecast, by Application 2020 & 2033
- Table 23: Spain Music Visualizer Revenue (million) Forecast, by Application 2020 & 2033
- Table 24: Russia Music Visualizer Revenue (million) Forecast, by Application 2020 & 2033
- Table 25: Benelux Music Visualizer Revenue (million) Forecast, by Application 2020 & 2033
- Table 26: Nordics Music Visualizer Revenue (million) Forecast, by Application 2020 & 2033
- Table 27: Rest of Europe Music Visualizer Revenue (million) Forecast, by Application 2020 & 2033
- Table 28: Global Music Visualizer Revenue million Forecast, by Application 2020 & 2033
- Table 29: Global Music Visualizer Revenue million Forecast, by Type 2020 & 2033
- Table 30: Global Music Visualizer Revenue million Forecast, by Country 2020 & 2033
- Table 31: Turkey Music Visualizer Revenue (million) Forecast, by Application 2020 & 2033
- Table 32: Israel Music Visualizer Revenue (million) Forecast, by Application 2020 & 2033
- Table 33: GCC Music Visualizer Revenue (million) Forecast, by Application 2020 & 2033
- Table 34: North Africa Music Visualizer Revenue (million) Forecast, by Application 2020 & 2033
- Table 35: South Africa Music Visualizer Revenue (million) Forecast, by Application 2020 & 2033
- Table 36: Rest of Middle East & Africa Music Visualizer Revenue (million) Forecast, by Application 2020 & 2033
- Table 37: Global Music Visualizer Revenue million Forecast, by Application 2020 & 2033
- Table 38: Global Music Visualizer Revenue million Forecast, by Type 2020 & 2033
- Table 39: Global Music Visualizer Revenue million Forecast, by Country 2020 & 2033
- Table 40: China Music Visualizer Revenue (million) Forecast, by Application 2020 & 2033
- Table 41: India Music Visualizer Revenue (million) Forecast, by Application 2020 & 2033
- Table 42: Japan Music Visualizer Revenue (million) Forecast, by Application 2020 & 2033
- Table 43: South Korea Music Visualizer Revenue (million) Forecast, by Application 2020 & 2033
- Table 44: ASEAN Music Visualizer Revenue (million) Forecast, by Application 2020 & 2033
- Table 45: Oceania Music Visualizer Revenue (million) Forecast, by Application 2020 & 2033
- Table 46: Rest of Asia Pacific Music Visualizer Revenue (million) Forecast, by Application 2020 & 2033
Frequently Asked Questions
1. What is the projected Compound Annual Growth Rate (CAGR) of the Music Visualizer?
The projected CAGR is approximately 6.7%.
2. Which companies are prominent players in the Music Visualizer?
Key companies in the market include Adobe, Renderforest, Magic Music Visuals, VSDC, Winamp, Media Monkey (Ventis Media), Videobolt, VideoLAN, PotPlayer, SongRender, Veed, Trapp, VSXu, SoundSpectrum, Sonic Visualiser.
3. What are the main segments of the Music Visualizer?
The market segments include Application, Type.
4. Can you provide details about the market size?
The market size is estimated to be USD 557 million as of 2022.
5. What are some drivers contributing to market growth?
N/A
6. What are the notable trends driving market growth?
N/A
7. Are there any restraints impacting market growth?
N/A
8. Can you provide examples of recent developments in the market?
N/A
9. What pricing options are available for accessing the report?
Pricing options include single-user, multi-user, and enterprise licenses priced at USD 2900.00, USD 4350.00, and USD 5800.00 respectively.
10. Is the market size provided in terms of value or volume?
The market size is provided in terms of value, measured in million.
11. Are there any specific market keywords associated with the report?
Yes, the market keyword associated with the report is "Music Visualizer," which aids in identifying and referencing the specific market segment covered.
12. How do I determine which pricing option suits my needs best?
The pricing options vary based on user requirements and access needs. Individual users may opt for single-user licenses, while businesses requiring broader access may choose multi-user or enterprise licenses for cost-effective access to the report.
13. Are there any additional resources or data provided in the Music Visualizer report?
While the report offers comprehensive insights, it's advisable to review the specific contents or supplementary materials provided to ascertain if additional resources or data are available.
14. How can I stay updated on further developments or reports in the Music Visualizer?
To stay informed about further developments, trends, and reports in the Music Visualizer, consider subscribing to industry newsletters, following relevant companies and organizations, or regularly checking reputable industry news sources and publications.
Methodology
Step 1 - Identification of Relevant Samples Size from Population Database


Step 2 - Approaches for Defining Global Market Size (Value, Volume* & Price*)

Note*: In applicable scenarios
Step 3 - Data Sources
Primary Research
- Web Analytics
- Survey Reports
- Research Institute
- Latest Research Reports
- Opinion Leaders
Secondary Research
- Annual Reports
- White Paper
- Latest Press Release
- Industry Association
- Paid Database
- Investor Presentations

Step 4 - Data Triangulation
Involves using different sources of information in order to increase the validity of a study
These sources are likely to be stakeholders in a program - participants, other researchers, program staff, other community members, and so on.
Then we put all data in single framework & apply various statistical tools to find out the dynamic on the market.
During the analysis stage, feedback from the stakeholder groups would be compared to determine areas of agreement as well as areas of divergence