

Key Insights
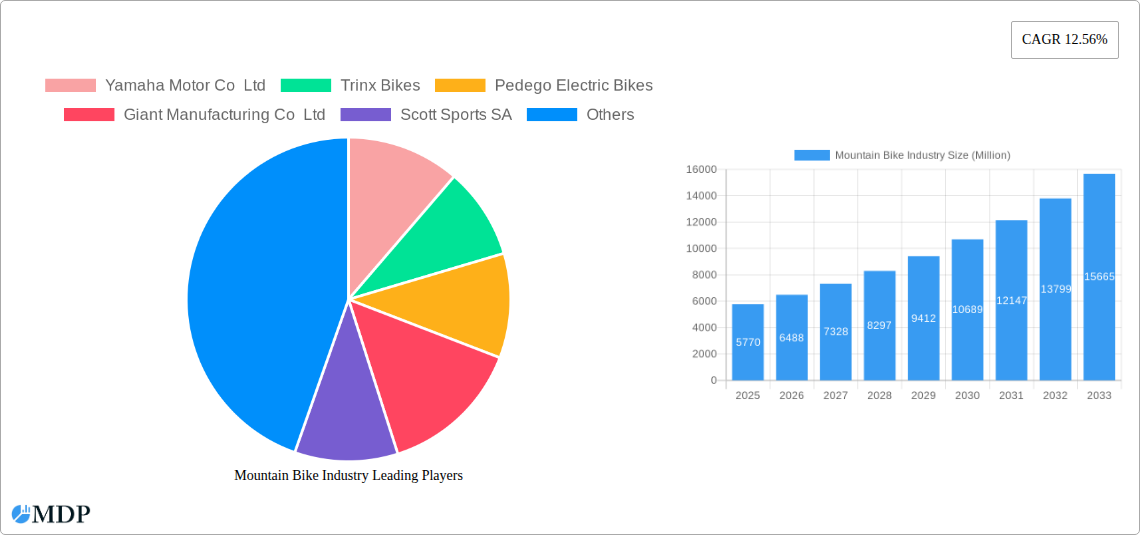
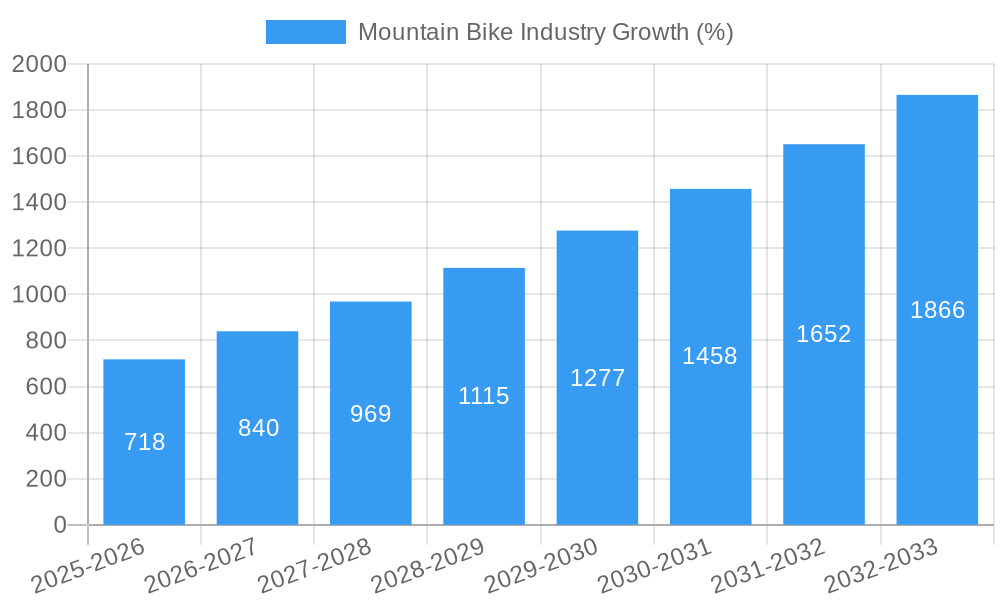
The global mountain bike market, valued at $5.77 billion in 2025, is projected to experience robust growth, exhibiting a Compound Annual Growth Rate (CAGR) of 12.56% from 2025 to 2033. This expansion is fueled by several key factors. Increasing consumer preference for outdoor recreational activities and fitness-oriented lifestyles is a significant driver. The rising popularity of e-mountain bikes, offering pedal-assisted and throttle-assisted options, is further boosting market demand, particularly among a wider demographic seeking enhanced performance and accessibility. Technological advancements, including improved battery technology, lighter frame materials, and advanced suspension systems, are also contributing to the market's growth. Furthermore, the market is segmented by propulsion type (pedal-assisted and throttle-assisted) and application (leisure and commuting), with the leisure segment currently dominating, but the commuting segment experiencing significant growth. Key players such as Yamaha, Trinx, Pedego, Giant, Scott Sports, Cube, Trek, BH Bike, and Pivot Cycles are shaping the competitive landscape through innovation and strategic market expansion. The geographically diverse market sees strong growth in North America and Europe, but the Asia-Pacific region, particularly China and India, is poised for substantial expansion due to rising disposable incomes and increasing participation in cycling.
The market faces certain restraints, primarily concerning the relatively high initial cost of e-mountain bikes compared to traditional models. However, advancements in battery technology and economies of scale are expected to gradually mitigate this factor. Government initiatives promoting cycling infrastructure and eco-friendly transportation also influence market dynamics positively. The market's future trajectory depends on the continued technological innovation, consumer preferences shifting towards sustainable transportation, and the successful integration of e-mountain bikes within established cycling communities. The forecast period (2025-2033) suggests continued strong growth, making it an attractive sector for both established manufacturers and emerging players.
Mountain Bike Industry Market Report: 2019-2033
This comprehensive report provides an in-depth analysis of the global mountain bike industry, projecting a market value exceeding $XX Million by 2033. It offers actionable insights for industry stakeholders, investors, and businesses seeking to navigate this dynamic market. The study period covers 2019-2033, with 2025 as the base and estimated year. This report is crucial for understanding market trends, competitive landscapes, and future growth opportunities within the mountain bike sector.
Mountain Bike Industry Market Dynamics & Concentration
The global mountain bike market, valued at $XX Million in 2024, exhibits a moderately concentrated landscape, with key players holding significant market share. Innovation, driven by advancements in e-bike technology and materials science, is a key driver, alongside evolving consumer preferences towards sustainable and technologically advanced products. Stringent regulatory frameworks concerning safety and environmental standards significantly influence market dynamics. Product substitutes, such as other forms of outdoor recreation equipment, pose a moderate competitive threat. The market also witnesses increasing mergers and acquisitions (M&A) activity, indicating consolidation and strategic expansion by major players.
- Market Concentration: The top 5 players account for approximately XX% of the global market share in 2024.
- M&A Activity: An average of XX M&A deals were recorded annually between 2019 and 2024.
- Innovation Drivers: Advancements in battery technology, lightweight materials (carbon fiber), and integrated electronics.
- Regulatory Frameworks: Safety standards, emission regulations, and import/export controls vary across regions.
Mountain Bike Industry Industry Trends & Analysis
The mountain bike industry is experiencing robust growth, driven by several key factors. The compound annual growth rate (CAGR) from 2025 to 2033 is projected at XX%. Rising disposable incomes, particularly in emerging economies, are fueling demand for leisure activities, including mountain biking. Technological advancements, particularly in e-bike technology, have expanded the market's accessibility, attracting a broader demographic. Shifting consumer preferences toward environmentally friendly products and an increasing focus on health and fitness further contribute to market expansion. Intense competition among major players leads to continuous product innovation and aggressive marketing strategies. Market penetration of e-mountain bikes is currently at XX% and is expected to reach XX% by 2033.
Leading Markets & Segments in Mountain Bike Industry
The North American region currently holds the largest market share, followed by Europe and Asia-Pacific. Within segments, the pedal-assisted e-mountain bike segment dominates the propulsion type market, while the leisure application segment is the largest by application.
Key Drivers for Dominant Regions/Segments:
- North America: High disposable incomes, strong cycling culture, and early adoption of e-bike technology.
- Europe: Extensive cycling infrastructure, government incentives for e-bikes, and environmental awareness.
- Pedal-Assisted E-bikes: Offers a balance between physical exertion and electric assistance, appealing to a wider range of riders.
- Leisure Application: Driven by the growing popularity of mountain biking as a recreational activity.
Mountain Bike Industry Product Developments
Recent product innovations focus on lighter weight frames, improved battery technology (longer range, faster charging), integrated electronics (GPS, connectivity), and enhanced suspension systems. Manufacturers are striving for greater customization options, catering to diverse rider preferences and skill levels. These advancements address key market needs for improved performance, convenience, and user experience.
Key Drivers of Mountain Bike Industry Growth
Technological advancements, particularly in battery technology and lightweight materials, are a primary driver. Increasing disposable incomes and a growing health-conscious population fuel demand for leisure activities, including cycling. Government incentives and supportive policies in various regions further stimulate market growth. For example, many European countries offer subsidies for e-bike purchases.
Challenges in the Mountain Bike Industry Market
Supply chain disruptions, particularly in sourcing raw materials and electronic components, pose significant challenges. Intense competition among established players and the entry of new competitors creates pricing pressure. Fluctuating raw material costs impact profitability. Stringent environmental regulations and evolving safety standards increase compliance costs for manufacturers.
Emerging Opportunities in Mountain Bike Industry
The integration of smart technology and connectivity in e-mountain bikes presents significant opportunities. Strategic partnerships between bike manufacturers and technology companies can foster innovation and create new market segments. Expanding into emerging markets with growing middle classes presents significant growth potential.
Leading Players in the Mountain Bike Industry Sector
- Yamaha Motor Co Ltd
- Trinx Bikes
- Pedego Electric Bikes
- Giant Manufacturing Co Ltd
- Scott Sports SA
- CUBE GmbH & Co KG
- Trek Bicycle Corporation
- BH Bike
- Pivot Cycles
Key Milestones in Mountain Bike Industry Industry
- December 2021: Hero Lectro launched 'F2i' and 'F3i' connected e-mountain bikes in India, signifying market expansion and technological advancements in emerging economies.
- March 2022: Ducati's launch of the Futa ultra-light race e-bike showcases innovation in high-performance e-mountain bikes and highlights the increasing focus on lightweight materials and powerful motors.
Strategic Outlook for Mountain Bike Industry Market
The mountain bike market is poised for continued growth, driven by technological innovation, expanding consumer base, and supportive government policies. Strategic investments in R&D, expansion into new markets, and strategic partnerships will be crucial for companies to capitalize on emerging opportunities and maintain a competitive edge in this dynamic sector. The market's future lies in the convergence of technology, sustainability, and superior user experience.
Mountain Bike Industry Segmentation
-
1. Propulsion Type
- 1.1. Pedal -assisted
- 1.2. Throttle-Assisted
-
2. Application
- 2.1. Leisure
- 2.2. Commuting
Mountain Bike Industry Segmentation By Geography
-
1. North America
- 1.1. United States
- 1.2. Canada
- 1.3. Rest of North America
-
2. Europe
- 2.1. Germany
- 2.2. United Kingdom
- 2.3. Italy
- 2.4. Switzerland
- 2.5. Rest of the Europe
-
3. Asia Pacific
- 3.1. China
- 3.2. India
- 3.3. Japan
- 3.4. South Korea
- 3.5. Rest of Asia Pacific
-
4. Rest of the World
- 4.1. South America
- 4.2. Middle East and Africa

Mountain Bike Industry REPORT HIGHLIGHTS
| Aspects | Details |
|---|---|
| Study Period | 2019-2033 |
| Base Year | 2024 |
| Estimated Year | 2025 |
| Forecast Period | 2025-2033 |
| Historical Period | 2019-2024 |
| Growth Rate | CAGR of 12.56% from 2019-2033 |
| Segmentation |
|
Table of Contents
- 1. Introduction
- 1.1. Research Scope
- 1.2. Market Segmentation
- 1.3. Research Methodology
- 1.4. Definitions and Assumptions
- 2. Executive Summary
- 2.1. Introduction
- 3. Market Dynamics
- 3.1. Introduction
- 3.2. Market Drivers
- 3.2.1. Rising Adoption of Electric Buses
- 3.3. Market Restrains
- 3.3.1. High Upfront Investment
- 3.4. Market Trends
- 3.4.1. Growing Demand for Sustainable Transportation
- 4. Market Factor Analysis
- 4.1. Porters Five Forces
- 4.2. Supply/Value Chain
- 4.3. PESTEL analysis
- 4.4. Market Entropy
- 4.5. Patent/Trademark Analysis
- 5. Global Mountain Bike Industry Analysis, Insights and Forecast, 2019-2031
- 5.1. Market Analysis, Insights and Forecast - by Propulsion Type
- 5.1.1. Pedal -assisted
- 5.1.2. Throttle-Assisted
- 5.2. Market Analysis, Insights and Forecast - by Application
- 5.2.1. Leisure
- 5.2.2. Commuting
- 5.3. Market Analysis, Insights and Forecast - by Region
- 5.3.1. North America
- 5.3.2. Europe
- 5.3.3. Asia Pacific
- 5.3.4. Rest of the World
- 5.1. Market Analysis, Insights and Forecast - by Propulsion Type
- 6. North America Mountain Bike Industry Analysis, Insights and Forecast, 2019-2031
- 6.1. Market Analysis, Insights and Forecast - by Propulsion Type
- 6.1.1. Pedal -assisted
- 6.1.2. Throttle-Assisted
- 6.2. Market Analysis, Insights and Forecast - by Application
- 6.2.1. Leisure
- 6.2.2. Commuting
- 6.1. Market Analysis, Insights and Forecast - by Propulsion Type
- 7. Europe Mountain Bike Industry Analysis, Insights and Forecast, 2019-2031
- 7.1. Market Analysis, Insights and Forecast - by Propulsion Type
- 7.1.1. Pedal -assisted
- 7.1.2. Throttle-Assisted
- 7.2. Market Analysis, Insights and Forecast - by Application
- 7.2.1. Leisure
- 7.2.2. Commuting
- 7.1. Market Analysis, Insights and Forecast - by Propulsion Type
- 8. Asia Pacific Mountain Bike Industry Analysis, Insights and Forecast, 2019-2031
- 8.1. Market Analysis, Insights and Forecast - by Propulsion Type
- 8.1.1. Pedal -assisted
- 8.1.2. Throttle-Assisted
- 8.2. Market Analysis, Insights and Forecast - by Application
- 8.2.1. Leisure
- 8.2.2. Commuting
- 8.1. Market Analysis, Insights and Forecast - by Propulsion Type
- 9. Rest of the World Mountain Bike Industry Analysis, Insights and Forecast, 2019-2031
- 9.1. Market Analysis, Insights and Forecast - by Propulsion Type
- 9.1.1. Pedal -assisted
- 9.1.2. Throttle-Assisted
- 9.2. Market Analysis, Insights and Forecast - by Application
- 9.2.1. Leisure
- 9.2.2. Commuting
- 9.1. Market Analysis, Insights and Forecast - by Propulsion Type
- 10. North America Mountain Bike Industry Analysis, Insights and Forecast, 2019-2031
- 10.1. Market Analysis, Insights and Forecast - By Country/Sub-region
- 10.1.1 United States
- 10.1.2 Canada
- 10.1.3 Rest of North America
- 11. Europe Mountain Bike Industry Analysis, Insights and Forecast, 2019-2031
- 11.1. Market Analysis, Insights and Forecast - By Country/Sub-region
- 11.1.1 Germany
- 11.1.2 United Kingdom
- 11.1.3 Italy
- 11.1.4 Switzerland
- 11.1.5 Rest of the Europe
- 12. Asia Pacific Mountain Bike Industry Analysis, Insights and Forecast, 2019-2031
- 12.1. Market Analysis, Insights and Forecast - By Country/Sub-region
- 12.1.1 China
- 12.1.2 India
- 12.1.3 Japan
- 12.1.4 South Korea
- 12.1.5 Rest of Asia Pacific
- 13. Rest of the World Mountain Bike Industry Analysis, Insights and Forecast, 2019-2031
- 13.1. Market Analysis, Insights and Forecast - By Country/Sub-region
- 13.1.1 South America
- 13.1.2 Middle East and Africa
- 14. Competitive Analysis
- 14.1. Global Market Share Analysis 2024
- 14.2. Company Profiles
- 14.2.1 Yamaha Motor Co Ltd
- 14.2.1.1. Overview
- 14.2.1.2. Products
- 14.2.1.3. SWOT Analysis
- 14.2.1.4. Recent Developments
- 14.2.1.5. Financials (Based on Availability)
- 14.2.2 Trinx Bikes
- 14.2.2.1. Overview
- 14.2.2.2. Products
- 14.2.2.3. SWOT Analysis
- 14.2.2.4. Recent Developments
- 14.2.2.5. Financials (Based on Availability)
- 14.2.3 Pedego Electric Bikes
- 14.2.3.1. Overview
- 14.2.3.2. Products
- 14.2.3.3. SWOT Analysis
- 14.2.3.4. Recent Developments
- 14.2.3.5. Financials (Based on Availability)
- 14.2.4 Giant Manufacturing Co Ltd
- 14.2.4.1. Overview
- 14.2.4.2. Products
- 14.2.4.3. SWOT Analysis
- 14.2.4.4. Recent Developments
- 14.2.4.5. Financials (Based on Availability)
- 14.2.5 Scott Sports SA
- 14.2.5.1. Overview
- 14.2.5.2. Products
- 14.2.5.3. SWOT Analysis
- 14.2.5.4. Recent Developments
- 14.2.5.5. Financials (Based on Availability)
- 14.2.6 CUBE GmbH & Co KG
- 14.2.6.1. Overview
- 14.2.6.2. Products
- 14.2.6.3. SWOT Analysis
- 14.2.6.4. Recent Developments
- 14.2.6.5. Financials (Based on Availability)
- 14.2.7 Trek Bicycle Corporation
- 14.2.7.1. Overview
- 14.2.7.2. Products
- 14.2.7.3. SWOT Analysis
- 14.2.7.4. Recent Developments
- 14.2.7.5. Financials (Based on Availability)
- 14.2.8 BH Bike
- 14.2.8.1. Overview
- 14.2.8.2. Products
- 14.2.8.3. SWOT Analysis
- 14.2.8.4. Recent Developments
- 14.2.8.5. Financials (Based on Availability)
- 14.2.9 Pivot Cycles
- 14.2.9.1. Overview
- 14.2.9.2. Products
- 14.2.9.3. SWOT Analysis
- 14.2.9.4. Recent Developments
- 14.2.9.5. Financials (Based on Availability)
- 14.2.1 Yamaha Motor Co Ltd
List of Figures
- Figure 1: Global Mountain Bike Industry Revenue Breakdown (Million, %) by Region 2024 & 2032
- Figure 2: North America Mountain Bike Industry Revenue (Million), by Country 2024 & 2032
- Figure 3: North America Mountain Bike Industry Revenue Share (%), by Country 2024 & 2032
- Figure 4: Europe Mountain Bike Industry Revenue (Million), by Country 2024 & 2032
- Figure 5: Europe Mountain Bike Industry Revenue Share (%), by Country 2024 & 2032
- Figure 6: Asia Pacific Mountain Bike Industry Revenue (Million), by Country 2024 & 2032
- Figure 7: Asia Pacific Mountain Bike Industry Revenue Share (%), by Country 2024 & 2032
- Figure 8: Rest of the World Mountain Bike Industry Revenue (Million), by Country 2024 & 2032
- Figure 9: Rest of the World Mountain Bike Industry Revenue Share (%), by Country 2024 & 2032
- Figure 10: North America Mountain Bike Industry Revenue (Million), by Propulsion Type 2024 & 2032
- Figure 11: North America Mountain Bike Industry Revenue Share (%), by Propulsion Type 2024 & 2032
- Figure 12: North America Mountain Bike Industry Revenue (Million), by Application 2024 & 2032
- Figure 13: North America Mountain Bike Industry Revenue Share (%), by Application 2024 & 2032
- Figure 14: North America Mountain Bike Industry Revenue (Million), by Country 2024 & 2032
- Figure 15: North America Mountain Bike Industry Revenue Share (%), by Country 2024 & 2032
- Figure 16: Europe Mountain Bike Industry Revenue (Million), by Propulsion Type 2024 & 2032
- Figure 17: Europe Mountain Bike Industry Revenue Share (%), by Propulsion Type 2024 & 2032
- Figure 18: Europe Mountain Bike Industry Revenue (Million), by Application 2024 & 2032
- Figure 19: Europe Mountain Bike Industry Revenue Share (%), by Application 2024 & 2032
- Figure 20: Europe Mountain Bike Industry Revenue (Million), by Country 2024 & 2032
- Figure 21: Europe Mountain Bike Industry Revenue Share (%), by Country 2024 & 2032
- Figure 22: Asia Pacific Mountain Bike Industry Revenue (Million), by Propulsion Type 2024 & 2032
- Figure 23: Asia Pacific Mountain Bike Industry Revenue Share (%), by Propulsion Type 2024 & 2032
- Figure 24: Asia Pacific Mountain Bike Industry Revenue (Million), by Application 2024 & 2032
- Figure 25: Asia Pacific Mountain Bike Industry Revenue Share (%), by Application 2024 & 2032
- Figure 26: Asia Pacific Mountain Bike Industry Revenue (Million), by Country 2024 & 2032
- Figure 27: Asia Pacific Mountain Bike Industry Revenue Share (%), by Country 2024 & 2032
- Figure 28: Rest of the World Mountain Bike Industry Revenue (Million), by Propulsion Type 2024 & 2032
- Figure 29: Rest of the World Mountain Bike Industry Revenue Share (%), by Propulsion Type 2024 & 2032
- Figure 30: Rest of the World Mountain Bike Industry Revenue (Million), by Application 2024 & 2032
- Figure 31: Rest of the World Mountain Bike Industry Revenue Share (%), by Application 2024 & 2032
- Figure 32: Rest of the World Mountain Bike Industry Revenue (Million), by Country 2024 & 2032
- Figure 33: Rest of the World Mountain Bike Industry Revenue Share (%), by Country 2024 & 2032
List of Tables
- Table 1: Global Mountain Bike Industry Revenue Million Forecast, by Region 2019 & 2032
- Table 2: Global Mountain Bike Industry Revenue Million Forecast, by Propulsion Type 2019 & 2032
- Table 3: Global Mountain Bike Industry Revenue Million Forecast, by Application 2019 & 2032
- Table 4: Global Mountain Bike Industry Revenue Million Forecast, by Region 2019 & 2032
- Table 5: Global Mountain Bike Industry Revenue Million Forecast, by Country 2019 & 2032
- Table 6: United States Mountain Bike Industry Revenue (Million) Forecast, by Application 2019 & 2032
- Table 7: Canada Mountain Bike Industry Revenue (Million) Forecast, by Application 2019 & 2032
- Table 8: Rest of North America Mountain Bike Industry Revenue (Million) Forecast, by Application 2019 & 2032
- Table 9: Global Mountain Bike Industry Revenue Million Forecast, by Country 2019 & 2032
- Table 10: Germany Mountain Bike Industry Revenue (Million) Forecast, by Application 2019 & 2032
- Table 11: United Kingdom Mountain Bike Industry Revenue (Million) Forecast, by Application 2019 & 2032
- Table 12: Italy Mountain Bike Industry Revenue (Million) Forecast, by Application 2019 & 2032
- Table 13: Switzerland Mountain Bike Industry Revenue (Million) Forecast, by Application 2019 & 2032
- Table 14: Rest of the Europe Mountain Bike Industry Revenue (Million) Forecast, by Application 2019 & 2032
- Table 15: Global Mountain Bike Industry Revenue Million Forecast, by Country 2019 & 2032
- Table 16: China Mountain Bike Industry Revenue (Million) Forecast, by Application 2019 & 2032
- Table 17: India Mountain Bike Industry Revenue (Million) Forecast, by Application 2019 & 2032
- Table 18: Japan Mountain Bike Industry Revenue (Million) Forecast, by Application 2019 & 2032
- Table 19: South Korea Mountain Bike Industry Revenue (Million) Forecast, by Application 2019 & 2032
- Table 20: Rest of Asia Pacific Mountain Bike Industry Revenue (Million) Forecast, by Application 2019 & 2032
- Table 21: Global Mountain Bike Industry Revenue Million Forecast, by Country 2019 & 2032
- Table 22: South America Mountain Bike Industry Revenue (Million) Forecast, by Application 2019 & 2032
- Table 23: Middle East and Africa Mountain Bike Industry Revenue (Million) Forecast, by Application 2019 & 2032
- Table 24: Global Mountain Bike Industry Revenue Million Forecast, by Propulsion Type 2019 & 2032
- Table 25: Global Mountain Bike Industry Revenue Million Forecast, by Application 2019 & 2032
- Table 26: Global Mountain Bike Industry Revenue Million Forecast, by Country 2019 & 2032
- Table 27: United States Mountain Bike Industry Revenue (Million) Forecast, by Application 2019 & 2032
- Table 28: Canada Mountain Bike Industry Revenue (Million) Forecast, by Application 2019 & 2032
- Table 29: Rest of North America Mountain Bike Industry Revenue (Million) Forecast, by Application 2019 & 2032
- Table 30: Global Mountain Bike Industry Revenue Million Forecast, by Propulsion Type 2019 & 2032
- Table 31: Global Mountain Bike Industry Revenue Million Forecast, by Application 2019 & 2032
- Table 32: Global Mountain Bike Industry Revenue Million Forecast, by Country 2019 & 2032
- Table 33: Germany Mountain Bike Industry Revenue (Million) Forecast, by Application 2019 & 2032
- Table 34: United Kingdom Mountain Bike Industry Revenue (Million) Forecast, by Application 2019 & 2032
- Table 35: Italy Mountain Bike Industry Revenue (Million) Forecast, by Application 2019 & 2032
- Table 36: Switzerland Mountain Bike Industry Revenue (Million) Forecast, by Application 2019 & 2032
- Table 37: Rest of the Europe Mountain Bike Industry Revenue (Million) Forecast, by Application 2019 & 2032
- Table 38: Global Mountain Bike Industry Revenue Million Forecast, by Propulsion Type 2019 & 2032
- Table 39: Global Mountain Bike Industry Revenue Million Forecast, by Application 2019 & 2032
- Table 40: Global Mountain Bike Industry Revenue Million Forecast, by Country 2019 & 2032
- Table 41: China Mountain Bike Industry Revenue (Million) Forecast, by Application 2019 & 2032
- Table 42: India Mountain Bike Industry Revenue (Million) Forecast, by Application 2019 & 2032
- Table 43: Japan Mountain Bike Industry Revenue (Million) Forecast, by Application 2019 & 2032
- Table 44: South Korea Mountain Bike Industry Revenue (Million) Forecast, by Application 2019 & 2032
- Table 45: Rest of Asia Pacific Mountain Bike Industry Revenue (Million) Forecast, by Application 2019 & 2032
- Table 46: Global Mountain Bike Industry Revenue Million Forecast, by Propulsion Type 2019 & 2032
- Table 47: Global Mountain Bike Industry Revenue Million Forecast, by Application 2019 & 2032
- Table 48: Global Mountain Bike Industry Revenue Million Forecast, by Country 2019 & 2032
- Table 49: South America Mountain Bike Industry Revenue (Million) Forecast, by Application 2019 & 2032
- Table 50: Middle East and Africa Mountain Bike Industry Revenue (Million) Forecast, by Application 2019 & 2032
Frequently Asked Questions
1. What is the projected Compound Annual Growth Rate (CAGR) of the Mountain Bike Industry?
The projected CAGR is approximately 12.56%.
2. Which companies are prominent players in the Mountain Bike Industry?
Key companies in the market include Yamaha Motor Co Ltd, Trinx Bikes, Pedego Electric Bikes, Giant Manufacturing Co Ltd, Scott Sports SA, CUBE GmbH & Co KG, Trek Bicycle Corporation, BH Bike, Pivot Cycles.
3. What are the main segments of the Mountain Bike Industry?
The market segments include Propulsion Type, Application.
4. Can you provide details about the market size?
The market size is estimated to be USD 5.77 Million as of 2022.
5. What are some drivers contributing to market growth?
Rising Adoption of Electric Buses.
6. What are the notable trends driving market growth?
Growing Demand for Sustainable Transportation.
7. Are there any restraints impacting market growth?
High Upfront Investment.
8. Can you provide examples of recent developments in the market?
March 2022: Ducati unveiled its new range of electric bikes, including the Futa, a new ultra-light race e-bike. The Futa features a carbon fiber monocoque frame with sports endurance geometry, and the motor is located on the rear hub and is an FSA System HM 1.0 with 250W and 31 lb-ft of torque.
9. What pricing options are available for accessing the report?
Pricing options include single-user, multi-user, and enterprise licenses priced at USD 4750, USD 5250, and USD 8750 respectively.
10. Is the market size provided in terms of value or volume?
The market size is provided in terms of value, measured in Million.
11. Are there any specific market keywords associated with the report?
Yes, the market keyword associated with the report is "Mountain Bike Industry," which aids in identifying and referencing the specific market segment covered.
12. How do I determine which pricing option suits my needs best?
The pricing options vary based on user requirements and access needs. Individual users may opt for single-user licenses, while businesses requiring broader access may choose multi-user or enterprise licenses for cost-effective access to the report.
13. Are there any additional resources or data provided in the Mountain Bike Industry report?
While the report offers comprehensive insights, it's advisable to review the specific contents or supplementary materials provided to ascertain if additional resources or data are available.
14. How can I stay updated on further developments or reports in the Mountain Bike Industry?
To stay informed about further developments, trends, and reports in the Mountain Bike Industry, consider subscribing to industry newsletters, following relevant companies and organizations, or regularly checking reputable industry news sources and publications.
Methodology
Step 1 - Identification of Relevant Samples Size from Population Database


Step 2 - Approaches for Defining Global Market Size (Value, Volume* & Price*)

Note*: In applicable scenarios
Step 3 - Data Sources
Primary Research
- Web Analytics
- Survey Reports
- Research Institute
- Latest Research Reports
- Opinion Leaders
Secondary Research
- Annual Reports
- White Paper
- Latest Press Release
- Industry Association
- Paid Database
- Investor Presentations

Step 4 - Data Triangulation
Involves using different sources of information in order to increase the validity of a study
These sources are likely to be stakeholders in a program - participants, other researchers, program staff, other community members, and so on.
Then we put all data in single framework & apply various statistical tools to find out the dynamic on the market.
During the analysis stage, feedback from the stakeholder groups would be compared to determine areas of agreement as well as areas of divergence
