

Key Insights
The global molluscicides market, valued at approximately $837.82 million in 2025, is projected for significant expansion with a Compound Annual Growth Rate (CAGR) of 9.67% from 2025 to 2033. This growth is propelled by increasing mollusk-induced crop damage in intensive agricultural regions, driving demand for effective control. A growing emphasis on sustainable agriculture and environmental impact awareness is accelerating the adoption of eco-friendly molluscicides. Technological advancements, including novel formulations and targeted application methods such as chemigation and foliar sprays, are further fueling market growth. Substantial growth is expected across fruits & vegetables, grains & cereals, and commercial crops, crucial for yield protection and food security. The market is segmented by application mode (chemigation, foliar, fumigation, soil treatment) and crop type (commercial crops, fruits & vegetables, grains & cereals, pulses & oilseeds, turf & ornamental), offering diverse opportunities.
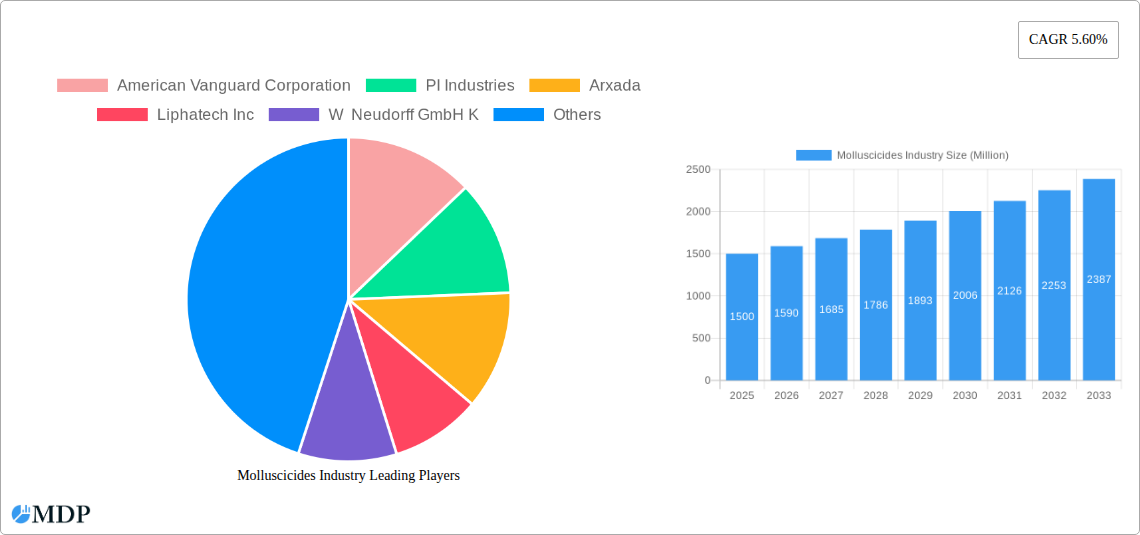
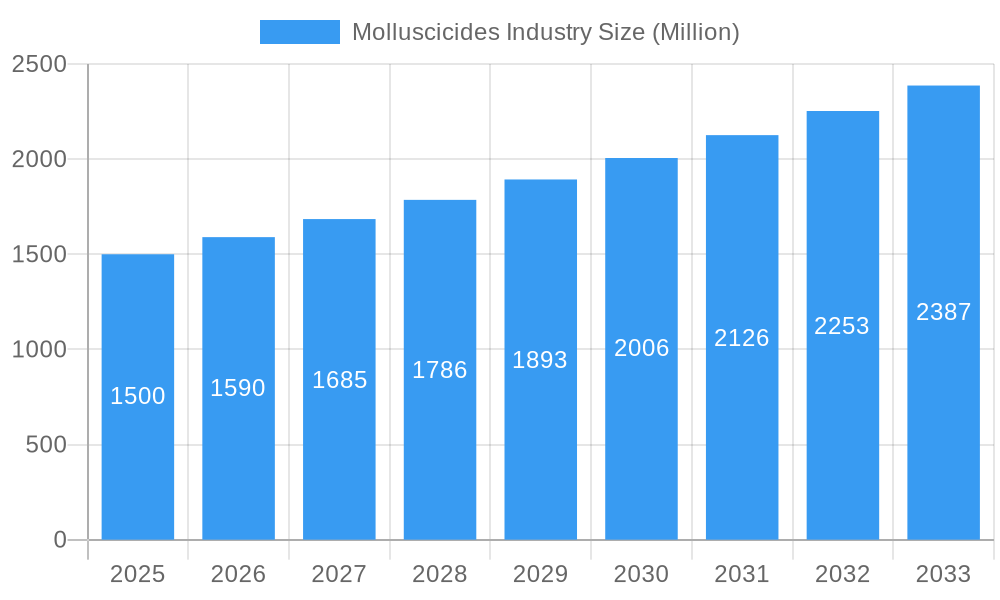
Molluscicides Industry Market Size (In Million)
Key market players including American Vanguard Corporation, PI Industries, Arxada, Liphatech Inc, W Neudorff GmbH K, Mitsui & Co Ltd (Certis Belchim), UPL Limited, and Nufarm Ltd are actively pursuing R&D, product innovation, and strategic collaborations to strengthen their market presence. Potential restraints include stringent pesticide regulations, volatile raw material prices, and mollusk resistance development. Nevertheless, the long-term outlook for the molluscicides market remains robust, driven by the ongoing need for efficient and sustainable pest management solutions in agriculture and horticulture. Future expansion will likely be shaped by evolving consumer preferences for organic produce, increasing demand for bio-based and less-toxic molluscicides.
Molluscicides Industry Company Market Share
Molluscicides Industry Market Report: 2019-2033
This comprehensive report provides an in-depth analysis of the global molluscicides industry, offering invaluable insights for stakeholders, investors, and industry professionals. The report covers market dynamics, trends, leading players, and future growth prospects, leveraging data from the historical period (2019-2024), base year (2025), and forecast period (2025-2033). The global market size is projected to reach xx Million by 2033, exhibiting a CAGR of xx% during the forecast period.
Molluscicides Industry Market Dynamics & Concentration
The global molluscicides market is characterized by a moderately concentrated landscape, with a few major players holding significant market share. American Vanguard Corporation, PI Industries, Arxada, Liphatech Inc, W Neudorff GmbH K, Mitsui & Co Ltd (Certis Belchim), UPL Limited, and Nufarm Ltd are some of the key players shaping the industry. The market share of these companies varies, with the top three holding approximately xx% collectively in 2024. Market concentration is influenced by factors such as economies of scale, R&D capabilities, and access to distribution networks.
Innovation within the industry is driven by the need for more effective, environmentally friendly, and cost-efficient molluscicides. Regulatory frameworks, varying across regions, significantly impact product approvals and market access. The industry witnesses continuous development of new formulations and active ingredients to address growing resistance and enhance efficacy. Product substitutes, such as biological control methods and integrated pest management (IPM) strategies, are emerging but currently hold a relatively small market share of xx%. End-user trends reflect a growing preference for sustainable and eco-friendly solutions, driving demand for bio-based molluscicides.
Mergers and acquisitions (M&A) activity has been significant, particularly in recent years. Key M&A deals have reshaped the competitive landscape, creating larger, more diversified companies with a broader product portfolio. The number of M&A deals in the molluscicides industry averaged xx per year during the historical period.
- Key Metrics:
- Market Size (2024): xx Million
- Top 3 Players Market Share (2024): xx%
- Average Annual M&A Deals (2019-2024): xx
Molluscicides Industry Trends & Analysis
The molluscicides market is experiencing robust growth, driven by factors including the increasing prevalence of mollusk pests impacting various crops and landscapes, rising demand for high-quality agricultural produce, and growing awareness regarding crop protection. Technological advancements in formulation and delivery systems are further contributing to market expansion. The market is witnessing a shift towards targeted and precise application techniques, minimizing environmental impact while maximizing efficacy. Consumer preferences lean towards environmentally responsible products with minimal human health risks.
Competitive dynamics are intensely shaped by continuous innovation, price competition, and the development of novel formulations with improved efficacy and safety profiles. The market is segmented by application mode (chemigation, foliar, fumigation, soil treatment) and crop type (commercial crops, fruits & vegetables, grains & cereals, pulses & oilseeds, turf & ornamental). Specific CAGR data for these segments is under analysis and will be included in the final report, but is estimated to be between xx% and xx% depending on the segment. Market penetration for different molluscicicide types varies significantly, with chemical molluscicides still dominating. However, the adoption of biological control methods is gradually increasing.
Leading Markets & Segments in Molluscicides Industry
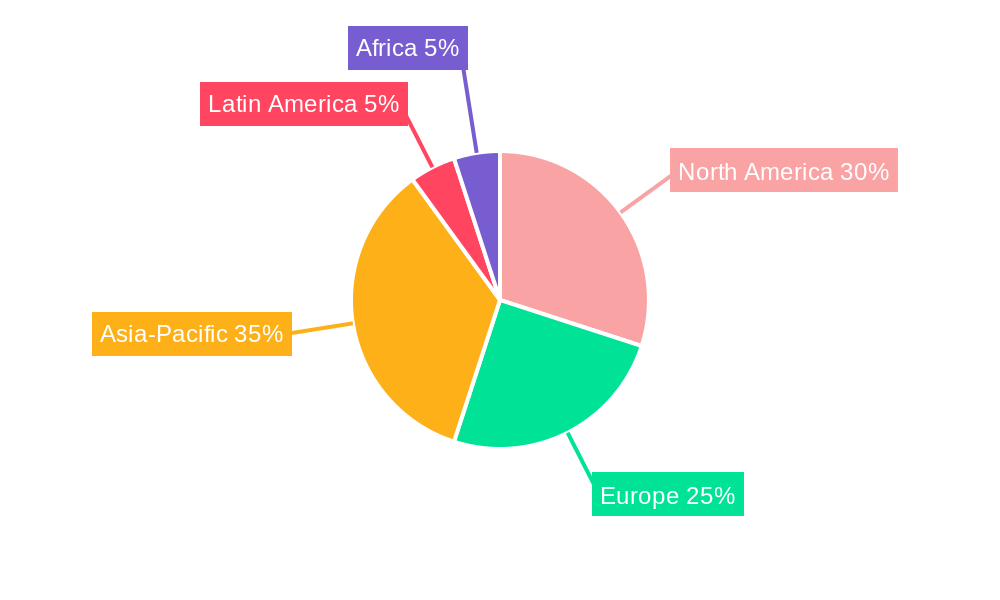
The dominant regions for molluscicides are expected to be North America, Europe, and Asia-Pacific, primarily driven by large agricultural sectors and high mollusk pest pressures. Within these regions, specific countries like the US, China, and India are emerging as key markets.
Key Drivers:
- North America: Strong agricultural sector, high adoption of advanced farming techniques, favorable regulatory environment.
- Europe: Stringent environmental regulations driving demand for sustainable solutions, significant investment in agricultural research.
- Asia-Pacific: Rapidly expanding agricultural industry, increasing awareness of crop protection, rising disposable incomes.
Segment Dominance:
- Application Mode: Soil treatment currently holds the largest market share due to its effectiveness in controlling soil-borne mollusks. However, foliar application is expected to experience significant growth due to its ease of use and targeted application.
- Crop Type: Fruits and vegetables, and commercial crops are the dominant segments due to the high economic value of these crops and the significant damage caused by mollusk pests.
Molluscicides Industry Product Developments
Recent product innovations focus on developing safer and more effective molluscicides, incorporating advanced formulations with improved efficacy, reduced environmental impact, and targeted delivery mechanisms. The industry is witnessing a growing trend toward biopesticides and integrated pest management (IPM) strategies. These developments cater to increasing consumer demand for environmentally friendly and sustainable crop protection solutions.
Key Drivers of Molluscicides Industry Growth
Several factors contribute to the molluscicides industry's growth: rising agricultural output, increasing mollusk infestations in various crops, growing demand for sustainable and eco-friendly solutions, and the development of advanced molluscicides with better efficacy and reduced environmental impact. Favorable government regulations and policies supporting sustainable agriculture also contribute to market expansion.
Challenges in the Molluscicides Industry Market
The industry faces challenges including stringent regulatory approvals, fluctuating raw material prices impacting production costs, and the emergence of bio-based alternatives that may challenge the market share of traditional chemical molluscicides. Supply chain disruptions and competitive pressure from established and emerging players are additional restraints. The overall impact of these challenges is estimated to result in xx Million loss in revenue annually.
Emerging Opportunities in Molluscicides Industry
Emerging opportunities include technological advancements in formulation and delivery systems, increasing adoption of bio-based molluscicides, and expansion into new geographical markets. Strategic partnerships between chemical companies and biotechnology firms offer significant potential for developing novel and sustainable molluscicides.
Leading Players in the Molluscicides Industry Sector
- American Vanguard Corporation
- PI Industries
- Arxada
- Liphatech Inc
- W Neudorff GmbH K
- Mitsui & Co Ltd (Certis Belchim)
- UPL Limited
- Nufarm Ltd
Key Milestones in Molluscicides Industry Industry
- June 2021: Belchim Crop Protection was fully acquired by Mitsui & Co. Ltd, strengthening Mitsui's position in the European crop protection market.
- March 2022: Formation of Certis Belchim BV through the merger of Belchim Crop Protection and Certis Europe, creating a larger, more integrated entity.
- November 2022: Certis Belchim BV acquired the assets of Henry Manufacturing Limited, expanding its portfolio of potassium fatty-acid salts for crop protection applications.
Strategic Outlook for Molluscicides Industry Market
The molluscicides market is poised for continued growth driven by rising demand for efficient and sustainable crop protection solutions. Strategic partnerships, innovation in product development, and expansion into emerging markets will be key to capturing future opportunities. The market is projected to witness significant expansion, particularly in the biopesticide segment, driven by consumer preference and environmental regulations.
Molluscicides Industry Segmentation
- 1. Production Analysis
- 2. Consumption Analysis
- 3. Import Market Analysis (Value & Volume)
- 4. Export Market Analysis (Value & Volume)
- 5. Price Trend Analysis
Molluscicides Industry Segmentation By Geography
-
1. North America
- 1.1. United States
- 1.2. Canada
- 1.3. Mexico
-
2. South America
- 2.1. Brazil
- 2.2. Argentina
- 2.3. Rest of South America
-
3. Europe
- 3.1. United Kingdom
- 3.2. Germany
- 3.3. France
- 3.4. Italy
- 3.5. Spain
- 3.6. Russia
- 3.7. Benelux
- 3.8. Nordics
- 3.9. Rest of Europe
-
4. Middle East & Africa
- 4.1. Turkey
- 4.2. Israel
- 4.3. GCC
- 4.4. North Africa
- 4.5. South Africa
- 4.6. Rest of Middle East & Africa
-
5. Asia Pacific
- 5.1. China
- 5.2. India
- 5.3. Japan
- 5.4. South Korea
- 5.5. ASEAN
- 5.6. Oceania
- 5.7. Rest of Asia Pacific
Molluscicides Industry Regional Market Share
Geographic Coverage of Molluscicides Industry
Molluscicides Industry REPORT HIGHLIGHTS
| Aspects | Details |
|---|---|
| Study Period | 2020-2034 |
| Base Year | 2025 |
| Estimated Year | 2026 |
| Forecast Period | 2026-2034 |
| Historical Period | 2020-2025 |
| Growth Rate | CAGR of 9.67% from 2020-2034 |
| Segmentation |
|
Table of Contents
- 1. Introduction
- 1.1. Research Scope
- 1.2. Market Segmentation
- 1.3. Research Objective
- 1.4. Definitions and Assumptions
- 2. Executive Summary
- 2.1. Market Snapshot
- 3. Market Dynamics
- 3.1. Market Drivers
- 3.2. Market Restrains
- 3.3. Market Trends
- 3.4. Market Opportunities
- 4. Market Factor Analysis
- 4.1. Porters Five Forces
- 4.1.1. Bargaining Power of Suppliers
- 4.1.2. Bargaining Power of Buyers
- 4.1.3. Threat of New Entrants
- 4.1.4. Threat of Substitutes
- 4.1.5. Competitive Rivalry
- 4.2. PESTEL analysis
- 4.3. BCG Analysis
- 4.3.1. Stars (High Growth, High Market Share)
- 4.3.2. Cash Cows (Low Growth, High Market Share)
- 4.3.3. Question Mark (High Growth, Low Market Share)
- 4.3.4. Dogs (Low Growth, Low Market Share)
- 4.4. Ansoff Matrix Analysis
- 4.5. Supply Chain Analysis
- 4.6. Regulatory Landscape
- 4.7. Current Market Potential and Opportunity Assessment (TAM–SAM–SOM Framework)
- 4.8. MDP Analyst Note
- 4.1. Porters Five Forces
- 5. Market Analysis, Insights and Forecast 2021-2033
- 5.1. Market Analysis, Insights and Forecast - by Production Analysis
- 5.2. Market Analysis, Insights and Forecast - by Consumption Analysis
- 5.3. Market Analysis, Insights and Forecast - by Import Market Analysis (Value & Volume)
- 5.4. Market Analysis, Insights and Forecast - by Export Market Analysis (Value & Volume)
- 5.5. Market Analysis, Insights and Forecast - by Price Trend Analysis
- 5.6. Market Analysis, Insights and Forecast - by Region
- 5.6.1. North America
- 5.6.2. South America
- 5.6.3. Europe
- 5.6.4. Middle East & Africa
- 5.6.5. Asia Pacific
- 6. Global Molluscicides Industry Analysis, Insights and Forecast, 2021-2033
- 6.1. Market Analysis, Insights and Forecast - by Production Analysis
- 6.2. Market Analysis, Insights and Forecast - by Consumption Analysis
- 6.3. Market Analysis, Insights and Forecast - by Import Market Analysis (Value & Volume)
- 6.4. Market Analysis, Insights and Forecast - by Export Market Analysis (Value & Volume)
- 6.5. Market Analysis, Insights and Forecast - by Price Trend Analysis
- 7. North America Molluscicides Industry Analysis, Insights and Forecast, 2020-2032
- 7.1. Market Analysis, Insights and Forecast - by Production Analysis
- 7.2. Market Analysis, Insights and Forecast - by Consumption Analysis
- 7.3. Market Analysis, Insights and Forecast - by Import Market Analysis (Value & Volume)
- 7.4. Market Analysis, Insights and Forecast - by Export Market Analysis (Value & Volume)
- 7.5. Market Analysis, Insights and Forecast - by Price Trend Analysis
- 8. South America Molluscicides Industry Analysis, Insights and Forecast, 2020-2032
- 8.1. Market Analysis, Insights and Forecast - by Production Analysis
- 8.2. Market Analysis, Insights and Forecast - by Consumption Analysis
- 8.3. Market Analysis, Insights and Forecast - by Import Market Analysis (Value & Volume)
- 8.4. Market Analysis, Insights and Forecast - by Export Market Analysis (Value & Volume)
- 8.5. Market Analysis, Insights and Forecast - by Price Trend Analysis
- 9. Europe Molluscicides Industry Analysis, Insights and Forecast, 2020-2032
- 9.1. Market Analysis, Insights and Forecast - by Production Analysis
- 9.2. Market Analysis, Insights and Forecast - by Consumption Analysis
- 9.3. Market Analysis, Insights and Forecast - by Import Market Analysis (Value & Volume)
- 9.4. Market Analysis, Insights and Forecast - by Export Market Analysis (Value & Volume)
- 9.5. Market Analysis, Insights and Forecast - by Price Trend Analysis
- 10. Middle East & Africa Molluscicides Industry Analysis, Insights and Forecast, 2020-2032
- 10.1. Market Analysis, Insights and Forecast - by Production Analysis
- 10.2. Market Analysis, Insights and Forecast - by Consumption Analysis
- 10.3. Market Analysis, Insights and Forecast - by Import Market Analysis (Value & Volume)
- 10.4. Market Analysis, Insights and Forecast - by Export Market Analysis (Value & Volume)
- 10.5. Market Analysis, Insights and Forecast - by Price Trend Analysis
- 11. Asia Pacific Molluscicides Industry Analysis, Insights and Forecast, 2020-2032
- 11.1. Market Analysis, Insights and Forecast - by Production Analysis
- 11.2. Market Analysis, Insights and Forecast - by Consumption Analysis
- 11.3. Market Analysis, Insights and Forecast - by Import Market Analysis (Value & Volume)
- 11.4. Market Analysis, Insights and Forecast - by Export Market Analysis (Value & Volume)
- 11.5. Market Analysis, Insights and Forecast - by Price Trend Analysis
- 12. Competitive Analysis
- 12.1. Company Profiles
- 12.1.1 American Vanguard Corporation
- 12.1.1.1. Company Overview
- 12.1.1.2. Products
- 12.1.1.3. Company Financials
- 12.1.1.4. SWOT Analysis
- 12.1.2 PI Industries
- 12.1.2.1. Company Overview
- 12.1.2.2. Products
- 12.1.2.3. Company Financials
- 12.1.2.4. SWOT Analysis
- 12.1.3 Arxada
- 12.1.3.1. Company Overview
- 12.1.3.2. Products
- 12.1.3.3. Company Financials
- 12.1.3.4. SWOT Analysis
- 12.1.4 Liphatech Inc
- 12.1.4.1. Company Overview
- 12.1.4.2. Products
- 12.1.4.3. Company Financials
- 12.1.4.4. SWOT Analysis
- 12.1.5 W Neudorff GmbH K
- 12.1.5.1. Company Overview
- 12.1.5.2. Products
- 12.1.5.3. Company Financials
- 12.1.5.4. SWOT Analysis
- 12.1.6 Mitsui & Co Ltd (Certis Belchim)
- 12.1.6.1. Company Overview
- 12.1.6.2. Products
- 12.1.6.3. Company Financials
- 12.1.6.4. SWOT Analysis
- 12.1.7 UPL Limited
- 12.1.7.1. Company Overview
- 12.1.7.2. Products
- 12.1.7.3. Company Financials
- 12.1.7.4. SWOT Analysis
- 12.1.8 Nufarm Ltd
- 12.1.8.1. Company Overview
- 12.1.8.2. Products
- 12.1.8.3. Company Financials
- 12.1.8.4. SWOT Analysis
- 12.1.1 American Vanguard Corporation
- 12.2. Market Entropy
- 12.2.1 Company's Key Areas Served
- 12.2.2 Recent Developments
- 12.3. Company Market Share Analysis 2025
- 12.3.1 Top 5 Companies Market Share Analysis
- 12.3.2 Top 3 Companies Market Share Analysis
- 12.4. List of Potential Customers
- 13. Research Methodology
List of Figures
- Figure 1: Global Molluscicides Industry Revenue Breakdown (million, %) by Region 2025 & 2033
- Figure 2: North America Molluscicides Industry Revenue (million), by Production Analysis 2025 & 2033
- Figure 3: North America Molluscicides Industry Revenue Share (%), by Production Analysis 2025 & 2033
- Figure 4: North America Molluscicides Industry Revenue (million), by Consumption Analysis 2025 & 2033
- Figure 5: North America Molluscicides Industry Revenue Share (%), by Consumption Analysis 2025 & 2033
- Figure 6: North America Molluscicides Industry Revenue (million), by Import Market Analysis (Value & Volume) 2025 & 2033
- Figure 7: North America Molluscicides Industry Revenue Share (%), by Import Market Analysis (Value & Volume) 2025 & 2033
- Figure 8: North America Molluscicides Industry Revenue (million), by Export Market Analysis (Value & Volume) 2025 & 2033
- Figure 9: North America Molluscicides Industry Revenue Share (%), by Export Market Analysis (Value & Volume) 2025 & 2033
- Figure 10: North America Molluscicides Industry Revenue (million), by Price Trend Analysis 2025 & 2033
- Figure 11: North America Molluscicides Industry Revenue Share (%), by Price Trend Analysis 2025 & 2033
- Figure 12: North America Molluscicides Industry Revenue (million), by Country 2025 & 2033
- Figure 13: North America Molluscicides Industry Revenue Share (%), by Country 2025 & 2033
- Figure 14: South America Molluscicides Industry Revenue (million), by Production Analysis 2025 & 2033
- Figure 15: South America Molluscicides Industry Revenue Share (%), by Production Analysis 2025 & 2033
- Figure 16: South America Molluscicides Industry Revenue (million), by Consumption Analysis 2025 & 2033
- Figure 17: South America Molluscicides Industry Revenue Share (%), by Consumption Analysis 2025 & 2033
- Figure 18: South America Molluscicides Industry Revenue (million), by Import Market Analysis (Value & Volume) 2025 & 2033
- Figure 19: South America Molluscicides Industry Revenue Share (%), by Import Market Analysis (Value & Volume) 2025 & 2033
- Figure 20: South America Molluscicides Industry Revenue (million), by Export Market Analysis (Value & Volume) 2025 & 2033
- Figure 21: South America Molluscicides Industry Revenue Share (%), by Export Market Analysis (Value & Volume) 2025 & 2033
- Figure 22: South America Molluscicides Industry Revenue (million), by Price Trend Analysis 2025 & 2033
- Figure 23: South America Molluscicides Industry Revenue Share (%), by Price Trend Analysis 2025 & 2033
- Figure 24: South America Molluscicides Industry Revenue (million), by Country 2025 & 2033
- Figure 25: South America Molluscicides Industry Revenue Share (%), by Country 2025 & 2033
- Figure 26: Europe Molluscicides Industry Revenue (million), by Production Analysis 2025 & 2033
- Figure 27: Europe Molluscicides Industry Revenue Share (%), by Production Analysis 2025 & 2033
- Figure 28: Europe Molluscicides Industry Revenue (million), by Consumption Analysis 2025 & 2033
- Figure 29: Europe Molluscicides Industry Revenue Share (%), by Consumption Analysis 2025 & 2033
- Figure 30: Europe Molluscicides Industry Revenue (million), by Import Market Analysis (Value & Volume) 2025 & 2033
- Figure 31: Europe Molluscicides Industry Revenue Share (%), by Import Market Analysis (Value & Volume) 2025 & 2033
- Figure 32: Europe Molluscicides Industry Revenue (million), by Export Market Analysis (Value & Volume) 2025 & 2033
- Figure 33: Europe Molluscicides Industry Revenue Share (%), by Export Market Analysis (Value & Volume) 2025 & 2033
- Figure 34: Europe Molluscicides Industry Revenue (million), by Price Trend Analysis 2025 & 2033
- Figure 35: Europe Molluscicides Industry Revenue Share (%), by Price Trend Analysis 2025 & 2033
- Figure 36: Europe Molluscicides Industry Revenue (million), by Country 2025 & 2033
- Figure 37: Europe Molluscicides Industry Revenue Share (%), by Country 2025 & 2033
- Figure 38: Middle East & Africa Molluscicides Industry Revenue (million), by Production Analysis 2025 & 2033
- Figure 39: Middle East & Africa Molluscicides Industry Revenue Share (%), by Production Analysis 2025 & 2033
- Figure 40: Middle East & Africa Molluscicides Industry Revenue (million), by Consumption Analysis 2025 & 2033
- Figure 41: Middle East & Africa Molluscicides Industry Revenue Share (%), by Consumption Analysis 2025 & 2033
- Figure 42: Middle East & Africa Molluscicides Industry Revenue (million), by Import Market Analysis (Value & Volume) 2025 & 2033
- Figure 43: Middle East & Africa Molluscicides Industry Revenue Share (%), by Import Market Analysis (Value & Volume) 2025 & 2033
- Figure 44: Middle East & Africa Molluscicides Industry Revenue (million), by Export Market Analysis (Value & Volume) 2025 & 2033
- Figure 45: Middle East & Africa Molluscicides Industry Revenue Share (%), by Export Market Analysis (Value & Volume) 2025 & 2033
- Figure 46: Middle East & Africa Molluscicides Industry Revenue (million), by Price Trend Analysis 2025 & 2033
- Figure 47: Middle East & Africa Molluscicides Industry Revenue Share (%), by Price Trend Analysis 2025 & 2033
- Figure 48: Middle East & Africa Molluscicides Industry Revenue (million), by Country 2025 & 2033
- Figure 49: Middle East & Africa Molluscicides Industry Revenue Share (%), by Country 2025 & 2033
- Figure 50: Asia Pacific Molluscicides Industry Revenue (million), by Production Analysis 2025 & 2033
- Figure 51: Asia Pacific Molluscicides Industry Revenue Share (%), by Production Analysis 2025 & 2033
- Figure 52: Asia Pacific Molluscicides Industry Revenue (million), by Consumption Analysis 2025 & 2033
- Figure 53: Asia Pacific Molluscicides Industry Revenue Share (%), by Consumption Analysis 2025 & 2033
- Figure 54: Asia Pacific Molluscicides Industry Revenue (million), by Import Market Analysis (Value & Volume) 2025 & 2033
- Figure 55: Asia Pacific Molluscicides Industry Revenue Share (%), by Import Market Analysis (Value & Volume) 2025 & 2033
- Figure 56: Asia Pacific Molluscicides Industry Revenue (million), by Export Market Analysis (Value & Volume) 2025 & 2033
- Figure 57: Asia Pacific Molluscicides Industry Revenue Share (%), by Export Market Analysis (Value & Volume) 2025 & 2033
- Figure 58: Asia Pacific Molluscicides Industry Revenue (million), by Price Trend Analysis 2025 & 2033
- Figure 59: Asia Pacific Molluscicides Industry Revenue Share (%), by Price Trend Analysis 2025 & 2033
- Figure 60: Asia Pacific Molluscicides Industry Revenue (million), by Country 2025 & 2033
- Figure 61: Asia Pacific Molluscicides Industry Revenue Share (%), by Country 2025 & 2033
List of Tables
- Table 1: Global Molluscicides Industry Revenue million Forecast, by Production Analysis 2020 & 2033
- Table 2: Global Molluscicides Industry Revenue million Forecast, by Consumption Analysis 2020 & 2033
- Table 3: Global Molluscicides Industry Revenue million Forecast, by Import Market Analysis (Value & Volume) 2020 & 2033
- Table 4: Global Molluscicides Industry Revenue million Forecast, by Export Market Analysis (Value & Volume) 2020 & 2033
- Table 5: Global Molluscicides Industry Revenue million Forecast, by Price Trend Analysis 2020 & 2033
- Table 6: Global Molluscicides Industry Revenue million Forecast, by Region 2020 & 2033
- Table 7: Global Molluscicides Industry Revenue million Forecast, by Production Analysis 2020 & 2033
- Table 8: Global Molluscicides Industry Revenue million Forecast, by Consumption Analysis 2020 & 2033
- Table 9: Global Molluscicides Industry Revenue million Forecast, by Import Market Analysis (Value & Volume) 2020 & 2033
- Table 10: Global Molluscicides Industry Revenue million Forecast, by Export Market Analysis (Value & Volume) 2020 & 2033
- Table 11: Global Molluscicides Industry Revenue million Forecast, by Price Trend Analysis 2020 & 2033
- Table 12: Global Molluscicides Industry Revenue million Forecast, by Country 2020 & 2033
- Table 13: United States Molluscicides Industry Revenue (million) Forecast, by Application 2020 & 2033
- Table 14: Canada Molluscicides Industry Revenue (million) Forecast, by Application 2020 & 2033
- Table 15: Mexico Molluscicides Industry Revenue (million) Forecast, by Application 2020 & 2033
- Table 16: Global Molluscicides Industry Revenue million Forecast, by Production Analysis 2020 & 2033
- Table 17: Global Molluscicides Industry Revenue million Forecast, by Consumption Analysis 2020 & 2033
- Table 18: Global Molluscicides Industry Revenue million Forecast, by Import Market Analysis (Value & Volume) 2020 & 2033
- Table 19: Global Molluscicides Industry Revenue million Forecast, by Export Market Analysis (Value & Volume) 2020 & 2033
- Table 20: Global Molluscicides Industry Revenue million Forecast, by Price Trend Analysis 2020 & 2033
- Table 21: Global Molluscicides Industry Revenue million Forecast, by Country 2020 & 2033
- Table 22: Brazil Molluscicides Industry Revenue (million) Forecast, by Application 2020 & 2033
- Table 23: Argentina Molluscicides Industry Revenue (million) Forecast, by Application 2020 & 2033
- Table 24: Rest of South America Molluscicides Industry Revenue (million) Forecast, by Application 2020 & 2033
- Table 25: Global Molluscicides Industry Revenue million Forecast, by Production Analysis 2020 & 2033
- Table 26: Global Molluscicides Industry Revenue million Forecast, by Consumption Analysis 2020 & 2033
- Table 27: Global Molluscicides Industry Revenue million Forecast, by Import Market Analysis (Value & Volume) 2020 & 2033
- Table 28: Global Molluscicides Industry Revenue million Forecast, by Export Market Analysis (Value & Volume) 2020 & 2033
- Table 29: Global Molluscicides Industry Revenue million Forecast, by Price Trend Analysis 2020 & 2033
- Table 30: Global Molluscicides Industry Revenue million Forecast, by Country 2020 & 2033
- Table 31: United Kingdom Molluscicides Industry Revenue (million) Forecast, by Application 2020 & 2033
- Table 32: Germany Molluscicides Industry Revenue (million) Forecast, by Application 2020 & 2033
- Table 33: France Molluscicides Industry Revenue (million) Forecast, by Application 2020 & 2033
- Table 34: Italy Molluscicides Industry Revenue (million) Forecast, by Application 2020 & 2033
- Table 35: Spain Molluscicides Industry Revenue (million) Forecast, by Application 2020 & 2033
- Table 36: Russia Molluscicides Industry Revenue (million) Forecast, by Application 2020 & 2033
- Table 37: Benelux Molluscicides Industry Revenue (million) Forecast, by Application 2020 & 2033
- Table 38: Nordics Molluscicides Industry Revenue (million) Forecast, by Application 2020 & 2033
- Table 39: Rest of Europe Molluscicides Industry Revenue (million) Forecast, by Application 2020 & 2033
- Table 40: Global Molluscicides Industry Revenue million Forecast, by Production Analysis 2020 & 2033
- Table 41: Global Molluscicides Industry Revenue million Forecast, by Consumption Analysis 2020 & 2033
- Table 42: Global Molluscicides Industry Revenue million Forecast, by Import Market Analysis (Value & Volume) 2020 & 2033
- Table 43: Global Molluscicides Industry Revenue million Forecast, by Export Market Analysis (Value & Volume) 2020 & 2033
- Table 44: Global Molluscicides Industry Revenue million Forecast, by Price Trend Analysis 2020 & 2033
- Table 45: Global Molluscicides Industry Revenue million Forecast, by Country 2020 & 2033
- Table 46: Turkey Molluscicides Industry Revenue (million) Forecast, by Application 2020 & 2033
- Table 47: Israel Molluscicides Industry Revenue (million) Forecast, by Application 2020 & 2033
- Table 48: GCC Molluscicides Industry Revenue (million) Forecast, by Application 2020 & 2033
- Table 49: North Africa Molluscicides Industry Revenue (million) Forecast, by Application 2020 & 2033
- Table 50: South Africa Molluscicides Industry Revenue (million) Forecast, by Application 2020 & 2033
- Table 51: Rest of Middle East & Africa Molluscicides Industry Revenue (million) Forecast, by Application 2020 & 2033
- Table 52: Global Molluscicides Industry Revenue million Forecast, by Production Analysis 2020 & 2033
- Table 53: Global Molluscicides Industry Revenue million Forecast, by Consumption Analysis 2020 & 2033
- Table 54: Global Molluscicides Industry Revenue million Forecast, by Import Market Analysis (Value & Volume) 2020 & 2033
- Table 55: Global Molluscicides Industry Revenue million Forecast, by Export Market Analysis (Value & Volume) 2020 & 2033
- Table 56: Global Molluscicides Industry Revenue million Forecast, by Price Trend Analysis 2020 & 2033
- Table 57: Global Molluscicides Industry Revenue million Forecast, by Country 2020 & 2033
- Table 58: China Molluscicides Industry Revenue (million) Forecast, by Application 2020 & 2033
- Table 59: India Molluscicides Industry Revenue (million) Forecast, by Application 2020 & 2033
- Table 60: Japan Molluscicides Industry Revenue (million) Forecast, by Application 2020 & 2033
- Table 61: South Korea Molluscicides Industry Revenue (million) Forecast, by Application 2020 & 2033
- Table 62: ASEAN Molluscicides Industry Revenue (million) Forecast, by Application 2020 & 2033
- Table 63: Oceania Molluscicides Industry Revenue (million) Forecast, by Application 2020 & 2033
- Table 64: Rest of Asia Pacific Molluscicides Industry Revenue (million) Forecast, by Application 2020 & 2033
Frequently Asked Questions
1. What is the projected Compound Annual Growth Rate (CAGR) of the Molluscicides Industry?
The projected CAGR is approximately 9.67%.
2. Which companies are prominent players in the Molluscicides Industry?
Key companies in the market include American Vanguard Corporation, PI Industries, Arxada, Liphatech Inc, W Neudorff GmbH K, Mitsui & Co Ltd (Certis Belchim), UPL Limited, Nufarm Ltd.
3. What are the main segments of the Molluscicides Industry?
The market segments include Production Analysis, Consumption Analysis, Import Market Analysis (Value & Volume), Export Market Analysis (Value & Volume), Price Trend Analysis.
4. Can you provide details about the market size?
The market size is estimated to be USD 837.82 million as of 2022.
5. What are some drivers contributing to market growth?
Seed Treatment As A Solution To Enhance Yield; Growing Awareness For Seed Treatment Among The Farmers; Rising Trend Of Organic Farming.
6. What are the notable trends driving market growth?
South America dominated the global molluscicide market.
7. Are there any restraints impacting market growth?
Limitations Across Farm-Level Seed Treatment; Rising Environmental Concerns.
8. Can you provide examples of recent developments in the market?
November 2022: Certis Belchim BV acquired the assets of Henry Manufacturing Limited in New Zealand. This includes its portfolio and pipeline of potassium fatty-acid salts, which have various applications in crop protection.March 2022: A new company called Certis Belchim BV was formed by Mitsui & Co. Ltd by merging its recently acquired Belchim Crop Protection and its European subsidiary Certis Europe. This was done in accordance with the terms of a definitive agreement.June 2021: Belchim Crop Protection was fully acquired by Mitsui & Co. Ltd after purchasing the remaining 32% of shares owned by Belchim Management NV/SA. Mitsui now holds a 62% stake in Belchim Crop Protection alongside ISK and Mitsui Chemicals Agro. This acquisition allows Mitsui to focus on establishing a sustainable crop protection company in Europe.
9. What pricing options are available for accessing the report?
Pricing options include single-user, multi-user, and enterprise licenses priced at USD 3800, USD 4500, and USD 5800 respectively.
10. Is the market size provided in terms of value or volume?
The market size is provided in terms of value, measured in million.
11. Are there any specific market keywords associated with the report?
Yes, the market keyword associated with the report is "Molluscicides Industry," which aids in identifying and referencing the specific market segment covered.
12. How do I determine which pricing option suits my needs best?
The pricing options vary based on user requirements and access needs. Individual users may opt for single-user licenses, while businesses requiring broader access may choose multi-user or enterprise licenses for cost-effective access to the report.
13. Are there any additional resources or data provided in the Molluscicides Industry report?
While the report offers comprehensive insights, it's advisable to review the specific contents or supplementary materials provided to ascertain if additional resources or data are available.
14. How can I stay updated on further developments or reports in the Molluscicides Industry?
To stay informed about further developments, trends, and reports in the Molluscicides Industry, consider subscribing to industry newsletters, following relevant companies and organizations, or regularly checking reputable industry news sources and publications.
Methodology
Step 1 - Identification of Relevant Samples Size from Population Database


Step 2 - Approaches for Defining Global Market Size (Value, Volume* & Price*)

Note*: In applicable scenarios
Step 3 - Data Sources
Primary Research
- Web Analytics
- Survey Reports
- Research Institute
- Latest Research Reports
- Opinion Leaders
Secondary Research
- Annual Reports
- White Paper
- Latest Press Release
- Industry Association
- Paid Database
- Investor Presentations

Step 4 - Data Triangulation
Involves using different sources of information in order to increase the validity of a study
These sources are likely to be stakeholders in a program - participants, other researchers, program staff, other community members, and so on.
Then we put all data in single framework & apply various statistical tools to find out the dynamic on the market.
During the analysis stage, feedback from the stakeholder groups would be compared to determine areas of agreement as well as areas of divergence