

Key Insights
The global Miso market is poised for robust growth, projected to reach an estimated $77 billion by 2025, driven by increasing consumer interest in fermented foods, their associated health benefits, and the burgeoning demand from the food industry for versatile ingredients. The market is expected to expand at a Compound Annual Growth Rate (CAGR) of 4.7% from 2025 to 2033, reflecting sustained consumer adoption and innovation in product offerings. Key drivers fueling this expansion include the rising awareness of miso's nutritional profile, its role in gut health, and its culinary adaptability across a wide range of dishes, from traditional Japanese cuisine to modern fusion creations. Furthermore, the growing popularity of plant-based diets and the quest for umami-rich flavor enhancers are significant contributors to market momentum. The market is segmented into distinct applications, including consumer use and the broader food industry, and further categorized by type into Red Miso, White Miso, and Mixed Miso, catering to diverse taste preferences and culinary applications.
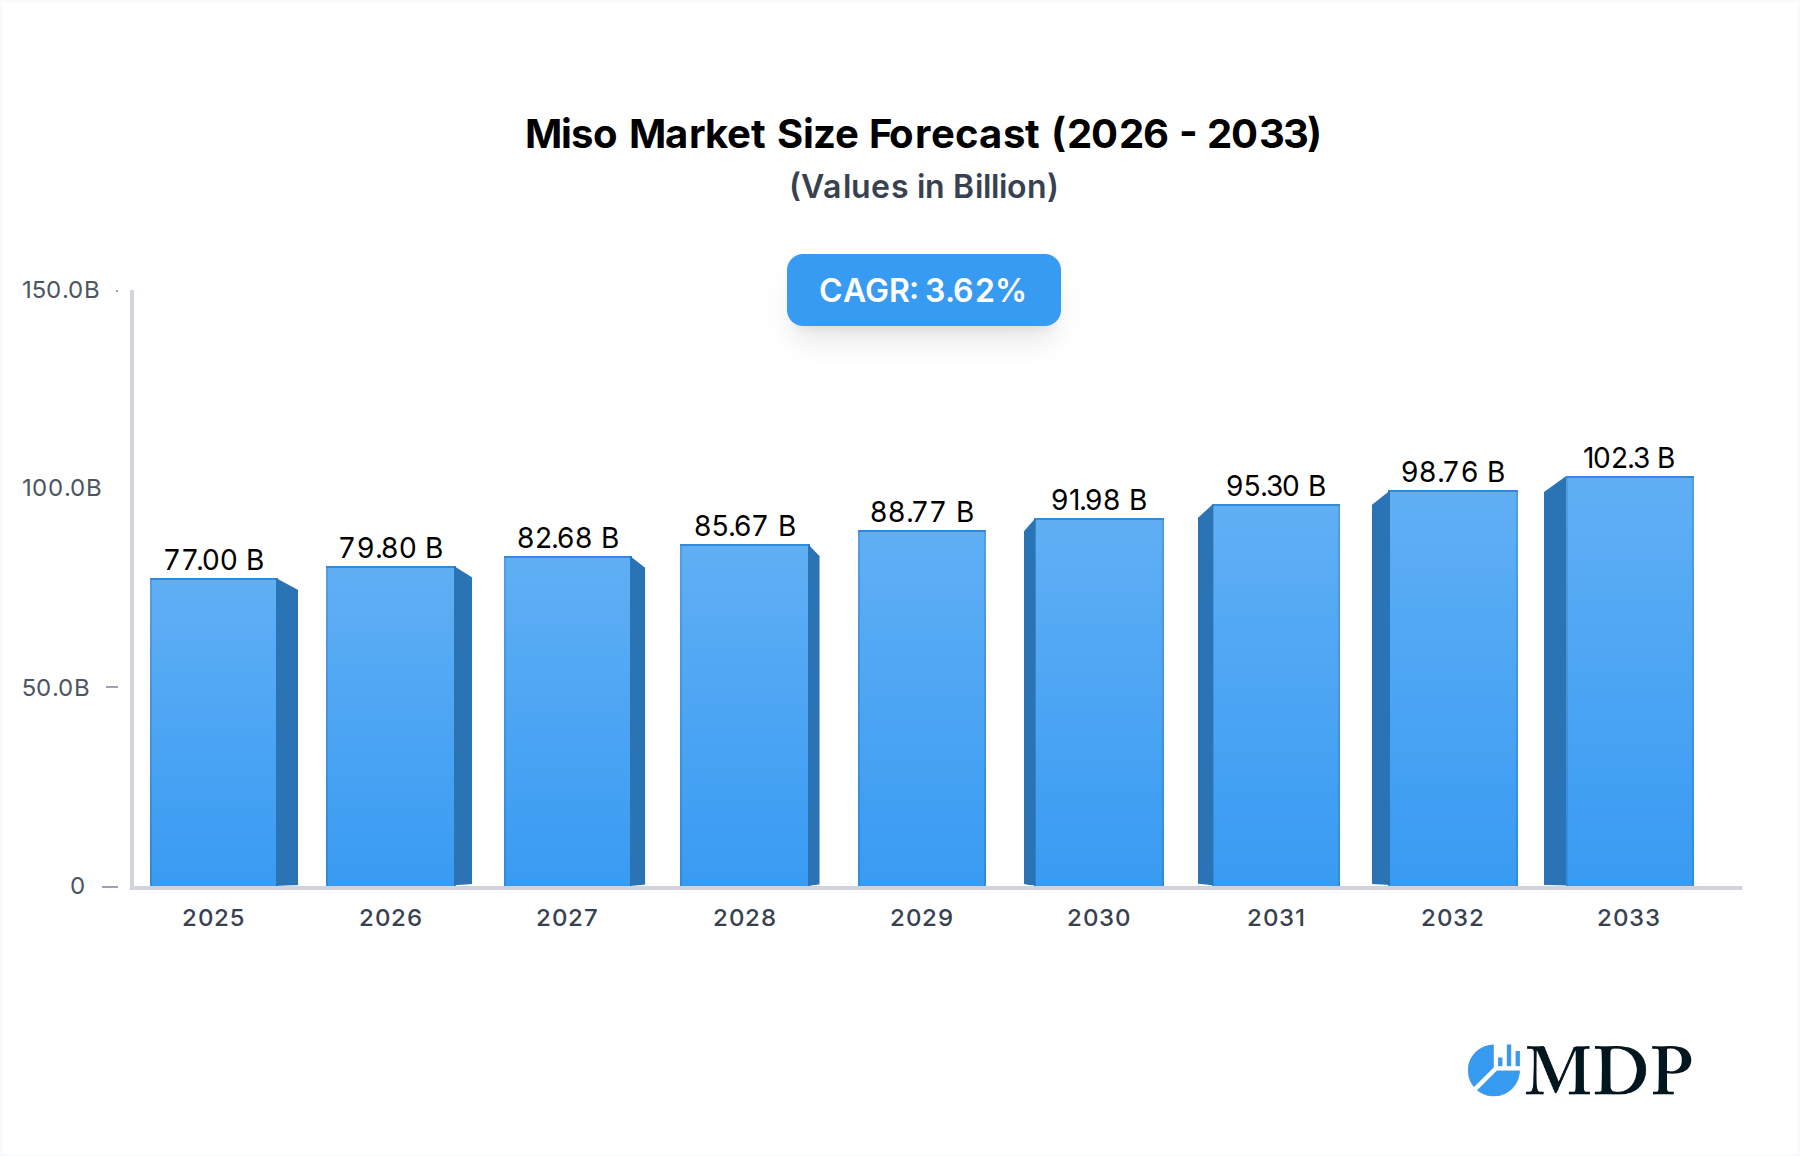
Miso Market Size (In Billion)
The market's trajectory is also influenced by emerging trends such as the development of artisanal and specialty miso varieties, a greater emphasis on sustainable sourcing and production practices, and the increasing availability of miso-based products in ready-to-eat formats and as seasoning blends. While the market exhibits strong growth potential, certain restraints, such as fluctuating raw material prices and the need for consumer education regarding the diverse applications of miso beyond its traditional use, could pose challenges. Leading companies like Miyasaka Jozo, Marukome, and Hikari Miso are actively investing in product development, market penetration, and geographical expansion, particularly in regions with growing food and beverage sectors. The Asia Pacific region is expected to maintain its dominant market share due to the deep-rooted culinary traditions and high consumption of miso, while North America and Europe are anticipated to witness significant growth as consumer preferences diversify.

Miso Company Market Share
This comprehensive report offers an in-depth analysis of the global miso market, a rapidly expanding sector fueled by surging consumer interest in fermented foods and the versatile applications of this Japanese culinary staple. Examine critical market dynamics, emerging trends, and strategic opportunities shaping the miso industry, from red miso and white miso to mixed miso varieties. Our miso market research provides actionable insights for stakeholders across the food industry and consumer segments, leveraging billions in market value projections.
Miso Market Dynamics & Concentration
The global miso market exhibits a moderate level of concentration, with key players like Miyasaka Jozo, Marukome, and Hikari Miso holding significant market share. The market is driven by a growing demand for natural, healthy, and umami-rich ingredients, pushing for innovation in product development and processing. Regulatory frameworks, particularly concerning food safety and labeling standards, play a crucial role in shaping market entry and product formulations. Substitutes, such as soy sauce and other fermented pastes, present a competitive challenge, but miso's unique flavor profile and health benefits are increasingly differentiating it. End-user trends are leaning towards convenience and health-conscious options, with a rise in ready-to-use miso products and those fortified with probiotics. Merger and acquisition (M&A) activities, while not yet at a billion-dollar scale, are anticipated to increase as larger food corporations seek to capitalize on the burgeoning fermented foods market. The estimated market share of the top five players is around 65%, with an average of 5 M&A deals per year in the last five years.
Miso Industry Trends & Analysis
The miso industry is poised for significant growth, projected to achieve a Compound Annual Growth Rate (CAGR) of approximately 7.2% during the forecast period of 2025–2033. This expansion is primarily driven by escalating consumer awareness regarding the health benefits associated with fermented foods, including improved gut health and nutrient absorption. Technological disruptions in fermentation processes and packaging are enabling the development of novel miso products with enhanced shelf-life and diverse flavor profiles, catering to a wider demographic. The rising popularity of global cuisines, particularly Asian culinary traditions, is a major catalyst for increased market penetration in both developed and developing economies. Consumer preferences are shifting towards artisanal, organic, and sustainably produced miso, creating a premium segment within the market. Competitive dynamics are intensifying, with both established manufacturers and emerging startups vying for market share through product differentiation and strategic marketing initiatives. The market penetration of miso in North America and Europe is expected to rise from 15% to 35% by 2033, while the overall global market value is projected to reach over 3 billion by 2033.
Leading Markets & Segments in Miso
The Food Industry segment currently dominates the global miso market, accounting for an estimated 70% of the total market value. Within this segment, the use of miso as a base for soups, marinades, dressings, and savory dishes is widespread, driving demand for bulk quantities. The Consumer application segment is rapidly growing, fueled by an increasing interest in home cooking and the incorporation of healthy fermented ingredients into daily diets. Red Miso represents a significant portion of the market due to its robust flavor, making it a preferred choice for traditional Japanese cuisine and a growing number of international applications. White Miso, with its milder and sweeter profile, is gaining traction in Western markets as a versatile ingredient for sauces and glazes. Mixed Miso offers a balanced flavor, appealing to a broad consumer base seeking complexity. Economically, the rising disposable incomes in emerging economies are a key driver for increased consumption. Infrastructure development in distribution networks facilitates wider availability of miso products. Government initiatives promoting healthy eating and the adoption of traditional food practices also contribute to market expansion. The dominant region for miso consumption remains Asia-Pacific, with Japan leading, but North America and Europe are showing strong growth trajectories, with market penetration expected to increase by 20% in the forecast period.
Miso Product Developments
Product innovation in the miso market is characterized by a focus on convenience, health, and diverse flavor profiles. Manufacturers are introducing ready-to-use miso pastes, miso soup kits, and even miso-infused snacks. There's a growing emphasis on organic and non-GMO certifications, appealing to health-conscious consumers. Technological advancements in fermentation are leading to the development of specialized miso varieties, such as low-sodium options and those enriched with probiotics. Competitive advantages are being carved out through unique ingredient sourcing, traditional fermentation techniques, and creative flavor fusions that blend miso with international culinary influences.
Key Drivers of Miso Growth
The growth of the miso market is propelled by several key drivers. The increasing global demand for fermented foods, recognized for their health benefits, is a primary economic driver. Technological advancements in fermentation and packaging are enabling wider product availability and variety. Favorable regulatory frameworks in many regions supporting food innovation and natural ingredients contribute to market expansion. Furthermore, the growing popularity of Asian cuisine worldwide significantly boosts the demand for traditional ingredients like miso.
Challenges in the Miso Market
Despite its growth, the miso market faces certain challenges. Strict regulatory hurdles in some countries concerning the import and labeling of fermented products can impede market entry. Supply chain disruptions, particularly for key ingredients like soybeans and koji, can impact production and pricing. Intense competition from established brands and the availability of substitute products require continuous innovation and effective marketing strategies to maintain market share. The perception of miso as an "acquired taste" in some Western markets also presents a branding challenge.
Emerging Opportunities in Miso
Catalysts driving long-term growth in the miso market include technological breakthroughs in precision fermentation, which could lead to novel miso strains with unique flavor profiles and enhanced nutritional properties. Strategic partnerships between miso producers and global food manufacturers can unlock new distribution channels and product applications. Market expansion into untapped geographical regions, particularly those with a growing interest in global culinary trends, presents significant opportunities. The development of functional miso products, such as those offering specific health benefits beyond general nutrition, is also a promising avenue.
Leading Players in the Miso Sector
- Miyasaka Jozo
- Marukome
- Source Foods
- Hikari Miso
- Yamato Soysauce & Miso
- Saikyo-Miso
- The American Miso Company
- Miyako Oriental Foods
Key Milestones in Miso Industry
- 2019: Increased global research into the gut microbiome benefits of fermented foods, boosting interest in miso.
- 2020: Expansion of online retail channels for specialty food products, including miso, driven by the pandemic.
- 2021: Introduction of innovative miso-based vegan meat alternatives by several companies.
- 2022: Growing consumer demand for organic and sustainably sourced food products influences miso production.
- 2023: Major food expos highlight the versatility of miso in global cuisine, increasing its visibility.
- 2024: Emerging markets in Southeast Asia show significant uptake in miso consumption.
Strategic Outlook for Miso Market
The strategic outlook for the miso market is overwhelmingly positive, driven by sustained consumer interest in health and wellness, coupled with the increasing global adoption of diverse culinary traditions. Growth accelerators include continued product innovation in convenient and functional miso varieties, alongside strategic market penetration into regions with rising disposable incomes. Leveraging digital marketing and e-commerce platforms will be crucial for reaching a wider consumer base. Furthermore, focusing on sustainable production practices and transparent ingredient sourcing will enhance brand loyalty and capture the attention of ethically conscious consumers, solidifying miso's position as a key ingredient in the global food landscape.
Miso Segmentation
-
1. Application
- 1.1. Consumer
- 1.2. Food Industry
-
2. Type
- 2.1. Red Miso
- 2.2. White Miso
- 2.3. Mixed Miso
Miso Segmentation By Geography
-
1. North America
- 1.1. United States
- 1.2. Canada
- 1.3. Mexico
-
2. South America
- 2.1. Brazil
- 2.2. Argentina
- 2.3. Rest of South America
-
3. Europe
- 3.1. United Kingdom
- 3.2. Germany
- 3.3. France
- 3.4. Italy
- 3.5. Spain
- 3.6. Russia
- 3.7. Benelux
- 3.8. Nordics
- 3.9. Rest of Europe
-
4. Middle East & Africa
- 4.1. Turkey
- 4.2. Israel
- 4.3. GCC
- 4.4. North Africa
- 4.5. South Africa
- 4.6. Rest of Middle East & Africa
-
5. Asia Pacific
- 5.1. China
- 5.2. India
- 5.3. Japan
- 5.4. South Korea
- 5.5. ASEAN
- 5.6. Oceania
- 5.7. Rest of Asia Pacific
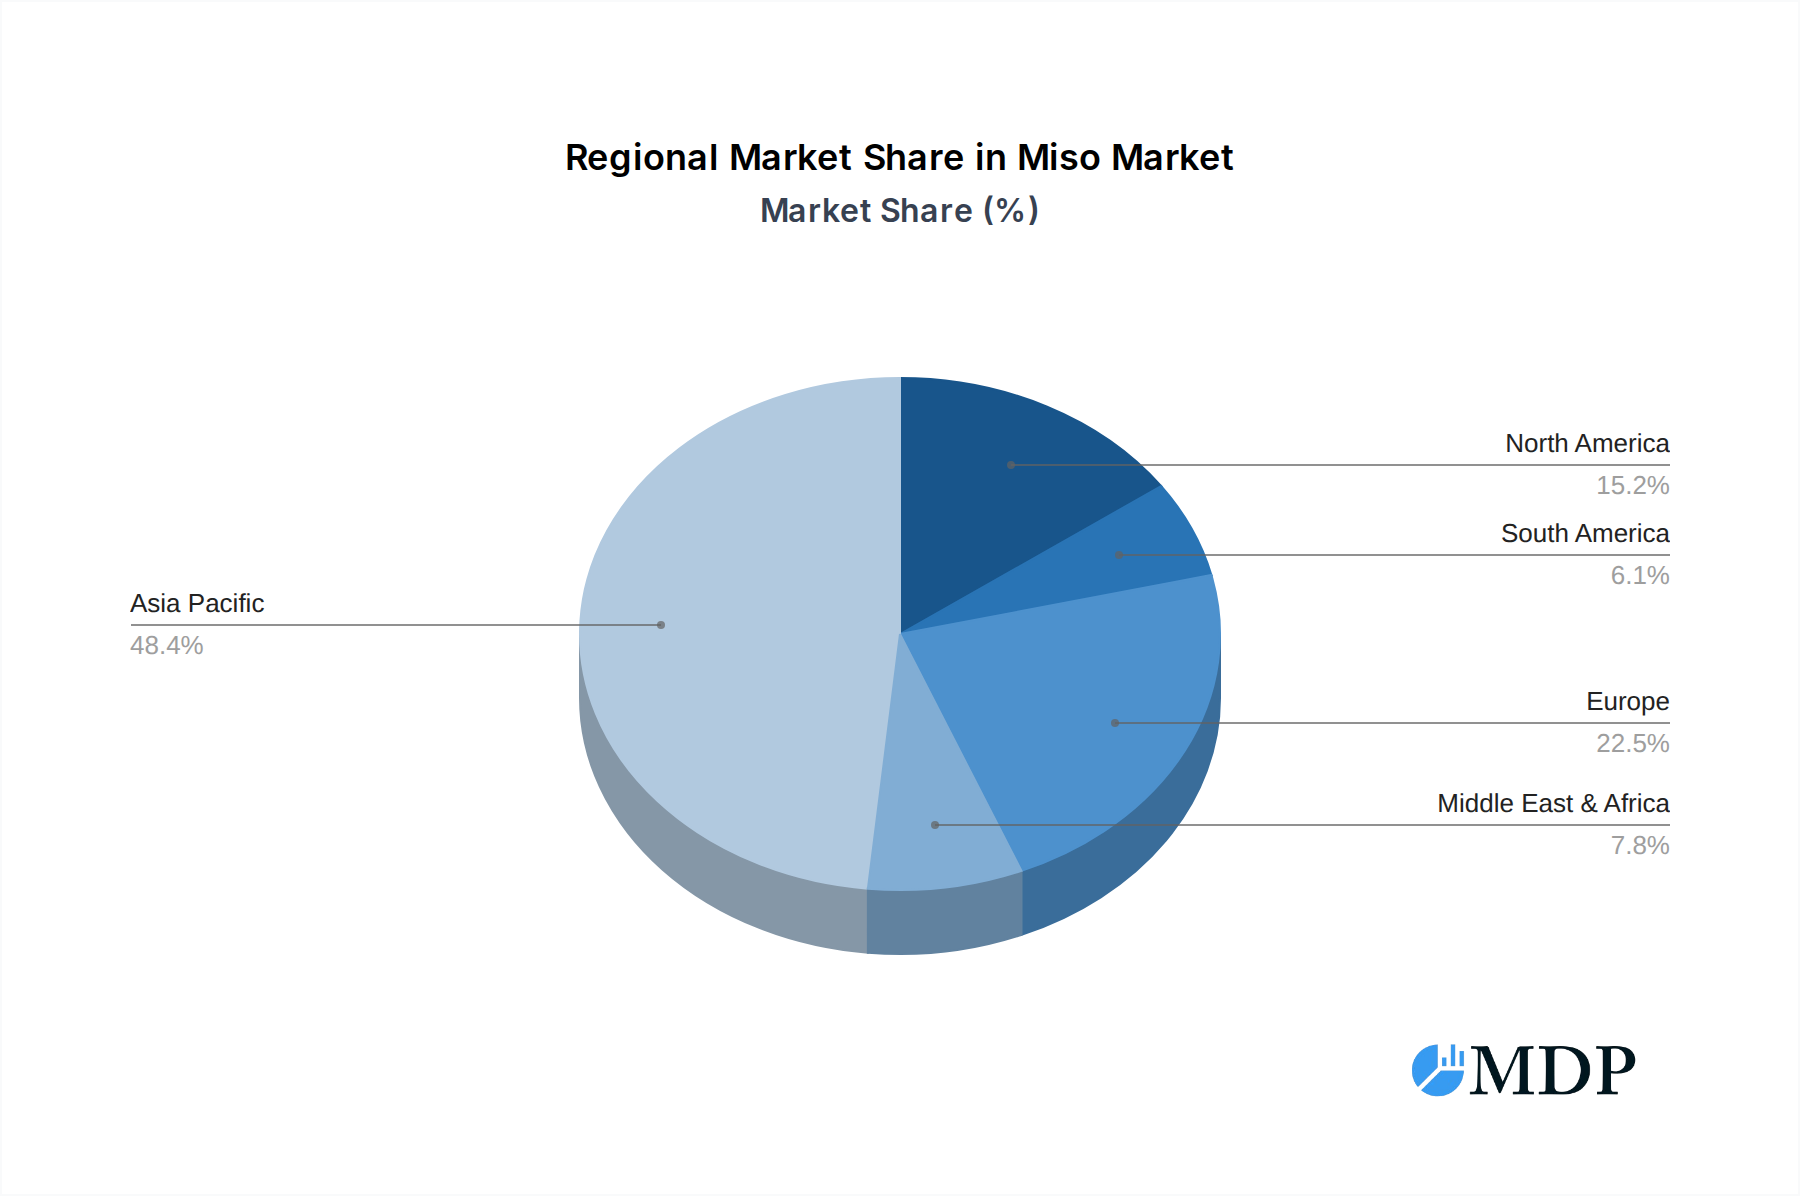
Miso Regional Market Share
Geographic Coverage of Miso
Miso REPORT HIGHLIGHTS
| Aspects | Details |
|---|---|
| Study Period | 2020-2034 |
| Base Year | 2025 |
| Estimated Year | 2026 |
| Forecast Period | 2026-2034 |
| Historical Period | 2020-2025 |
| Growth Rate | CAGR of 4.7% from 2020-2034 |
| Segmentation |
|
Table of Contents
- 1. Introduction
- 1.1. Research Scope
- 1.2. Market Segmentation
- 1.3. Research Methodology
- 1.4. Definitions and Assumptions
- 2. Executive Summary
- 2.1. Introduction
- 3. Market Dynamics
- 3.1. Introduction
- 3.2. Market Drivers
- 3.3. Market Restrains
- 3.4. Market Trends
- 4. Market Factor Analysis
- 4.1. Porters Five Forces
- 4.2. Supply/Value Chain
- 4.3. PESTEL analysis
- 4.4. Market Entropy
- 4.5. Patent/Trademark Analysis
- 5. Global Miso Analysis, Insights and Forecast, 2020-2032
- 5.1. Market Analysis, Insights and Forecast - by Application
- 5.1.1. Consumer
- 5.1.2. Food Industry
- 5.2. Market Analysis, Insights and Forecast - by Type
- 5.2.1. Red Miso
- 5.2.2. White Miso
- 5.2.3. Mixed Miso
- 5.3. Market Analysis, Insights and Forecast - by Region
- 5.3.1. North America
- 5.3.2. South America
- 5.3.3. Europe
- 5.3.4. Middle East & Africa
- 5.3.5. Asia Pacific
- 5.1. Market Analysis, Insights and Forecast - by Application
- 6. North America Miso Analysis, Insights and Forecast, 2020-2032
- 6.1. Market Analysis, Insights and Forecast - by Application
- 6.1.1. Consumer
- 6.1.2. Food Industry
- 6.2. Market Analysis, Insights and Forecast - by Type
- 6.2.1. Red Miso
- 6.2.2. White Miso
- 6.2.3. Mixed Miso
- 6.1. Market Analysis, Insights and Forecast - by Application
- 7. South America Miso Analysis, Insights and Forecast, 2020-2032
- 7.1. Market Analysis, Insights and Forecast - by Application
- 7.1.1. Consumer
- 7.1.2. Food Industry
- 7.2. Market Analysis, Insights and Forecast - by Type
- 7.2.1. Red Miso
- 7.2.2. White Miso
- 7.2.3. Mixed Miso
- 7.1. Market Analysis, Insights and Forecast - by Application
- 8. Europe Miso Analysis, Insights and Forecast, 2020-2032
- 8.1. Market Analysis, Insights and Forecast - by Application
- 8.1.1. Consumer
- 8.1.2. Food Industry
- 8.2. Market Analysis, Insights and Forecast - by Type
- 8.2.1. Red Miso
- 8.2.2. White Miso
- 8.2.3. Mixed Miso
- 8.1. Market Analysis, Insights and Forecast - by Application
- 9. Middle East & Africa Miso Analysis, Insights and Forecast, 2020-2032
- 9.1. Market Analysis, Insights and Forecast - by Application
- 9.1.1. Consumer
- 9.1.2. Food Industry
- 9.2. Market Analysis, Insights and Forecast - by Type
- 9.2.1. Red Miso
- 9.2.2. White Miso
- 9.2.3. Mixed Miso
- 9.1. Market Analysis, Insights and Forecast - by Application
- 10. Asia Pacific Miso Analysis, Insights and Forecast, 2020-2032
- 10.1. Market Analysis, Insights and Forecast - by Application
- 10.1.1. Consumer
- 10.1.2. Food Industry
- 10.2. Market Analysis, Insights and Forecast - by Type
- 10.2.1. Red Miso
- 10.2.2. White Miso
- 10.2.3. Mixed Miso
- 10.1. Market Analysis, Insights and Forecast - by Application
- 11. Competitive Analysis
- 11.1. Global Market Share Analysis 2025
- 11.2. Company Profiles
- 11.2.1 Miyasaka Jozo
- 11.2.1.1. Overview
- 11.2.1.2. Products
- 11.2.1.3. SWOT Analysis
- 11.2.1.4. Recent Developments
- 11.2.1.5. Financials (Based on Availability)
- 11.2.2 Marukome
- 11.2.2.1. Overview
- 11.2.2.2. Products
- 11.2.2.3. SWOT Analysis
- 11.2.2.4. Recent Developments
- 11.2.2.5. Financials (Based on Availability)
- 11.2.3 Source Foods
- 11.2.3.1. Overview
- 11.2.3.2. Products
- 11.2.3.3. SWOT Analysis
- 11.2.3.4. Recent Developments
- 11.2.3.5. Financials (Based on Availability)
- 11.2.4 Hikari Miso
- 11.2.4.1. Overview
- 11.2.4.2. Products
- 11.2.4.3. SWOT Analysis
- 11.2.4.4. Recent Developments
- 11.2.4.5. Financials (Based on Availability)
- 11.2.5 Yamato Soysauce & Miso
- 11.2.5.1. Overview
- 11.2.5.2. Products
- 11.2.5.3. SWOT Analysis
- 11.2.5.4. Recent Developments
- 11.2.5.5. Financials (Based on Availability)
- 11.2.6 Saikyo-Miso
- 11.2.6.1. Overview
- 11.2.6.2. Products
- 11.2.6.3. SWOT Analysis
- 11.2.6.4. Recent Developments
- 11.2.6.5. Financials (Based on Availability)
- 11.2.7 The American Miso Company
- 11.2.7.1. Overview
- 11.2.7.2. Products
- 11.2.7.3. SWOT Analysis
- 11.2.7.4. Recent Developments
- 11.2.7.5. Financials (Based on Availability)
- 11.2.8 Miyako Oriental Foods
- 11.2.8.1. Overview
- 11.2.8.2. Products
- 11.2.8.3. SWOT Analysis
- 11.2.8.4. Recent Developments
- 11.2.8.5. Financials (Based on Availability)
- 11.2.1 Miyasaka Jozo
List of Figures
- Figure 1: Global Miso Revenue Breakdown (undefined, %) by Region 2025 & 2033
- Figure 2: Global Miso Volume Breakdown (K, %) by Region 2025 & 2033
- Figure 3: North America Miso Revenue (undefined), by Application 2025 & 2033
- Figure 4: North America Miso Volume (K), by Application 2025 & 2033
- Figure 5: North America Miso Revenue Share (%), by Application 2025 & 2033
- Figure 6: North America Miso Volume Share (%), by Application 2025 & 2033
- Figure 7: North America Miso Revenue (undefined), by Type 2025 & 2033
- Figure 8: North America Miso Volume (K), by Type 2025 & 2033
- Figure 9: North America Miso Revenue Share (%), by Type 2025 & 2033
- Figure 10: North America Miso Volume Share (%), by Type 2025 & 2033
- Figure 11: North America Miso Revenue (undefined), by Country 2025 & 2033
- Figure 12: North America Miso Volume (K), by Country 2025 & 2033
- Figure 13: North America Miso Revenue Share (%), by Country 2025 & 2033
- Figure 14: North America Miso Volume Share (%), by Country 2025 & 2033
- Figure 15: South America Miso Revenue (undefined), by Application 2025 & 2033
- Figure 16: South America Miso Volume (K), by Application 2025 & 2033
- Figure 17: South America Miso Revenue Share (%), by Application 2025 & 2033
- Figure 18: South America Miso Volume Share (%), by Application 2025 & 2033
- Figure 19: South America Miso Revenue (undefined), by Type 2025 & 2033
- Figure 20: South America Miso Volume (K), by Type 2025 & 2033
- Figure 21: South America Miso Revenue Share (%), by Type 2025 & 2033
- Figure 22: South America Miso Volume Share (%), by Type 2025 & 2033
- Figure 23: South America Miso Revenue (undefined), by Country 2025 & 2033
- Figure 24: South America Miso Volume (K), by Country 2025 & 2033
- Figure 25: South America Miso Revenue Share (%), by Country 2025 & 2033
- Figure 26: South America Miso Volume Share (%), by Country 2025 & 2033
- Figure 27: Europe Miso Revenue (undefined), by Application 2025 & 2033
- Figure 28: Europe Miso Volume (K), by Application 2025 & 2033
- Figure 29: Europe Miso Revenue Share (%), by Application 2025 & 2033
- Figure 30: Europe Miso Volume Share (%), by Application 2025 & 2033
- Figure 31: Europe Miso Revenue (undefined), by Type 2025 & 2033
- Figure 32: Europe Miso Volume (K), by Type 2025 & 2033
- Figure 33: Europe Miso Revenue Share (%), by Type 2025 & 2033
- Figure 34: Europe Miso Volume Share (%), by Type 2025 & 2033
- Figure 35: Europe Miso Revenue (undefined), by Country 2025 & 2033
- Figure 36: Europe Miso Volume (K), by Country 2025 & 2033
- Figure 37: Europe Miso Revenue Share (%), by Country 2025 & 2033
- Figure 38: Europe Miso Volume Share (%), by Country 2025 & 2033
- Figure 39: Middle East & Africa Miso Revenue (undefined), by Application 2025 & 2033
- Figure 40: Middle East & Africa Miso Volume (K), by Application 2025 & 2033
- Figure 41: Middle East & Africa Miso Revenue Share (%), by Application 2025 & 2033
- Figure 42: Middle East & Africa Miso Volume Share (%), by Application 2025 & 2033
- Figure 43: Middle East & Africa Miso Revenue (undefined), by Type 2025 & 2033
- Figure 44: Middle East & Africa Miso Volume (K), by Type 2025 & 2033
- Figure 45: Middle East & Africa Miso Revenue Share (%), by Type 2025 & 2033
- Figure 46: Middle East & Africa Miso Volume Share (%), by Type 2025 & 2033
- Figure 47: Middle East & Africa Miso Revenue (undefined), by Country 2025 & 2033
- Figure 48: Middle East & Africa Miso Volume (K), by Country 2025 & 2033
- Figure 49: Middle East & Africa Miso Revenue Share (%), by Country 2025 & 2033
- Figure 50: Middle East & Africa Miso Volume Share (%), by Country 2025 & 2033
- Figure 51: Asia Pacific Miso Revenue (undefined), by Application 2025 & 2033
- Figure 52: Asia Pacific Miso Volume (K), by Application 2025 & 2033
- Figure 53: Asia Pacific Miso Revenue Share (%), by Application 2025 & 2033
- Figure 54: Asia Pacific Miso Volume Share (%), by Application 2025 & 2033
- Figure 55: Asia Pacific Miso Revenue (undefined), by Type 2025 & 2033
- Figure 56: Asia Pacific Miso Volume (K), by Type 2025 & 2033
- Figure 57: Asia Pacific Miso Revenue Share (%), by Type 2025 & 2033
- Figure 58: Asia Pacific Miso Volume Share (%), by Type 2025 & 2033
- Figure 59: Asia Pacific Miso Revenue (undefined), by Country 2025 & 2033
- Figure 60: Asia Pacific Miso Volume (K), by Country 2025 & 2033
- Figure 61: Asia Pacific Miso Revenue Share (%), by Country 2025 & 2033
- Figure 62: Asia Pacific Miso Volume Share (%), by Country 2025 & 2033
List of Tables
- Table 1: Global Miso Revenue undefined Forecast, by Application 2020 & 2033
- Table 2: Global Miso Volume K Forecast, by Application 2020 & 2033
- Table 3: Global Miso Revenue undefined Forecast, by Type 2020 & 2033
- Table 4: Global Miso Volume K Forecast, by Type 2020 & 2033
- Table 5: Global Miso Revenue undefined Forecast, by Region 2020 & 2033
- Table 6: Global Miso Volume K Forecast, by Region 2020 & 2033
- Table 7: Global Miso Revenue undefined Forecast, by Application 2020 & 2033
- Table 8: Global Miso Volume K Forecast, by Application 2020 & 2033
- Table 9: Global Miso Revenue undefined Forecast, by Type 2020 & 2033
- Table 10: Global Miso Volume K Forecast, by Type 2020 & 2033
- Table 11: Global Miso Revenue undefined Forecast, by Country 2020 & 2033
- Table 12: Global Miso Volume K Forecast, by Country 2020 & 2033
- Table 13: United States Miso Revenue (undefined) Forecast, by Application 2020 & 2033
- Table 14: United States Miso Volume (K) Forecast, by Application 2020 & 2033
- Table 15: Canada Miso Revenue (undefined) Forecast, by Application 2020 & 2033
- Table 16: Canada Miso Volume (K) Forecast, by Application 2020 & 2033
- Table 17: Mexico Miso Revenue (undefined) Forecast, by Application 2020 & 2033
- Table 18: Mexico Miso Volume (K) Forecast, by Application 2020 & 2033
- Table 19: Global Miso Revenue undefined Forecast, by Application 2020 & 2033
- Table 20: Global Miso Volume K Forecast, by Application 2020 & 2033
- Table 21: Global Miso Revenue undefined Forecast, by Type 2020 & 2033
- Table 22: Global Miso Volume K Forecast, by Type 2020 & 2033
- Table 23: Global Miso Revenue undefined Forecast, by Country 2020 & 2033
- Table 24: Global Miso Volume K Forecast, by Country 2020 & 2033
- Table 25: Brazil Miso Revenue (undefined) Forecast, by Application 2020 & 2033
- Table 26: Brazil Miso Volume (K) Forecast, by Application 2020 & 2033
- Table 27: Argentina Miso Revenue (undefined) Forecast, by Application 2020 & 2033
- Table 28: Argentina Miso Volume (K) Forecast, by Application 2020 & 2033
- Table 29: Rest of South America Miso Revenue (undefined) Forecast, by Application 2020 & 2033
- Table 30: Rest of South America Miso Volume (K) Forecast, by Application 2020 & 2033
- Table 31: Global Miso Revenue undefined Forecast, by Application 2020 & 2033
- Table 32: Global Miso Volume K Forecast, by Application 2020 & 2033
- Table 33: Global Miso Revenue undefined Forecast, by Type 2020 & 2033
- Table 34: Global Miso Volume K Forecast, by Type 2020 & 2033
- Table 35: Global Miso Revenue undefined Forecast, by Country 2020 & 2033
- Table 36: Global Miso Volume K Forecast, by Country 2020 & 2033
- Table 37: United Kingdom Miso Revenue (undefined) Forecast, by Application 2020 & 2033
- Table 38: United Kingdom Miso Volume (K) Forecast, by Application 2020 & 2033
- Table 39: Germany Miso Revenue (undefined) Forecast, by Application 2020 & 2033
- Table 40: Germany Miso Volume (K) Forecast, by Application 2020 & 2033
- Table 41: France Miso Revenue (undefined) Forecast, by Application 2020 & 2033
- Table 42: France Miso Volume (K) Forecast, by Application 2020 & 2033
- Table 43: Italy Miso Revenue (undefined) Forecast, by Application 2020 & 2033
- Table 44: Italy Miso Volume (K) Forecast, by Application 2020 & 2033
- Table 45: Spain Miso Revenue (undefined) Forecast, by Application 2020 & 2033
- Table 46: Spain Miso Volume (K) Forecast, by Application 2020 & 2033
- Table 47: Russia Miso Revenue (undefined) Forecast, by Application 2020 & 2033
- Table 48: Russia Miso Volume (K) Forecast, by Application 2020 & 2033
- Table 49: Benelux Miso Revenue (undefined) Forecast, by Application 2020 & 2033
- Table 50: Benelux Miso Volume (K) Forecast, by Application 2020 & 2033
- Table 51: Nordics Miso Revenue (undefined) Forecast, by Application 2020 & 2033
- Table 52: Nordics Miso Volume (K) Forecast, by Application 2020 & 2033
- Table 53: Rest of Europe Miso Revenue (undefined) Forecast, by Application 2020 & 2033
- Table 54: Rest of Europe Miso Volume (K) Forecast, by Application 2020 & 2033
- Table 55: Global Miso Revenue undefined Forecast, by Application 2020 & 2033
- Table 56: Global Miso Volume K Forecast, by Application 2020 & 2033
- Table 57: Global Miso Revenue undefined Forecast, by Type 2020 & 2033
- Table 58: Global Miso Volume K Forecast, by Type 2020 & 2033
- Table 59: Global Miso Revenue undefined Forecast, by Country 2020 & 2033
- Table 60: Global Miso Volume K Forecast, by Country 2020 & 2033
- Table 61: Turkey Miso Revenue (undefined) Forecast, by Application 2020 & 2033
- Table 62: Turkey Miso Volume (K) Forecast, by Application 2020 & 2033
- Table 63: Israel Miso Revenue (undefined) Forecast, by Application 2020 & 2033
- Table 64: Israel Miso Volume (K) Forecast, by Application 2020 & 2033
- Table 65: GCC Miso Revenue (undefined) Forecast, by Application 2020 & 2033
- Table 66: GCC Miso Volume (K) Forecast, by Application 2020 & 2033
- Table 67: North Africa Miso Revenue (undefined) Forecast, by Application 2020 & 2033
- Table 68: North Africa Miso Volume (K) Forecast, by Application 2020 & 2033
- Table 69: South Africa Miso Revenue (undefined) Forecast, by Application 2020 & 2033
- Table 70: South Africa Miso Volume (K) Forecast, by Application 2020 & 2033
- Table 71: Rest of Middle East & Africa Miso Revenue (undefined) Forecast, by Application 2020 & 2033
- Table 72: Rest of Middle East & Africa Miso Volume (K) Forecast, by Application 2020 & 2033
- Table 73: Global Miso Revenue undefined Forecast, by Application 2020 & 2033
- Table 74: Global Miso Volume K Forecast, by Application 2020 & 2033
- Table 75: Global Miso Revenue undefined Forecast, by Type 2020 & 2033
- Table 76: Global Miso Volume K Forecast, by Type 2020 & 2033
- Table 77: Global Miso Revenue undefined Forecast, by Country 2020 & 2033
- Table 78: Global Miso Volume K Forecast, by Country 2020 & 2033
- Table 79: China Miso Revenue (undefined) Forecast, by Application 2020 & 2033
- Table 80: China Miso Volume (K) Forecast, by Application 2020 & 2033
- Table 81: India Miso Revenue (undefined) Forecast, by Application 2020 & 2033
- Table 82: India Miso Volume (K) Forecast, by Application 2020 & 2033
- Table 83: Japan Miso Revenue (undefined) Forecast, by Application 2020 & 2033
- Table 84: Japan Miso Volume (K) Forecast, by Application 2020 & 2033
- Table 85: South Korea Miso Revenue (undefined) Forecast, by Application 2020 & 2033
- Table 86: South Korea Miso Volume (K) Forecast, by Application 2020 & 2033
- Table 87: ASEAN Miso Revenue (undefined) Forecast, by Application 2020 & 2033
- Table 88: ASEAN Miso Volume (K) Forecast, by Application 2020 & 2033
- Table 89: Oceania Miso Revenue (undefined) Forecast, by Application 2020 & 2033
- Table 90: Oceania Miso Volume (K) Forecast, by Application 2020 & 2033
- Table 91: Rest of Asia Pacific Miso Revenue (undefined) Forecast, by Application 2020 & 2033
- Table 92: Rest of Asia Pacific Miso Volume (K) Forecast, by Application 2020 & 2033
Frequently Asked Questions
1. What is the projected Compound Annual Growth Rate (CAGR) of the Miso?
The projected CAGR is approximately 4.7%.
2. Which companies are prominent players in the Miso?
Key companies in the market include Miyasaka Jozo, Marukome, Source Foods, Hikari Miso, Yamato Soysauce & Miso, Saikyo-Miso, The American Miso Company, Miyako Oriental Foods.
3. What are the main segments of the Miso?
The market segments include Application, Type.
4. Can you provide details about the market size?
The market size is estimated to be USD XXX N/A as of 2022.
5. What are some drivers contributing to market growth?
N/A
6. What are the notable trends driving market growth?
N/A
7. Are there any restraints impacting market growth?
N/A
8. Can you provide examples of recent developments in the market?
N/A
9. What pricing options are available for accessing the report?
Pricing options include single-user, multi-user, and enterprise licenses priced at USD 3950.00, USD 5925.00, and USD 7900.00 respectively.
10. Is the market size provided in terms of value or volume?
The market size is provided in terms of value, measured in N/A and volume, measured in K.
11. Are there any specific market keywords associated with the report?
Yes, the market keyword associated with the report is "Miso," which aids in identifying and referencing the specific market segment covered.
12. How do I determine which pricing option suits my needs best?
The pricing options vary based on user requirements and access needs. Individual users may opt for single-user licenses, while businesses requiring broader access may choose multi-user or enterprise licenses for cost-effective access to the report.
13. Are there any additional resources or data provided in the Miso report?
While the report offers comprehensive insights, it's advisable to review the specific contents or supplementary materials provided to ascertain if additional resources or data are available.
14. How can I stay updated on further developments or reports in the Miso?
To stay informed about further developments, trends, and reports in the Miso, consider subscribing to industry newsletters, following relevant companies and organizations, or regularly checking reputable industry news sources and publications.
Methodology
Step 1 - Identification of Relevant Samples Size from Population Database


Step 2 - Approaches for Defining Global Market Size (Value, Volume* & Price*)

Note*: In applicable scenarios
Step 3 - Data Sources
Primary Research
- Web Analytics
- Survey Reports
- Research Institute
- Latest Research Reports
- Opinion Leaders
Secondary Research
- Annual Reports
- White Paper
- Latest Press Release
- Industry Association
- Paid Database
- Investor Presentations

Step 4 - Data Triangulation
Involves using different sources of information in order to increase the validity of a study
These sources are likely to be stakeholders in a program - participants, other researchers, program staff, other community members, and so on.
Then we put all data in single framework & apply various statistical tools to find out the dynamic on the market.
During the analysis stage, feedback from the stakeholder groups would be compared to determine areas of agreement as well as areas of divergence