

Key Insights
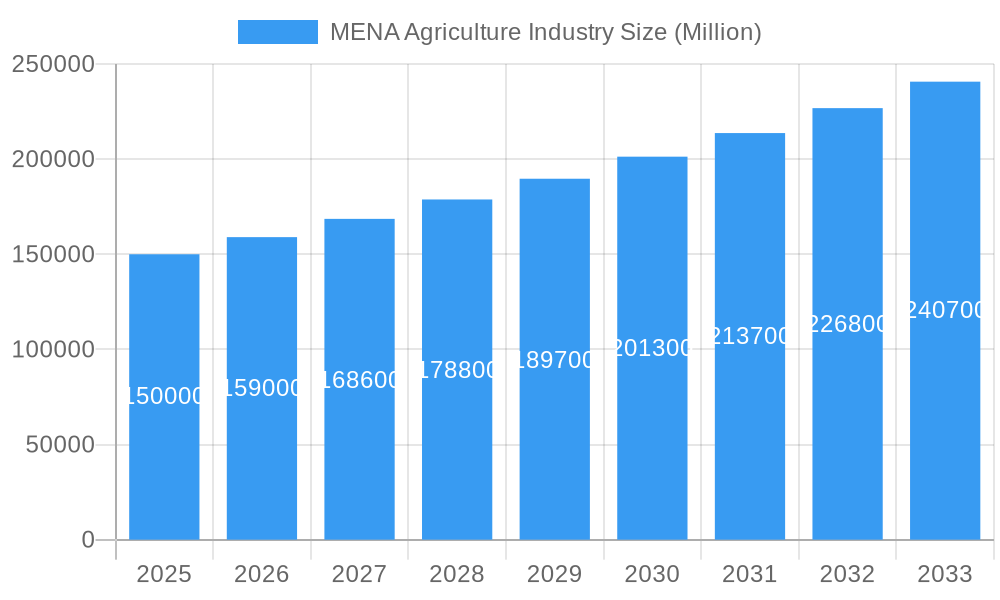
The Middle East and Africa (MEA) agriculture market, valued at approximately $150 billion in 2025, is projected to experience robust growth, exhibiting a compound annual growth rate (CAGR) of 5.7% from 2025 to 2033. This expansion is fueled by several key drivers. Rising populations across the region necessitate increased food production, driving demand for efficient agricultural practices and technologies. Government initiatives promoting food security and agricultural diversification, coupled with increasing investments in irrigation and infrastructure development, are further accelerating market growth. The shift towards healthier diets, with a greater emphasis on fresh produce, is boosting demand for fruits and vegetables. Furthermore, the growing adoption of advanced agricultural techniques, such as precision farming and biotechnology, is enhancing productivity and efficiency within the sector. However, challenges remain, including water scarcity, land degradation, and climate change, which pose significant constraints to sustainable agricultural growth in the region. These factors necessitate the adoption of resilient farming practices and the development of drought-resistant crops.
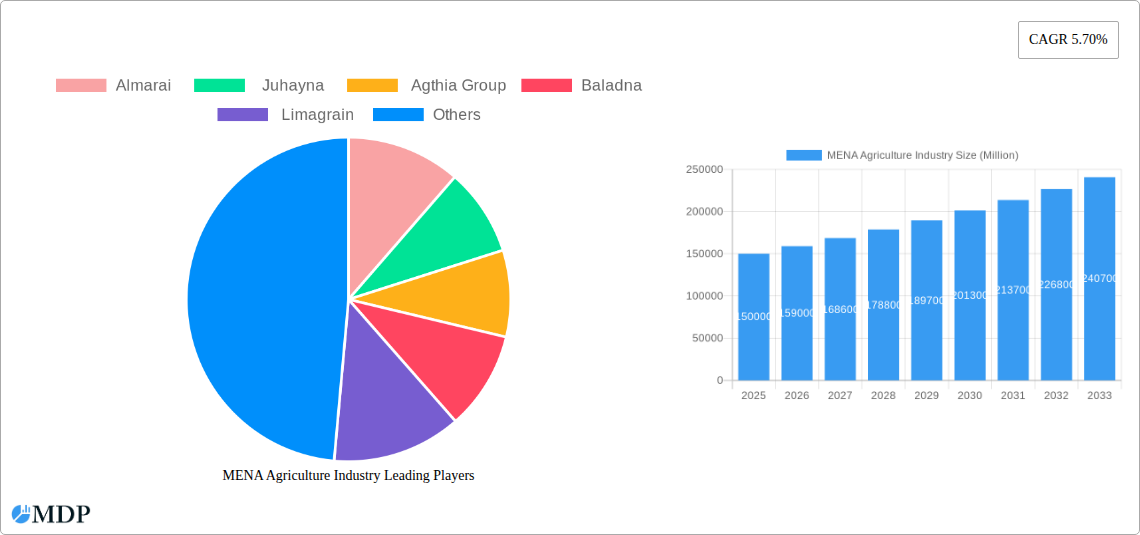
MENA Agriculture Industry Market Size (In Billion)
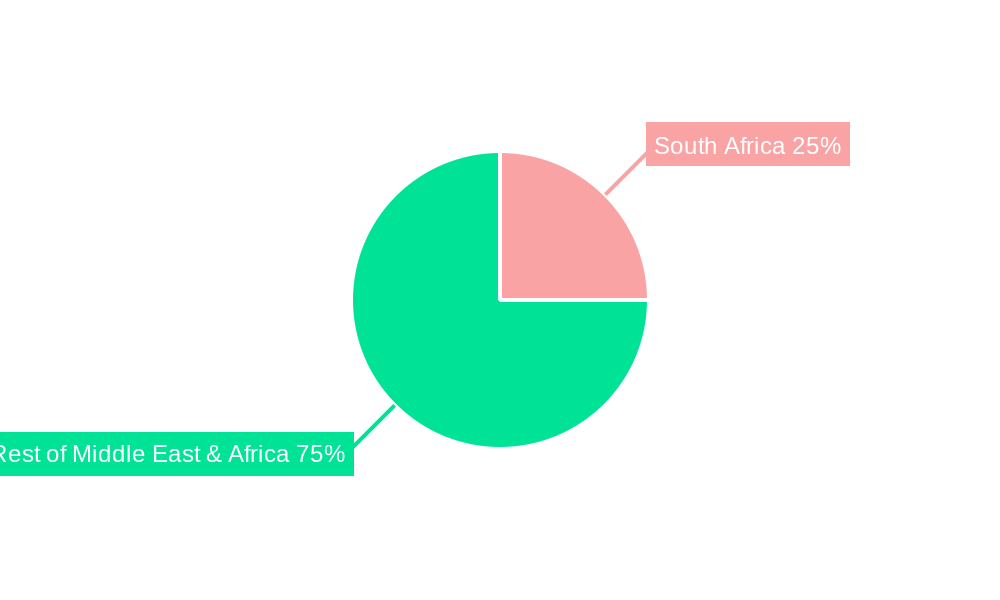
Market segmentation reveals significant opportunities across various agricultural sub-sectors. The food crops segment, dominated by cereals, is expected to retain a considerable market share, reflecting the region's reliance on staple foods. However, the fruits and vegetables segment is poised for substantial growth due to changing consumer preferences and rising disposable incomes. The oilseeds and non-food crops sector presents further opportunities, especially with increasing demand for biofuels and other non-food agricultural products. Key players such as Almarai, Juhayna, Agthia Group, and others are driving innovation and consolidation within the industry, investing in research and development, and expanding their product portfolios to meet evolving consumer needs. South Africa represents a significant market within the MEA region, contributing a substantial portion of the overall market value. The success of these companies and the overall growth of the MEA agricultural market hinges on addressing the challenges of sustainability and ensuring food security for a growing population.
MENA Agriculture Industry Company Market Share
MENA Agriculture Industry: A Comprehensive Market Analysis (2019-2033)
This comprehensive report provides an in-depth analysis of the MENA agriculture industry, offering invaluable insights for investors, industry stakeholders, and strategic decision-makers. Covering the period from 2019 to 2033, with a focus year of 2025, this study meticulously examines market dynamics, key segments, leading players, and emerging opportunities within the region. The report leverages extensive data analysis to forecast market trends and identify key growth drivers and challenges. Expect detailed breakdowns of production, consumption, import/export volumes and values, and price trends across major segments including food crops, fruits, vegetables, and oilseeds.
MENA Agriculture Industry Market Dynamics & Concentration
This section analyzes the competitive landscape of the MENA agriculture industry, exploring market concentration, innovation drivers, regulatory frameworks, product substitutes, end-user trends, and M&A activities. The analysis includes metrics such as market share distribution amongst key players and the number of M&A deals concluded during the study period. The market is characterized by a mix of large multinational corporations and smaller regional players, leading to a moderately concentrated market.
- Market Concentration: The top 5 players control an estimated xx% of the market share in 2025, indicating moderate concentration. This is expected to slightly decrease to xx% by 2033 due to increased competition from smaller, more agile companies.
- Innovation Drivers: Government initiatives promoting sustainable agriculture, increasing consumer demand for high-quality produce, and technological advancements in precision agriculture and vertical farming are key innovation drivers.
- Regulatory Frameworks: Varying regulatory landscapes across MENA countries impact market access and investment decisions. Harmonization of regulations is crucial for fostering regional growth.
- Product Substitutes: Limited availability of affordable substitutes for key agricultural products currently reduces the impact of substitutes on market growth.
- End-User Trends: Growing populations and changing dietary preferences towards healthier foods are driving demand. Sustainability is also increasing in importance amongst consumers.
- M&A Activities: The number of M&A deals in the MENA agriculture sector averaged xx per year during 2019-2024, driven largely by the consolidation of players and the quest for economies of scale. An expected increase in M&A activity in the forecast period is anticipated.
MENA Agriculture Industry Industry Trends & Analysis
This section delves into the key trends shaping the MENA agriculture industry's growth trajectory. It analyzes market growth drivers, technological disruptions, consumer preferences, and competitive dynamics, providing insights into the Compound Annual Growth Rate (CAGR) and market penetration of key segments. The industry is characterized by a strong focus on food security, technological innovation, and sustainable agricultural practices. Key challenges include water scarcity, climate change impacts, and infrastructure limitations. The CAGR for the overall MENA agriculture market is projected at xx% from 2025 to 2033. Market penetration of technology, such as precision farming, is expected to increase from xx% to xx% over the same period.
Leading Markets & Segments in MENA Agriculture Industry
This section identifies the dominant regions, countries, and segments within the MENA agriculture industry. Analysis covers Food Crops/Cereals, Fruits, Vegetables, and Oilseeds/Non-food Crops, encompassing production, consumption, import/export analysis, and price trends. The analysis utilizes both quantitative and qualitative data to identify leading players and emerging opportunities.
Key Drivers: Economic policies promoting agricultural development, investments in irrigation and infrastructure, and government subsidies play a significant role in market dominance. Specific examples are outlined within the analysis of each segment.
Dominance Analysis: The detailed analysis of each segment highlights the leading countries and factors contributing to their prominence. For example, the analysis of food crops may showcase Egypt or Saudi Arabia's leading role due to significant production and consumption. Similarly, other countries will be highlighted for other segments.
Food Crops/Cereals: xx Million tons production in 2025; xx% CAGR (2025-2033).
Fruits: xx Million tons production in 2025; xx% CAGR (2025-2033).
Vegetables: xx Million tons production in 2025; xx% CAGR (2025-2033).
Oilseeds/Non-food Crops: xx Million tons production in 2025; xx% CAGR (2025-2033).
MENA Agriculture Industry Product Developments
This section highlights recent product innovations, applications, and competitive advantages within the MENA agriculture industry. Technological advancements, such as precision agriculture, vertical farming, and improved seed varieties, are enhancing productivity and efficiency. These developments cater to the growing demand for higher-quality produce and sustainable agricultural practices. The focus on water-efficient technologies is particularly relevant given the region's climate.
Key Drivers of MENA Agriculture Industry Growth
Several factors are driving the growth of the MENA agriculture industry. Technological advancements, such as precision farming and vertical farming, are boosting yields and efficiency. Government investments in irrigation and agricultural infrastructure are also improving production capacity. Furthermore, supportive government policies, including subsidies and incentives, are fostering agricultural development. Finally, the growing population and rising demand for food products create a strong market pull for agricultural produce.
Challenges in the MENA Agriculture Industry Market
The MENA agriculture industry faces several challenges. Water scarcity remains a major constraint, impacting crop yields and production capacity. Climate change, with its unpredictable weather patterns, further exacerbates these challenges. Supply chain inefficiencies also hinder efficient distribution of agricultural products across the region. In addition, fluctuating global commodity prices and increased competition from international producers present significant headwinds for regional players.
Emerging Opportunities in MENA Agriculture Industry
Despite the challenges, the MENA agriculture industry presents several promising opportunities. Technological breakthroughs in areas such as precision agriculture and biotechnology offer potential for enhanced productivity and efficiency. Strategic partnerships between regional players and international companies are unlocking access to advanced technologies and expertise. Finally, the exploration of new markets and the diversification of agricultural products are creating new growth avenues for the industry.
Leading Players in the MENA Agriculture Industry Sector
Key Milestones in MENA Agriculture Industry Industry
July 2022: Egypt's Ministry of Planning invests USD 2.73 billion in expanding agricultural production, adopting new technologies (vertical farming), and drafting new policies. This significantly impacts the industry by driving technological adoption and stimulating production growth.
September 2022: A new vertical farming facility opens in Dubai, UAE, a joint venture between Emirates Flight Catering and Crop One, with a USD 40 million investment. This milestone highlights the increasing adoption of innovative technologies to address food security challenges.
Strategic Outlook for MENA Agriculture Industry Market
The MENA agriculture industry exhibits significant long-term growth potential. Technological advancements, coupled with supportive government policies and increasing consumer demand, are expected to propel market expansion. Strategic partnerships and investments in sustainable agricultural practices will play a crucial role in driving future growth. The focus on water-efficient technologies and climate-resilient crops is critical for long-term sustainability and market success.
MENA Agriculture Industry Segmentation
-
1. Food Crops/Cereals
- 1.1. Production Analysis
- 1.2. Consumption Analysis (Value & Volume)
- 1.3. Import Analysis (Value & Volume)
- 1.4. Export Analysis (Value & Volume)
- 1.5. Price Trend Analysis
-
2. Fruits
- 2.1. Production Analysis
- 2.2. Consumption Analysis (Value & Volume)
- 2.3. Import Analysis (Value & Volume)
- 2.4. Export Analysis (Value & Volume)
- 2.5. Price Trend Analysis
-
3. Vegetables
- 3.1. Production Analysis
- 3.2. Consumption Analysis (Value & Volume)
- 3.3. Import Analysis (Value & Volume)
- 3.4. Export Analysis (Value & Volume)
- 3.5. Price Trend Analysis
-
4. Oilseeds/Non-food Crops
- 4.1. Production Analysis
- 4.2. Consumption Analysis (Value & Volume)
- 4.3. Import Analysis (Value & Volume)
- 4.4. Export Analysis (Value & Volume)
- 4.5. Price Trend Analysis
-
5. Food Crops/Cereals
- 5.1. Production Analysis
- 5.2. Consumption Analysis (Value & Volume)
- 5.3. Import Analysis (Value & Volume)
- 5.4. Export Analysis (Value & Volume)
- 5.5. Price Trend Analysis
-
6. Fruits
- 6.1. Production Analysis
- 6.2. Consumption Analysis (Value & Volume)
- 6.3. Import Analysis (Value & Volume)
- 6.4. Export Analysis (Value & Volume)
- 6.5. Price Trend Analysis
-
7. Vegetables
- 7.1. Production Analysis
- 7.2. Consumption Analysis (Value & Volume)
- 7.3. Import Analysis (Value & Volume)
- 7.4. Export Analysis (Value & Volume)
- 7.5. Price Trend Analysis
-
8. Oilseeds/Non-food Crops
- 8.1. Production Analysis
- 8.2. Consumption Analysis (Value & Volume)
- 8.3. Import Analysis (Value & Volume)
- 8.4. Export Analysis (Value & Volume)
- 8.5. Price Trend Analysis
MENA Agriculture Industry Segmentation By Geography
-
1. North America
- 1.1. United States
- 1.2. Canada
- 1.3. Mexico
-
2. South America
- 2.1. Brazil
- 2.2. Argentina
- 2.3. Rest of South America
-
3. Europe
- 3.1. United Kingdom
- 3.2. Germany
- 3.3. France
- 3.4. Italy
- 3.5. Spain
- 3.6. Russia
- 3.7. Benelux
- 3.8. Nordics
- 3.9. Rest of Europe
-
4. Middle East & Africa
- 4.1. Turkey
- 4.2. Israel
- 4.3. GCC
- 4.4. North Africa
- 4.5. South Africa
- 4.6. Rest of Middle East & Africa
-
5. Asia Pacific
- 5.1. China
- 5.2. India
- 5.3. Japan
- 5.4. South Korea
- 5.5. ASEAN
- 5.6. Oceania
- 5.7. Rest of Asia Pacific
MENA Agriculture Industry Regional Market Share
Geographic Coverage of MENA Agriculture Industry
MENA Agriculture Industry REPORT HIGHLIGHTS
| Aspects | Details |
|---|---|
| Study Period | 2020-2034 |
| Base Year | 2025 |
| Estimated Year | 2026 |
| Forecast Period | 2026-2034 |
| Historical Period | 2020-2025 |
| Growth Rate | CAGR of 14.6% from 2020-2034 |
| Segmentation |
|
Table of Contents
- 1. Introduction
- 1.1. Research Scope
- 1.2. Market Segmentation
- 1.3. Research Methodology
- 1.4. Definitions and Assumptions
- 2. Executive Summary
- 2.1. Introduction
- 3. Market Dynamics
- 3.1. Introduction
- 3.2. Market Drivers
- 3.2.1. Increasing Adoption of Technology in Horticulture; Government Initiatives for Self-reliance in Vegetable and Fruit Farming
- 3.3. Market Restrains
- 3.3.1. Limited Resource Availability and Unfavourable Climatic Condition; Increasing Reliance on Imports for Domestic Supply
- 3.4. Market Trends
- 3.4.1. Quest for Food Self-sufficiency is Driving Production
- 4. Market Factor Analysis
- 4.1. Porters Five Forces
- 4.2. Supply/Value Chain
- 4.3. PESTEL analysis
- 4.4. Market Entropy
- 4.5. Patent/Trademark Analysis
- 5. Global MENA Agriculture Industry Analysis, Insights and Forecast, 2020-2032
- 5.1. Market Analysis, Insights and Forecast - by Food Crops/Cereals
- 5.1.1. Production Analysis
- 5.1.2. Consumption Analysis (Value & Volume)
- 5.1.3. Import Analysis (Value & Volume)
- 5.1.4. Export Analysis (Value & Volume)
- 5.1.5. Price Trend Analysis
- 5.2. Market Analysis, Insights and Forecast - by Fruits
- 5.2.1. Production Analysis
- 5.2.2. Consumption Analysis (Value & Volume)
- 5.2.3. Import Analysis (Value & Volume)
- 5.2.4. Export Analysis (Value & Volume)
- 5.2.5. Price Trend Analysis
- 5.3. Market Analysis, Insights and Forecast - by Vegetables
- 5.3.1. Production Analysis
- 5.3.2. Consumption Analysis (Value & Volume)
- 5.3.3. Import Analysis (Value & Volume)
- 5.3.4. Export Analysis (Value & Volume)
- 5.3.5. Price Trend Analysis
- 5.4. Market Analysis, Insights and Forecast - by Oilseeds/Non-food Crops
- 5.4.1. Production Analysis
- 5.4.2. Consumption Analysis (Value & Volume)
- 5.4.3. Import Analysis (Value & Volume)
- 5.4.4. Export Analysis (Value & Volume)
- 5.4.5. Price Trend Analysis
- 5.5. Market Analysis, Insights and Forecast - by Food Crops/Cereals
- 5.5.1. Production Analysis
- 5.5.2. Consumption Analysis (Value & Volume)
- 5.5.3. Import Analysis (Value & Volume)
- 5.5.4. Export Analysis (Value & Volume)
- 5.5.5. Price Trend Analysis
- 5.6. Market Analysis, Insights and Forecast - by Fruits
- 5.6.1. Production Analysis
- 5.6.2. Consumption Analysis (Value & Volume)
- 5.6.3. Import Analysis (Value & Volume)
- 5.6.4. Export Analysis (Value & Volume)
- 5.6.5. Price Trend Analysis
- 5.7. Market Analysis, Insights and Forecast - by Vegetables
- 5.7.1. Production Analysis
- 5.7.2. Consumption Analysis (Value & Volume)
- 5.7.3. Import Analysis (Value & Volume)
- 5.7.4. Export Analysis (Value & Volume)
- 5.7.5. Price Trend Analysis
- 5.8. Market Analysis, Insights and Forecast - by Oilseeds/Non-food Crops
- 5.8.1. Production Analysis
- 5.8.2. Consumption Analysis (Value & Volume)
- 5.8.3. Import Analysis (Value & Volume)
- 5.8.4. Export Analysis (Value & Volume)
- 5.8.5. Price Trend Analysis
- 5.9. Market Analysis, Insights and Forecast - by Region
- 5.9.1. North America
- 5.9.2. South America
- 5.9.3. Europe
- 5.9.4. Middle East & Africa
- 5.9.5. Asia Pacific
- 5.1. Market Analysis, Insights and Forecast - by Food Crops/Cereals
- 6. North America MENA Agriculture Industry Analysis, Insights and Forecast, 2020-2032
- 6.1. Market Analysis, Insights and Forecast - by Food Crops/Cereals
- 6.1.1. Production Analysis
- 6.1.2. Consumption Analysis (Value & Volume)
- 6.1.3. Import Analysis (Value & Volume)
- 6.1.4. Export Analysis (Value & Volume)
- 6.1.5. Price Trend Analysis
- 6.2. Market Analysis, Insights and Forecast - by Fruits
- 6.2.1. Production Analysis
- 6.2.2. Consumption Analysis (Value & Volume)
- 6.2.3. Import Analysis (Value & Volume)
- 6.2.4. Export Analysis (Value & Volume)
- 6.2.5. Price Trend Analysis
- 6.3. Market Analysis, Insights and Forecast - by Vegetables
- 6.3.1. Production Analysis
- 6.3.2. Consumption Analysis (Value & Volume)
- 6.3.3. Import Analysis (Value & Volume)
- 6.3.4. Export Analysis (Value & Volume)
- 6.3.5. Price Trend Analysis
- 6.4. Market Analysis, Insights and Forecast - by Oilseeds/Non-food Crops
- 6.4.1. Production Analysis
- 6.4.2. Consumption Analysis (Value & Volume)
- 6.4.3. Import Analysis (Value & Volume)
- 6.4.4. Export Analysis (Value & Volume)
- 6.4.5. Price Trend Analysis
- 6.5. Market Analysis, Insights and Forecast - by Food Crops/Cereals
- 6.5.1. Production Analysis
- 6.5.2. Consumption Analysis (Value & Volume)
- 6.5.3. Import Analysis (Value & Volume)
- 6.5.4. Export Analysis (Value & Volume)
- 6.5.5. Price Trend Analysis
- 6.6. Market Analysis, Insights and Forecast - by Fruits
- 6.6.1. Production Analysis
- 6.6.2. Consumption Analysis (Value & Volume)
- 6.6.3. Import Analysis (Value & Volume)
- 6.6.4. Export Analysis (Value & Volume)
- 6.6.5. Price Trend Analysis
- 6.7. Market Analysis, Insights and Forecast - by Vegetables
- 6.7.1. Production Analysis
- 6.7.2. Consumption Analysis (Value & Volume)
- 6.7.3. Import Analysis (Value & Volume)
- 6.7.4. Export Analysis (Value & Volume)
- 6.7.5. Price Trend Analysis
- 6.8. Market Analysis, Insights and Forecast - by Oilseeds/Non-food Crops
- 6.8.1. Production Analysis
- 6.8.2. Consumption Analysis (Value & Volume)
- 6.8.3. Import Analysis (Value & Volume)
- 6.8.4. Export Analysis (Value & Volume)
- 6.8.5. Price Trend Analysis
- 6.1. Market Analysis, Insights and Forecast - by Food Crops/Cereals
- 7. South America MENA Agriculture Industry Analysis, Insights and Forecast, 2020-2032
- 7.1. Market Analysis, Insights and Forecast - by Food Crops/Cereals
- 7.1.1. Production Analysis
- 7.1.2. Consumption Analysis (Value & Volume)
- 7.1.3. Import Analysis (Value & Volume)
- 7.1.4. Export Analysis (Value & Volume)
- 7.1.5. Price Trend Analysis
- 7.2. Market Analysis, Insights and Forecast - by Fruits
- 7.2.1. Production Analysis
- 7.2.2. Consumption Analysis (Value & Volume)
- 7.2.3. Import Analysis (Value & Volume)
- 7.2.4. Export Analysis (Value & Volume)
- 7.2.5. Price Trend Analysis
- 7.3. Market Analysis, Insights and Forecast - by Vegetables
- 7.3.1. Production Analysis
- 7.3.2. Consumption Analysis (Value & Volume)
- 7.3.3. Import Analysis (Value & Volume)
- 7.3.4. Export Analysis (Value & Volume)
- 7.3.5. Price Trend Analysis
- 7.4. Market Analysis, Insights and Forecast - by Oilseeds/Non-food Crops
- 7.4.1. Production Analysis
- 7.4.2. Consumption Analysis (Value & Volume)
- 7.4.3. Import Analysis (Value & Volume)
- 7.4.4. Export Analysis (Value & Volume)
- 7.4.5. Price Trend Analysis
- 7.5. Market Analysis, Insights and Forecast - by Food Crops/Cereals
- 7.5.1. Production Analysis
- 7.5.2. Consumption Analysis (Value & Volume)
- 7.5.3. Import Analysis (Value & Volume)
- 7.5.4. Export Analysis (Value & Volume)
- 7.5.5. Price Trend Analysis
- 7.6. Market Analysis, Insights and Forecast - by Fruits
- 7.6.1. Production Analysis
- 7.6.2. Consumption Analysis (Value & Volume)
- 7.6.3. Import Analysis (Value & Volume)
- 7.6.4. Export Analysis (Value & Volume)
- 7.6.5. Price Trend Analysis
- 7.7. Market Analysis, Insights and Forecast - by Vegetables
- 7.7.1. Production Analysis
- 7.7.2. Consumption Analysis (Value & Volume)
- 7.7.3. Import Analysis (Value & Volume)
- 7.7.4. Export Analysis (Value & Volume)
- 7.7.5. Price Trend Analysis
- 7.8. Market Analysis, Insights and Forecast - by Oilseeds/Non-food Crops
- 7.8.1. Production Analysis
- 7.8.2. Consumption Analysis (Value & Volume)
- 7.8.3. Import Analysis (Value & Volume)
- 7.8.4. Export Analysis (Value & Volume)
- 7.8.5. Price Trend Analysis
- 7.1. Market Analysis, Insights and Forecast - by Food Crops/Cereals
- 8. Europe MENA Agriculture Industry Analysis, Insights and Forecast, 2020-2032
- 8.1. Market Analysis, Insights and Forecast - by Food Crops/Cereals
- 8.1.1. Production Analysis
- 8.1.2. Consumption Analysis (Value & Volume)
- 8.1.3. Import Analysis (Value & Volume)
- 8.1.4. Export Analysis (Value & Volume)
- 8.1.5. Price Trend Analysis
- 8.2. Market Analysis, Insights and Forecast - by Fruits
- 8.2.1. Production Analysis
- 8.2.2. Consumption Analysis (Value & Volume)
- 8.2.3. Import Analysis (Value & Volume)
- 8.2.4. Export Analysis (Value & Volume)
- 8.2.5. Price Trend Analysis
- 8.3. Market Analysis, Insights and Forecast - by Vegetables
- 8.3.1. Production Analysis
- 8.3.2. Consumption Analysis (Value & Volume)
- 8.3.3. Import Analysis (Value & Volume)
- 8.3.4. Export Analysis (Value & Volume)
- 8.3.5. Price Trend Analysis
- 8.4. Market Analysis, Insights and Forecast - by Oilseeds/Non-food Crops
- 8.4.1. Production Analysis
- 8.4.2. Consumption Analysis (Value & Volume)
- 8.4.3. Import Analysis (Value & Volume)
- 8.4.4. Export Analysis (Value & Volume)
- 8.4.5. Price Trend Analysis
- 8.5. Market Analysis, Insights and Forecast - by Food Crops/Cereals
- 8.5.1. Production Analysis
- 8.5.2. Consumption Analysis (Value & Volume)
- 8.5.3. Import Analysis (Value & Volume)
- 8.5.4. Export Analysis (Value & Volume)
- 8.5.5. Price Trend Analysis
- 8.6. Market Analysis, Insights and Forecast - by Fruits
- 8.6.1. Production Analysis
- 8.6.2. Consumption Analysis (Value & Volume)
- 8.6.3. Import Analysis (Value & Volume)
- 8.6.4. Export Analysis (Value & Volume)
- 8.6.5. Price Trend Analysis
- 8.7. Market Analysis, Insights and Forecast - by Vegetables
- 8.7.1. Production Analysis
- 8.7.2. Consumption Analysis (Value & Volume)
- 8.7.3. Import Analysis (Value & Volume)
- 8.7.4. Export Analysis (Value & Volume)
- 8.7.5. Price Trend Analysis
- 8.8. Market Analysis, Insights and Forecast - by Oilseeds/Non-food Crops
- 8.8.1. Production Analysis
- 8.8.2. Consumption Analysis (Value & Volume)
- 8.8.3. Import Analysis (Value & Volume)
- 8.8.4. Export Analysis (Value & Volume)
- 8.8.5. Price Trend Analysis
- 8.1. Market Analysis, Insights and Forecast - by Food Crops/Cereals
- 9. Middle East & Africa MENA Agriculture Industry Analysis, Insights and Forecast, 2020-2032
- 9.1. Market Analysis, Insights and Forecast - by Food Crops/Cereals
- 9.1.1. Production Analysis
- 9.1.2. Consumption Analysis (Value & Volume)
- 9.1.3. Import Analysis (Value & Volume)
- 9.1.4. Export Analysis (Value & Volume)
- 9.1.5. Price Trend Analysis
- 9.2. Market Analysis, Insights and Forecast - by Fruits
- 9.2.1. Production Analysis
- 9.2.2. Consumption Analysis (Value & Volume)
- 9.2.3. Import Analysis (Value & Volume)
- 9.2.4. Export Analysis (Value & Volume)
- 9.2.5. Price Trend Analysis
- 9.3. Market Analysis, Insights and Forecast - by Vegetables
- 9.3.1. Production Analysis
- 9.3.2. Consumption Analysis (Value & Volume)
- 9.3.3. Import Analysis (Value & Volume)
- 9.3.4. Export Analysis (Value & Volume)
- 9.3.5. Price Trend Analysis
- 9.4. Market Analysis, Insights and Forecast - by Oilseeds/Non-food Crops
- 9.4.1. Production Analysis
- 9.4.2. Consumption Analysis (Value & Volume)
- 9.4.3. Import Analysis (Value & Volume)
- 9.4.4. Export Analysis (Value & Volume)
- 9.4.5. Price Trend Analysis
- 9.5. Market Analysis, Insights and Forecast - by Food Crops/Cereals
- 9.5.1. Production Analysis
- 9.5.2. Consumption Analysis (Value & Volume)
- 9.5.3. Import Analysis (Value & Volume)
- 9.5.4. Export Analysis (Value & Volume)
- 9.5.5. Price Trend Analysis
- 9.6. Market Analysis, Insights and Forecast - by Fruits
- 9.6.1. Production Analysis
- 9.6.2. Consumption Analysis (Value & Volume)
- 9.6.3. Import Analysis (Value & Volume)
- 9.6.4. Export Analysis (Value & Volume)
- 9.6.5. Price Trend Analysis
- 9.7. Market Analysis, Insights and Forecast - by Vegetables
- 9.7.1. Production Analysis
- 9.7.2. Consumption Analysis (Value & Volume)
- 9.7.3. Import Analysis (Value & Volume)
- 9.7.4. Export Analysis (Value & Volume)
- 9.7.5. Price Trend Analysis
- 9.8. Market Analysis, Insights and Forecast - by Oilseeds/Non-food Crops
- 9.8.1. Production Analysis
- 9.8.2. Consumption Analysis (Value & Volume)
- 9.8.3. Import Analysis (Value & Volume)
- 9.8.4. Export Analysis (Value & Volume)
- 9.8.5. Price Trend Analysis
- 9.1. Market Analysis, Insights and Forecast - by Food Crops/Cereals
- 10. Asia Pacific MENA Agriculture Industry Analysis, Insights and Forecast, 2020-2032
- 10.1. Market Analysis, Insights and Forecast - by Food Crops/Cereals
- 10.1.1. Production Analysis
- 10.1.2. Consumption Analysis (Value & Volume)
- 10.1.3. Import Analysis (Value & Volume)
- 10.1.4. Export Analysis (Value & Volume)
- 10.1.5. Price Trend Analysis
- 10.2. Market Analysis, Insights and Forecast - by Fruits
- 10.2.1. Production Analysis
- 10.2.2. Consumption Analysis (Value & Volume)
- 10.2.3. Import Analysis (Value & Volume)
- 10.2.4. Export Analysis (Value & Volume)
- 10.2.5. Price Trend Analysis
- 10.3. Market Analysis, Insights and Forecast - by Vegetables
- 10.3.1. Production Analysis
- 10.3.2. Consumption Analysis (Value & Volume)
- 10.3.3. Import Analysis (Value & Volume)
- 10.3.4. Export Analysis (Value & Volume)
- 10.3.5. Price Trend Analysis
- 10.4. Market Analysis, Insights and Forecast - by Oilseeds/Non-food Crops
- 10.4.1. Production Analysis
- 10.4.2. Consumption Analysis (Value & Volume)
- 10.4.3. Import Analysis (Value & Volume)
- 10.4.4. Export Analysis (Value & Volume)
- 10.4.5. Price Trend Analysis
- 10.5. Market Analysis, Insights and Forecast - by Food Crops/Cereals
- 10.5.1. Production Analysis
- 10.5.2. Consumption Analysis (Value & Volume)
- 10.5.3. Import Analysis (Value & Volume)
- 10.5.4. Export Analysis (Value & Volume)
- 10.5.5. Price Trend Analysis
- 10.6. Market Analysis, Insights and Forecast - by Fruits
- 10.6.1. Production Analysis
- 10.6.2. Consumption Analysis (Value & Volume)
- 10.6.3. Import Analysis (Value & Volume)
- 10.6.4. Export Analysis (Value & Volume)
- 10.6.5. Price Trend Analysis
- 10.7. Market Analysis, Insights and Forecast - by Vegetables
- 10.7.1. Production Analysis
- 10.7.2. Consumption Analysis (Value & Volume)
- 10.7.3. Import Analysis (Value & Volume)
- 10.7.4. Export Analysis (Value & Volume)
- 10.7.5. Price Trend Analysis
- 10.8. Market Analysis, Insights and Forecast - by Oilseeds/Non-food Crops
- 10.8.1. Production Analysis
- 10.8.2. Consumption Analysis (Value & Volume)
- 10.8.3. Import Analysis (Value & Volume)
- 10.8.4. Export Analysis (Value & Volume)
- 10.8.5. Price Trend Analysis
- 10.1. Market Analysis, Insights and Forecast - by Food Crops/Cereals
- 11. Competitive Analysis
- 11.1. Global Market Share Analysis 2025
- 11.2. Company Profiles
- 11.2.1 Almarai
- 11.2.1.1. Overview
- 11.2.1.2. Products
- 11.2.1.3. SWOT Analysis
- 11.2.1.4. Recent Developments
- 11.2.1.5. Financials (Based on Availability)
- 11.2.2 Juhayna
- 11.2.2.1. Overview
- 11.2.2.2. Products
- 11.2.2.3. SWOT Analysis
- 11.2.2.4. Recent Developments
- 11.2.2.5. Financials (Based on Availability)
- 11.2.3 Agthia Group
- 11.2.3.1. Overview
- 11.2.3.2. Products
- 11.2.3.3. SWOT Analysis
- 11.2.3.4. Recent Developments
- 11.2.3.5. Financials (Based on Availability)
- 11.2.4 Baladna
- 11.2.4.1. Overview
- 11.2.4.2. Products
- 11.2.4.3. SWOT Analysis
- 11.2.4.4. Recent Developments
- 11.2.4.5. Financials (Based on Availability)
- 11.2.5 Limagrain
- 11.2.5.1. Overview
- 11.2.5.2. Products
- 11.2.5.3. SWOT Analysis
- 11.2.5.4. Recent Developments
- 11.2.5.5. Financials (Based on Availability)
- 11.2.6 Syngenta
- 11.2.6.1. Overview
- 11.2.6.2. Products
- 11.2.6.3. SWOT Analysis
- 11.2.6.4. Recent Developments
- 11.2.6.5. Financials (Based on Availability)
- 11.2.7 Nadec
- 11.2.7.1. Overview
- 11.2.7.2. Products
- 11.2.7.3. SWOT Analysis
- 11.2.7.4. Recent Developments
- 11.2.7.5. Financials (Based on Availability)
- 11.2.8 Bayer
- 11.2.8.1. Overview
- 11.2.8.2. Products
- 11.2.8.3. SWOT Analysis
- 11.2.8.4. Recent Developments
- 11.2.8.5. Financials (Based on Availability)
- 11.2.9 Masdar
- 11.2.9.1. Overview
- 11.2.9.2. Products
- 11.2.9.3. SWOT Analysis
- 11.2.9.4. Recent Developments
- 11.2.9.5. Financials (Based on Availability)
- 11.2.10 Savola Group
- 11.2.10.1. Overview
- 11.2.10.2. Products
- 11.2.10.3. SWOT Analysis
- 11.2.10.4. Recent Developments
- 11.2.10.5. Financials (Based on Availability)
- 11.2.11 Al Dahra
- 11.2.11.1. Overview
- 11.2.11.2. Products
- 11.2.11.3. SWOT Analysis
- 11.2.11.4. Recent Developments
- 11.2.11.5. Financials (Based on Availability)
- 11.2.1 Almarai
List of Figures
- Figure 1: Global MENA Agriculture Industry Revenue Breakdown (undefined, %) by Region 2025 & 2033
- Figure 2: North America MENA Agriculture Industry Revenue (undefined), by Food Crops/Cereals 2025 & 2033
- Figure 3: North America MENA Agriculture Industry Revenue Share (%), by Food Crops/Cereals 2025 & 2033
- Figure 4: North America MENA Agriculture Industry Revenue (undefined), by Fruits 2025 & 2033
- Figure 5: North America MENA Agriculture Industry Revenue Share (%), by Fruits 2025 & 2033
- Figure 6: North America MENA Agriculture Industry Revenue (undefined), by Vegetables 2025 & 2033
- Figure 7: North America MENA Agriculture Industry Revenue Share (%), by Vegetables 2025 & 2033
- Figure 8: North America MENA Agriculture Industry Revenue (undefined), by Oilseeds/Non-food Crops 2025 & 2033
- Figure 9: North America MENA Agriculture Industry Revenue Share (%), by Oilseeds/Non-food Crops 2025 & 2033
- Figure 10: North America MENA Agriculture Industry Revenue (undefined), by Food Crops/Cereals 2025 & 2033
- Figure 11: North America MENA Agriculture Industry Revenue Share (%), by Food Crops/Cereals 2025 & 2033
- Figure 12: North America MENA Agriculture Industry Revenue (undefined), by Fruits 2025 & 2033
- Figure 13: North America MENA Agriculture Industry Revenue Share (%), by Fruits 2025 & 2033
- Figure 14: North America MENA Agriculture Industry Revenue (undefined), by Vegetables 2025 & 2033
- Figure 15: North America MENA Agriculture Industry Revenue Share (%), by Vegetables 2025 & 2033
- Figure 16: North America MENA Agriculture Industry Revenue (undefined), by Oilseeds/Non-food Crops 2025 & 2033
- Figure 17: North America MENA Agriculture Industry Revenue Share (%), by Oilseeds/Non-food Crops 2025 & 2033
- Figure 18: North America MENA Agriculture Industry Revenue (undefined), by Country 2025 & 2033
- Figure 19: North America MENA Agriculture Industry Revenue Share (%), by Country 2025 & 2033
- Figure 20: South America MENA Agriculture Industry Revenue (undefined), by Food Crops/Cereals 2025 & 2033
- Figure 21: South America MENA Agriculture Industry Revenue Share (%), by Food Crops/Cereals 2025 & 2033
- Figure 22: South America MENA Agriculture Industry Revenue (undefined), by Fruits 2025 & 2033
- Figure 23: South America MENA Agriculture Industry Revenue Share (%), by Fruits 2025 & 2033
- Figure 24: South America MENA Agriculture Industry Revenue (undefined), by Vegetables 2025 & 2033
- Figure 25: South America MENA Agriculture Industry Revenue Share (%), by Vegetables 2025 & 2033
- Figure 26: South America MENA Agriculture Industry Revenue (undefined), by Oilseeds/Non-food Crops 2025 & 2033
- Figure 27: South America MENA Agriculture Industry Revenue Share (%), by Oilseeds/Non-food Crops 2025 & 2033
- Figure 28: South America MENA Agriculture Industry Revenue (undefined), by Food Crops/Cereals 2025 & 2033
- Figure 29: South America MENA Agriculture Industry Revenue Share (%), by Food Crops/Cereals 2025 & 2033
- Figure 30: South America MENA Agriculture Industry Revenue (undefined), by Fruits 2025 & 2033
- Figure 31: South America MENA Agriculture Industry Revenue Share (%), by Fruits 2025 & 2033
- Figure 32: South America MENA Agriculture Industry Revenue (undefined), by Vegetables 2025 & 2033
- Figure 33: South America MENA Agriculture Industry Revenue Share (%), by Vegetables 2025 & 2033
- Figure 34: South America MENA Agriculture Industry Revenue (undefined), by Oilseeds/Non-food Crops 2025 & 2033
- Figure 35: South America MENA Agriculture Industry Revenue Share (%), by Oilseeds/Non-food Crops 2025 & 2033
- Figure 36: South America MENA Agriculture Industry Revenue (undefined), by Country 2025 & 2033
- Figure 37: South America MENA Agriculture Industry Revenue Share (%), by Country 2025 & 2033
- Figure 38: Europe MENA Agriculture Industry Revenue (undefined), by Food Crops/Cereals 2025 & 2033
- Figure 39: Europe MENA Agriculture Industry Revenue Share (%), by Food Crops/Cereals 2025 & 2033
- Figure 40: Europe MENA Agriculture Industry Revenue (undefined), by Fruits 2025 & 2033
- Figure 41: Europe MENA Agriculture Industry Revenue Share (%), by Fruits 2025 & 2033
- Figure 42: Europe MENA Agriculture Industry Revenue (undefined), by Vegetables 2025 & 2033
- Figure 43: Europe MENA Agriculture Industry Revenue Share (%), by Vegetables 2025 & 2033
- Figure 44: Europe MENA Agriculture Industry Revenue (undefined), by Oilseeds/Non-food Crops 2025 & 2033
- Figure 45: Europe MENA Agriculture Industry Revenue Share (%), by Oilseeds/Non-food Crops 2025 & 2033
- Figure 46: Europe MENA Agriculture Industry Revenue (undefined), by Food Crops/Cereals 2025 & 2033
- Figure 47: Europe MENA Agriculture Industry Revenue Share (%), by Food Crops/Cereals 2025 & 2033
- Figure 48: Europe MENA Agriculture Industry Revenue (undefined), by Fruits 2025 & 2033
- Figure 49: Europe MENA Agriculture Industry Revenue Share (%), by Fruits 2025 & 2033
- Figure 50: Europe MENA Agriculture Industry Revenue (undefined), by Vegetables 2025 & 2033
- Figure 51: Europe MENA Agriculture Industry Revenue Share (%), by Vegetables 2025 & 2033
- Figure 52: Europe MENA Agriculture Industry Revenue (undefined), by Oilseeds/Non-food Crops 2025 & 2033
- Figure 53: Europe MENA Agriculture Industry Revenue Share (%), by Oilseeds/Non-food Crops 2025 & 2033
- Figure 54: Europe MENA Agriculture Industry Revenue (undefined), by Country 2025 & 2033
- Figure 55: Europe MENA Agriculture Industry Revenue Share (%), by Country 2025 & 2033
- Figure 56: Middle East & Africa MENA Agriculture Industry Revenue (undefined), by Food Crops/Cereals 2025 & 2033
- Figure 57: Middle East & Africa MENA Agriculture Industry Revenue Share (%), by Food Crops/Cereals 2025 & 2033
- Figure 58: Middle East & Africa MENA Agriculture Industry Revenue (undefined), by Fruits 2025 & 2033
- Figure 59: Middle East & Africa MENA Agriculture Industry Revenue Share (%), by Fruits 2025 & 2033
- Figure 60: Middle East & Africa MENA Agriculture Industry Revenue (undefined), by Vegetables 2025 & 2033
- Figure 61: Middle East & Africa MENA Agriculture Industry Revenue Share (%), by Vegetables 2025 & 2033
- Figure 62: Middle East & Africa MENA Agriculture Industry Revenue (undefined), by Oilseeds/Non-food Crops 2025 & 2033
- Figure 63: Middle East & Africa MENA Agriculture Industry Revenue Share (%), by Oilseeds/Non-food Crops 2025 & 2033
- Figure 64: Middle East & Africa MENA Agriculture Industry Revenue (undefined), by Food Crops/Cereals 2025 & 2033
- Figure 65: Middle East & Africa MENA Agriculture Industry Revenue Share (%), by Food Crops/Cereals 2025 & 2033
- Figure 66: Middle East & Africa MENA Agriculture Industry Revenue (undefined), by Fruits 2025 & 2033
- Figure 67: Middle East & Africa MENA Agriculture Industry Revenue Share (%), by Fruits 2025 & 2033
- Figure 68: Middle East & Africa MENA Agriculture Industry Revenue (undefined), by Vegetables 2025 & 2033
- Figure 69: Middle East & Africa MENA Agriculture Industry Revenue Share (%), by Vegetables 2025 & 2033
- Figure 70: Middle East & Africa MENA Agriculture Industry Revenue (undefined), by Oilseeds/Non-food Crops 2025 & 2033
- Figure 71: Middle East & Africa MENA Agriculture Industry Revenue Share (%), by Oilseeds/Non-food Crops 2025 & 2033
- Figure 72: Middle East & Africa MENA Agriculture Industry Revenue (undefined), by Country 2025 & 2033
- Figure 73: Middle East & Africa MENA Agriculture Industry Revenue Share (%), by Country 2025 & 2033
- Figure 74: Asia Pacific MENA Agriculture Industry Revenue (undefined), by Food Crops/Cereals 2025 & 2033
- Figure 75: Asia Pacific MENA Agriculture Industry Revenue Share (%), by Food Crops/Cereals 2025 & 2033
- Figure 76: Asia Pacific MENA Agriculture Industry Revenue (undefined), by Fruits 2025 & 2033
- Figure 77: Asia Pacific MENA Agriculture Industry Revenue Share (%), by Fruits 2025 & 2033
- Figure 78: Asia Pacific MENA Agriculture Industry Revenue (undefined), by Vegetables 2025 & 2033
- Figure 79: Asia Pacific MENA Agriculture Industry Revenue Share (%), by Vegetables 2025 & 2033
- Figure 80: Asia Pacific MENA Agriculture Industry Revenue (undefined), by Oilseeds/Non-food Crops 2025 & 2033
- Figure 81: Asia Pacific MENA Agriculture Industry Revenue Share (%), by Oilseeds/Non-food Crops 2025 & 2033
- Figure 82: Asia Pacific MENA Agriculture Industry Revenue (undefined), by Food Crops/Cereals 2025 & 2033
- Figure 83: Asia Pacific MENA Agriculture Industry Revenue Share (%), by Food Crops/Cereals 2025 & 2033
- Figure 84: Asia Pacific MENA Agriculture Industry Revenue (undefined), by Fruits 2025 & 2033
- Figure 85: Asia Pacific MENA Agriculture Industry Revenue Share (%), by Fruits 2025 & 2033
- Figure 86: Asia Pacific MENA Agriculture Industry Revenue (undefined), by Vegetables 2025 & 2033
- Figure 87: Asia Pacific MENA Agriculture Industry Revenue Share (%), by Vegetables 2025 & 2033
- Figure 88: Asia Pacific MENA Agriculture Industry Revenue (undefined), by Oilseeds/Non-food Crops 2025 & 2033
- Figure 89: Asia Pacific MENA Agriculture Industry Revenue Share (%), by Oilseeds/Non-food Crops 2025 & 2033
- Figure 90: Asia Pacific MENA Agriculture Industry Revenue (undefined), by Country 2025 & 2033
- Figure 91: Asia Pacific MENA Agriculture Industry Revenue Share (%), by Country 2025 & 2033
List of Tables
- Table 1: Global MENA Agriculture Industry Revenue undefined Forecast, by Food Crops/Cereals 2020 & 2033
- Table 2: Global MENA Agriculture Industry Revenue undefined Forecast, by Fruits 2020 & 2033
- Table 3: Global MENA Agriculture Industry Revenue undefined Forecast, by Vegetables 2020 & 2033
- Table 4: Global MENA Agriculture Industry Revenue undefined Forecast, by Oilseeds/Non-food Crops 2020 & 2033
- Table 5: Global MENA Agriculture Industry Revenue undefined Forecast, by Food Crops/Cereals 2020 & 2033
- Table 6: Global MENA Agriculture Industry Revenue undefined Forecast, by Fruits 2020 & 2033
- Table 7: Global MENA Agriculture Industry Revenue undefined Forecast, by Vegetables 2020 & 2033
- Table 8: Global MENA Agriculture Industry Revenue undefined Forecast, by Oilseeds/Non-food Crops 2020 & 2033
- Table 9: Global MENA Agriculture Industry Revenue undefined Forecast, by Region 2020 & 2033
- Table 10: Global MENA Agriculture Industry Revenue undefined Forecast, by Food Crops/Cereals 2020 & 2033
- Table 11: Global MENA Agriculture Industry Revenue undefined Forecast, by Fruits 2020 & 2033
- Table 12: Global MENA Agriculture Industry Revenue undefined Forecast, by Vegetables 2020 & 2033
- Table 13: Global MENA Agriculture Industry Revenue undefined Forecast, by Oilseeds/Non-food Crops 2020 & 2033
- Table 14: Global MENA Agriculture Industry Revenue undefined Forecast, by Food Crops/Cereals 2020 & 2033
- Table 15: Global MENA Agriculture Industry Revenue undefined Forecast, by Fruits 2020 & 2033
- Table 16: Global MENA Agriculture Industry Revenue undefined Forecast, by Vegetables 2020 & 2033
- Table 17: Global MENA Agriculture Industry Revenue undefined Forecast, by Oilseeds/Non-food Crops 2020 & 2033
- Table 18: Global MENA Agriculture Industry Revenue undefined Forecast, by Country 2020 & 2033
- Table 19: United States MENA Agriculture Industry Revenue (undefined) Forecast, by Application 2020 & 2033
- Table 20: Canada MENA Agriculture Industry Revenue (undefined) Forecast, by Application 2020 & 2033
- Table 21: Mexico MENA Agriculture Industry Revenue (undefined) Forecast, by Application 2020 & 2033
- Table 22: Global MENA Agriculture Industry Revenue undefined Forecast, by Food Crops/Cereals 2020 & 2033
- Table 23: Global MENA Agriculture Industry Revenue undefined Forecast, by Fruits 2020 & 2033
- Table 24: Global MENA Agriculture Industry Revenue undefined Forecast, by Vegetables 2020 & 2033
- Table 25: Global MENA Agriculture Industry Revenue undefined Forecast, by Oilseeds/Non-food Crops 2020 & 2033
- Table 26: Global MENA Agriculture Industry Revenue undefined Forecast, by Food Crops/Cereals 2020 & 2033
- Table 27: Global MENA Agriculture Industry Revenue undefined Forecast, by Fruits 2020 & 2033
- Table 28: Global MENA Agriculture Industry Revenue undefined Forecast, by Vegetables 2020 & 2033
- Table 29: Global MENA Agriculture Industry Revenue undefined Forecast, by Oilseeds/Non-food Crops 2020 & 2033
- Table 30: Global MENA Agriculture Industry Revenue undefined Forecast, by Country 2020 & 2033
- Table 31: Brazil MENA Agriculture Industry Revenue (undefined) Forecast, by Application 2020 & 2033
- Table 32: Argentina MENA Agriculture Industry Revenue (undefined) Forecast, by Application 2020 & 2033
- Table 33: Rest of South America MENA Agriculture Industry Revenue (undefined) Forecast, by Application 2020 & 2033
- Table 34: Global MENA Agriculture Industry Revenue undefined Forecast, by Food Crops/Cereals 2020 & 2033
- Table 35: Global MENA Agriculture Industry Revenue undefined Forecast, by Fruits 2020 & 2033
- Table 36: Global MENA Agriculture Industry Revenue undefined Forecast, by Vegetables 2020 & 2033
- Table 37: Global MENA Agriculture Industry Revenue undefined Forecast, by Oilseeds/Non-food Crops 2020 & 2033
- Table 38: Global MENA Agriculture Industry Revenue undefined Forecast, by Food Crops/Cereals 2020 & 2033
- Table 39: Global MENA Agriculture Industry Revenue undefined Forecast, by Fruits 2020 & 2033
- Table 40: Global MENA Agriculture Industry Revenue undefined Forecast, by Vegetables 2020 & 2033
- Table 41: Global MENA Agriculture Industry Revenue undefined Forecast, by Oilseeds/Non-food Crops 2020 & 2033
- Table 42: Global MENA Agriculture Industry Revenue undefined Forecast, by Country 2020 & 2033
- Table 43: United Kingdom MENA Agriculture Industry Revenue (undefined) Forecast, by Application 2020 & 2033
- Table 44: Germany MENA Agriculture Industry Revenue (undefined) Forecast, by Application 2020 & 2033
- Table 45: France MENA Agriculture Industry Revenue (undefined) Forecast, by Application 2020 & 2033
- Table 46: Italy MENA Agriculture Industry Revenue (undefined) Forecast, by Application 2020 & 2033
- Table 47: Spain MENA Agriculture Industry Revenue (undefined) Forecast, by Application 2020 & 2033
- Table 48: Russia MENA Agriculture Industry Revenue (undefined) Forecast, by Application 2020 & 2033
- Table 49: Benelux MENA Agriculture Industry Revenue (undefined) Forecast, by Application 2020 & 2033
- Table 50: Nordics MENA Agriculture Industry Revenue (undefined) Forecast, by Application 2020 & 2033
- Table 51: Rest of Europe MENA Agriculture Industry Revenue (undefined) Forecast, by Application 2020 & 2033
- Table 52: Global MENA Agriculture Industry Revenue undefined Forecast, by Food Crops/Cereals 2020 & 2033
- Table 53: Global MENA Agriculture Industry Revenue undefined Forecast, by Fruits 2020 & 2033
- Table 54: Global MENA Agriculture Industry Revenue undefined Forecast, by Vegetables 2020 & 2033
- Table 55: Global MENA Agriculture Industry Revenue undefined Forecast, by Oilseeds/Non-food Crops 2020 & 2033
- Table 56: Global MENA Agriculture Industry Revenue undefined Forecast, by Food Crops/Cereals 2020 & 2033
- Table 57: Global MENA Agriculture Industry Revenue undefined Forecast, by Fruits 2020 & 2033
- Table 58: Global MENA Agriculture Industry Revenue undefined Forecast, by Vegetables 2020 & 2033
- Table 59: Global MENA Agriculture Industry Revenue undefined Forecast, by Oilseeds/Non-food Crops 2020 & 2033
- Table 60: Global MENA Agriculture Industry Revenue undefined Forecast, by Country 2020 & 2033
- Table 61: Turkey MENA Agriculture Industry Revenue (undefined) Forecast, by Application 2020 & 2033
- Table 62: Israel MENA Agriculture Industry Revenue (undefined) Forecast, by Application 2020 & 2033
- Table 63: GCC MENA Agriculture Industry Revenue (undefined) Forecast, by Application 2020 & 2033
- Table 64: North Africa MENA Agriculture Industry Revenue (undefined) Forecast, by Application 2020 & 2033
- Table 65: South Africa MENA Agriculture Industry Revenue (undefined) Forecast, by Application 2020 & 2033
- Table 66: Rest of Middle East & Africa MENA Agriculture Industry Revenue (undefined) Forecast, by Application 2020 & 2033
- Table 67: Global MENA Agriculture Industry Revenue undefined Forecast, by Food Crops/Cereals 2020 & 2033
- Table 68: Global MENA Agriculture Industry Revenue undefined Forecast, by Fruits 2020 & 2033
- Table 69: Global MENA Agriculture Industry Revenue undefined Forecast, by Vegetables 2020 & 2033
- Table 70: Global MENA Agriculture Industry Revenue undefined Forecast, by Oilseeds/Non-food Crops 2020 & 2033
- Table 71: Global MENA Agriculture Industry Revenue undefined Forecast, by Food Crops/Cereals 2020 & 2033
- Table 72: Global MENA Agriculture Industry Revenue undefined Forecast, by Fruits 2020 & 2033
- Table 73: Global MENA Agriculture Industry Revenue undefined Forecast, by Vegetables 2020 & 2033
- Table 74: Global MENA Agriculture Industry Revenue undefined Forecast, by Oilseeds/Non-food Crops 2020 & 2033
- Table 75: Global MENA Agriculture Industry Revenue undefined Forecast, by Country 2020 & 2033
- Table 76: China MENA Agriculture Industry Revenue (undefined) Forecast, by Application 2020 & 2033
- Table 77: India MENA Agriculture Industry Revenue (undefined) Forecast, by Application 2020 & 2033
- Table 78: Japan MENA Agriculture Industry Revenue (undefined) Forecast, by Application 2020 & 2033
- Table 79: South Korea MENA Agriculture Industry Revenue (undefined) Forecast, by Application 2020 & 2033
- Table 80: ASEAN MENA Agriculture Industry Revenue (undefined) Forecast, by Application 2020 & 2033
- Table 81: Oceania MENA Agriculture Industry Revenue (undefined) Forecast, by Application 2020 & 2033
- Table 82: Rest of Asia Pacific MENA Agriculture Industry Revenue (undefined) Forecast, by Application 2020 & 2033
Frequently Asked Questions
1. What is the projected Compound Annual Growth Rate (CAGR) of the MENA Agriculture Industry?
The projected CAGR is approximately 14.6%.
2. Which companies are prominent players in the MENA Agriculture Industry?
Key companies in the market include Almarai , Juhayna , Agthia Group, Baladna, Limagrain , Syngenta , Nadec , Bayer , Masdar , Savola Group, Al Dahra.
3. What are the main segments of the MENA Agriculture Industry?
The market segments include Food Crops/Cereals, Fruits, Vegetables, Oilseeds/Non-food Crops, Food Crops/Cereals, Fruits, Vegetables, Oilseeds/Non-food Crops.
4. Can you provide details about the market size?
The market size is estimated to be USD XXX N/A as of 2022.
5. What are some drivers contributing to market growth?
Increasing Adoption of Technology in Horticulture; Government Initiatives for Self-reliance in Vegetable and Fruit Farming.
6. What are the notable trends driving market growth?
Quest for Food Self-sufficiency is Driving Production.
7. Are there any restraints impacting market growth?
Limited Resource Availability and Unfavourable Climatic Condition; Increasing Reliance on Imports for Domestic Supply.
8. Can you provide examples of recent developments in the market?
September 2022: A new vertical farming facility was opened in Dubai, UAE, developed by a joint venture between Emirates Flight Catering and Crop one with an investment of USD 40 million for the facility.
9. What pricing options are available for accessing the report?
Pricing options include single-user, multi-user, and enterprise licenses priced at USD 3800, USD 4500, and USD 5800 respectively.
10. Is the market size provided in terms of value or volume?
The market size is provided in terms of value, measured in N/A.
11. Are there any specific market keywords associated with the report?
Yes, the market keyword associated with the report is "MENA Agriculture Industry," which aids in identifying and referencing the specific market segment covered.
12. How do I determine which pricing option suits my needs best?
The pricing options vary based on user requirements and access needs. Individual users may opt for single-user licenses, while businesses requiring broader access may choose multi-user or enterprise licenses for cost-effective access to the report.
13. Are there any additional resources or data provided in the MENA Agriculture Industry report?
While the report offers comprehensive insights, it's advisable to review the specific contents or supplementary materials provided to ascertain if additional resources or data are available.
14. How can I stay updated on further developments or reports in the MENA Agriculture Industry?
To stay informed about further developments, trends, and reports in the MENA Agriculture Industry, consider subscribing to industry newsletters, following relevant companies and organizations, or regularly checking reputable industry news sources and publications.
Methodology
Step 1 - Identification of Relevant Samples Size from Population Database


Step 2 - Approaches for Defining Global Market Size (Value, Volume* & Price*)

Note*: In applicable scenarios
Step 3 - Data Sources
Primary Research
- Web Analytics
- Survey Reports
- Research Institute
- Latest Research Reports
- Opinion Leaders
Secondary Research
- Annual Reports
- White Paper
- Latest Press Release
- Industry Association
- Paid Database
- Investor Presentations

Step 4 - Data Triangulation
Involves using different sources of information in order to increase the validity of a study
These sources are likely to be stakeholders in a program - participants, other researchers, program staff, other community members, and so on.
Then we put all data in single framework & apply various statistical tools to find out the dynamic on the market.
During the analysis stage, feedback from the stakeholder groups would be compared to determine areas of agreement as well as areas of divergence