

Key Insights
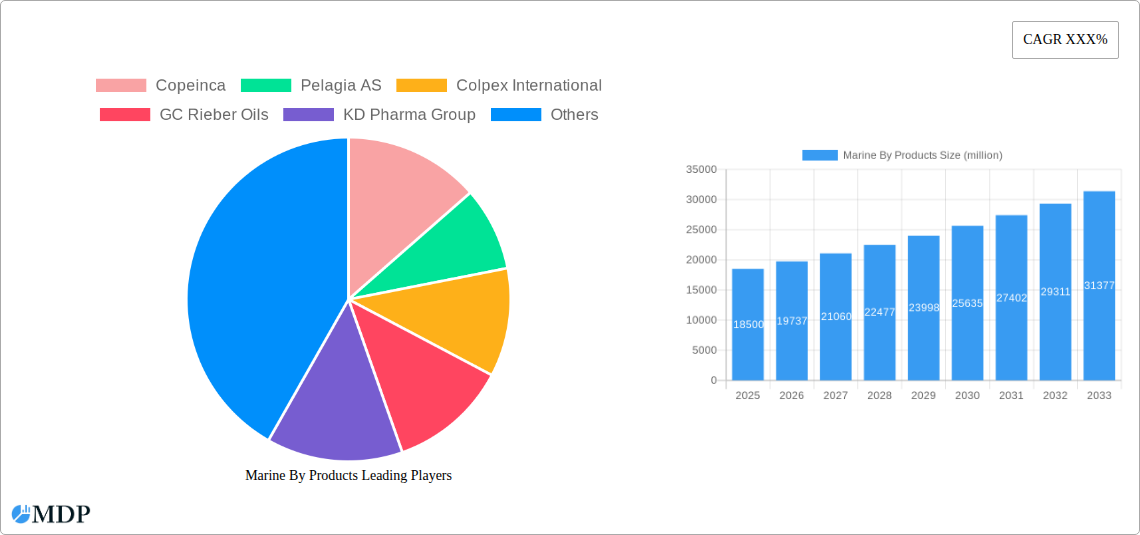
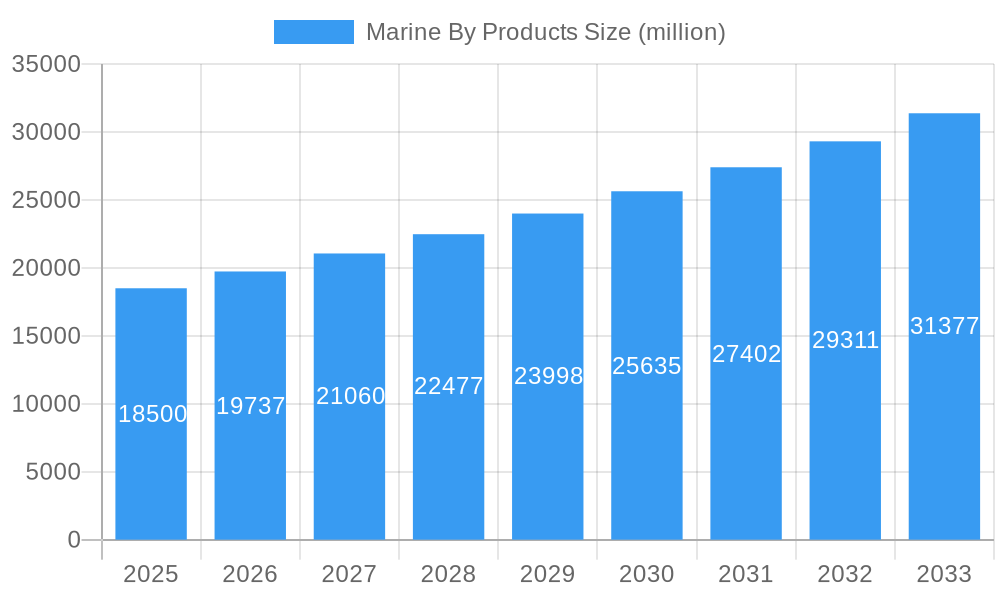
The global Marine By Products market is poised for significant expansion, projected to reach an estimated market size of USD 18,500 million by 2025. This robust growth is driven by a confluence of factors, most notably the escalating demand for high-value ingredients in the Food and Nutritional Supplements sector, fueled by increasing consumer awareness of health and wellness. The Feed Ingredients segment also presents a substantial growth opportunity, as the aquaculture industry continues its upward trajectory, demanding sustainable and nutrient-rich feed alternatives. Furthermore, the rising application of marine by-products in Cosmetics and Personal Care and the burgeoning pharmaceutical applications within Medicine and Biotechnology are key accelerators. Innovations in processing technologies and a growing emphasis on circular economy principles, transforming previously discarded marine residues into valuable commodities, are also significantly contributing to market momentum. The market is characterized by a strong Compound Annual Growth Rate (CAGR) of 6.5% projected over the forecast period, indicating a sustained upward trend.
Marine By Products Market Size (In Billion)
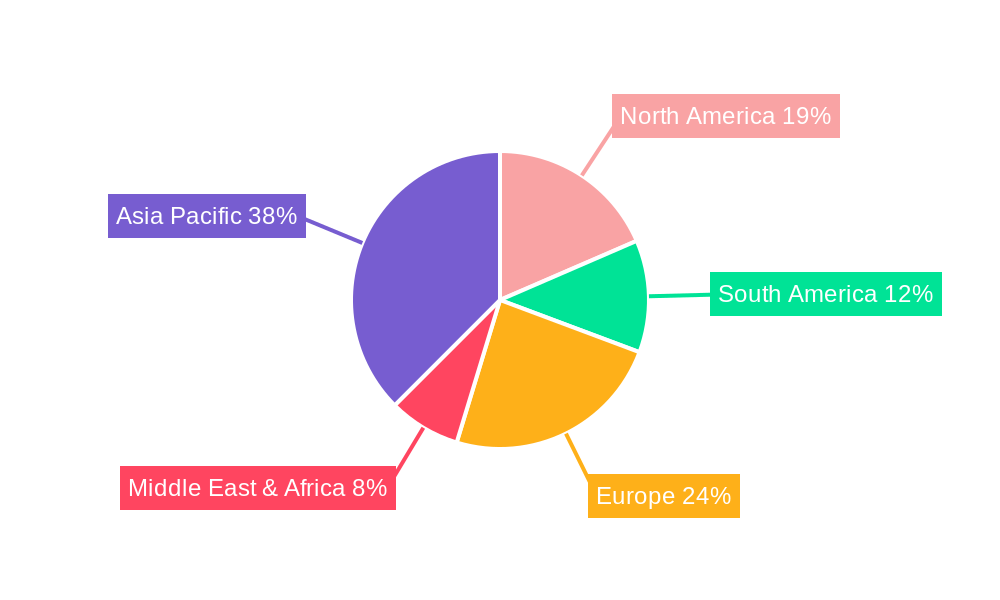
While the market demonstrates strong potential, certain restraints warrant attention. Regulatory hurdles concerning the sourcing, processing, and labeling of marine by-products, particularly for human consumption, can pose challenges. Additionally, concerns regarding the sustainability of fishing practices and potential over-exploitation of marine resources could temper growth if not adequately addressed. However, these challenges are increasingly being mitigated by advancements in sustainable aquaculture and by-product utilization technologies. Geographically, Asia Pacific is anticipated to dominate the market share due to its extensive coastlines, significant fish processing activities, and a rapidly growing population with increasing disposable income. The market segmentation by type reveals that Fish Oil and Fish Meal are likely to remain dominant segments, underpinning their critical roles in various downstream applications. Emerging applications in Agriculture for bio-fertilizers and in Environmental Protection and Biofuels also present promising, albeit nascent, avenues for growth.
Marine By Products Company Market Share
Unlocking the Potential: A Comprehensive Report on the Global Marine By-Products Market (2019-2033)
This in-depth report provides a critical analysis of the global marine by-products market, encompassing a comprehensive study period from 2019 to 2033, with a base year of 2025. Delve into the intricate dynamics, burgeoning trends, leading segments, and strategic outlook of this vital industry. Explore the innovations shaping the future of fish oil, fish meal, and frozen seafood applications across food and nutritional supplements, feed ingredients, cosmetics and personal care, medicine and biotechnology, agriculture, and environmental protection and biofuels.
Marine By Products Market Dynamics & Concentration
The global marine by-products market exhibits a moderate to high concentration, with key players like Copeinca, Pelagia AS, Colpex International, GC Rieber Oils, KD Pharma Group, FF Skagen, Austevoll Seafood ASA, Qingdao Kangjing Marine Biotechnology Co. Ltd, Scanbio Marine Group, Aker BioMarine, and Omega Protein Corporation holding significant market share. In 2025, Copeinca is projected to command a market share of approximately 15%, followed by Pelagia AS at 12%, and Omega Protein Corporation at 10%. Innovation drivers are primarily focused on sustainable sourcing, enhanced processing technologies for higher nutrient yields, and the development of novel applications for omega-3 fatty acids and other bio-active compounds. Regulatory frameworks, particularly concerning sustainability certifications and traceability, are becoming increasingly stringent, influencing market access and operational strategies. Product substitutes, while present, often lack the unique nutritional profile and efficacy of marine-derived ingredients, particularly in specialized applications like pharmaceuticals and high-value animal feed. End-user trends are leaning towards demand for traceable, ethically sourced, and premium quality marine by-products. Mergers and acquisition (M&A) activities are expected to continue, with an estimated 3-5 significant deals anticipated annually throughout the forecast period, aimed at expanding geographical reach, acquiring proprietary technologies, and consolidating supply chains.
Marine By Products Industry Trends & Analysis
The marine by-products industry is poised for robust growth, driven by a confluence of expanding consumer awareness regarding health and wellness, increasing demand for sustainable protein sources, and advancements in processing technologies. The Compound Annual Growth Rate (CAGR) for the global marine by-products market is projected to be around 6.5% from 2025 to 2033. This growth is fueled by several key factors. Firstly, the escalating demand for fish oil as a source of omega-3 fatty acids (EPA and DHA) in dietary supplements and functional foods is a major catalyst. As global populations become more health-conscious and research continues to highlight the benefits of omega-3s for cardiovascular health, cognitive function, and anti-inflammatory properties, the market penetration of fish oil-based products is expected to rise significantly. Secondly, the aquaculture and livestock sectors are increasingly relying on fish meal as a vital protein ingredient in animal feed. The need for efficient and sustainable feed solutions to support the growing global demand for animal protein ensures a steady and expanding market for fish meal. Furthermore, the burgeoning interest in natural and sustainable ingredients within the cosmetics and personal care industry is creating new avenues for marine by-products, such as collagen and other bio-active compounds with anti-aging and moisturizing properties. Technological disruptions are playing a crucial role, with innovations in extraction, purification, and encapsulation techniques improving the quality, stability, and bioavailability of marine by-products. This includes enzymatic hydrolysis, supercritical fluid extraction, and microencapsulation, which enhance product shelf-life and tailor-made functionalities. Consumer preferences are increasingly shifting towards ethically sourced, traceable, and environmentally responsible products, prompting companies to invest in sustainable fishing practices and transparent supply chains. Competitive dynamics are characterized by both established global players and emerging regional innovators, with a growing emphasis on product differentiation and value-added offerings. The market penetration of specialized marine-derived ingredients is steadily increasing across various application segments.
Leading Markets & Segments in Marine By Products
The Asia-Pacific region is anticipated to emerge as the dominant market for marine by-products, driven by its large population, growing economies, and increasing disposable incomes, leading to a higher demand for protein-rich foods and nutritional supplements. Within this region, China is expected to be a key growth engine due to its extensive aquaculture industry and a rapidly expanding middle class that is increasingly prioritizing health and wellness.
Application Dominance:
- Feed Ingredients: This segment is projected to maintain its leading position, driven by the insatiable demand from the aquaculture and livestock industries.
- Key Drivers: Growth in global protein consumption, increasing adoption of scientifically formulated animal feeds, and the necessity for sustainable and high-quality protein sources to meet the demands of a growing population. The efficiency of fish meal as a protein source for farmed fish and poultry is unmatched, making it indispensable.
- Food and Nutritional Supplements: This segment is experiencing rapid growth due to heightened consumer awareness of the health benefits of omega-3 fatty acids and other marine bio-actives.
- Key Drivers: Increasing prevalence of lifestyle diseases, growing demand for preventive healthcare solutions, and advancements in the formulation of dietary supplements, including capsules, powders, and fortified foods. The scientifically proven benefits of EPA and DHA for heart health and cognitive function are major market drivers.
- Medicine and Biotechnology: This segment holds significant potential for specialized, high-value applications.
- Key Drivers: Ongoing research into the therapeutic properties of marine compounds, development of novel pharmaceuticals and nutraceuticals derived from marine organisms, and increasing investment in biopharmaceutical research and development.
Type Dominance:
- Fish Oil: This type of marine by-product is experiencing substantial growth due to its rich omega-3 fatty acid content.
- Key Drivers: Demand for dietary supplements, functional foods and beverages, and its application in animal feed for improved health and growth. The versatility and proven health benefits are key factors.
- Fish Meal: Remaining a cornerstone of the animal feed industry.
- Key Drivers: Essential protein source for aquaculture, poultry, and swine farming, especially in regions with high agricultural output. Its consistent quality and nutritional profile make it a preferred choice.
- Frozen Seafood: While not exclusively a "by-product," the utilization of edible portions as frozen seafood contributes significantly to the overall marine resource economy, indirectly impacting by-product availability.
- Key Drivers: Global demand for convenient and accessible protein sources, advancements in freezing and preservation technologies, and the expansion of cold chain logistics.
Marine By Products Product Developments
Recent product developments in the marine by-products market are characterized by a focus on enhanced bioavailability and targeted delivery of key nutrients. Innovations in enzymatic processing are yielding highly digestible fish protein hydrolysates for specialized animal feeds and human nutrition. Furthermore, advancements in microencapsulation technologies are improving the stability and palatability of omega-3 rich oils, expanding their application in infant formulas and functional beverages. The development of marine-derived collagen peptides for the cosmetics and nutraceutical industries, targeting skin health and joint support, also represents a significant market trend, offering competitive advantages through natural sourcing and proven efficacy.
Key Drivers of Marine By Products Growth
The growth of the marine by-products market is propelled by several interconnected factors. Technological advancements in extraction, purification, and encapsulation techniques are enabling the development of higher-value, more bioavailable ingredients. Economic factors, such as rising global disposable incomes and increasing demand for protein-rich foods, are creating substantial market opportunities. Furthermore, growing consumer awareness regarding the health benefits of omega-3 fatty acids and the demand for sustainable, natural ingredients are significant drivers. Supportive regulatory frameworks that promote sustainable fishing practices and encourage the use of marine resources for human and animal consumption also contribute positively to market expansion.
Challenges in the Marine By Products Market
The marine by-products market faces several significant challenges. Regulatory hurdles, including stringent import/export regulations and evolving sustainability standards across different regions, can complicate global trade and increase operational costs. Supply chain vulnerabilities, stemming from fluctuating fish stocks, seasonal availability, and geopolitical factors, can lead to price volatility and impact production consistency. Intense competitive pressures from both established players and new entrants, alongside the development of alternative protein sources, necessitate continuous innovation and cost optimization. The potential for overfishing and the need for responsible resource management also pose ethical and operational challenges for long-term sustainability.
Emerging Opportunities in Marine By Products
Emerging opportunities in the marine by-products market are largely driven by technological breakthroughs and strategic market expansion. The development of novel applications for marine bio-actives in pharmaceuticals and advanced nutraceuticals presents a significant growth avenue. Strategic partnerships between research institutions and industry players are accelerating the discovery and commercialization of new marine-derived compounds with therapeutic potential. Furthermore, expanding into under-served geographical markets and catering to the growing demand for sustainable and traceable seafood ingredients in emerging economies offer substantial growth catalysts. The increasing focus on circular economy principles also presents opportunities for valorizing waste streams into high-value products.
Leading Players in the Marine By Products Sector
- Copeinca
- Pelagia AS
- Colpex International
- GC Rieber Oils
- KD Pharma Group
- FF Skagen
- Austevoll Seafood ASA
- Qingdao Kangjing Marine Biotechnology Co. Ltd
- Scanbio Marine Group
- Aker BioMarine
- Omega Protein Corporation
Key Milestones in Marine By Products Industry
- 2019: Launch of Aker BioMarine's krill oil supplement for human consumption, highlighting advanced purification techniques.
- 2020: FF Skagen invests significantly in upgrading its fish meal and fish oil production facilities to enhance sustainability and efficiency.
- 2021: Omega Protein Corporation announces strategic partnerships to expand its salmon feed ingredient offerings.
- 2022: Pelagia AS acquires a new processing plant, increasing its capacity for high-quality fish oil production.
- 2023: KD Pharma Group secures regulatory approval for a new high-concentration omega-3 fatty acid formulation for pharmaceutical use.
- 2024: Austevoll Seafood ASA reports record revenues driven by strong demand in fish meal and aquaculture products.
Strategic Outlook for Marine By Products Market
The strategic outlook for the marine by-products market remains exceptionally positive, driven by an increasing global emphasis on health, sustainability, and responsible resource utilization. Growth accelerators will stem from the continued innovation in high-value applications, particularly within the nutraceutical, pharmaceutical, and specialized feed sectors. Companies that invest in sustainable sourcing, advanced processing technologies, and robust traceability systems will be best positioned for long-term success. Strategic opportunities lie in expanding product portfolios to encompass a wider range of marine bio-actives and forging collaborations to unlock new therapeutic and nutritional applications, ensuring a resilient and prosperous future for the industry.
Marine By Products Segmentation
-
1. Application
- 1.1. Food And Nutritional Supplements
- 1.2. Feed Ingredients
- 1.3. Cosmetics And Personal Care
- 1.4. Medicine And Biotechnology
- 1.5. Agriculture
- 1.6. Environmental Protection And Biofuels
-
2. Type
- 2.1. Frozen Seafood
- 2.2. Fish Oil
- 2.3. Fish Meal
Marine By Products Segmentation By Geography
-
1. North America
- 1.1. United States
- 1.2. Canada
- 1.3. Mexico
-
2. South America
- 2.1. Brazil
- 2.2. Argentina
- 2.3. Rest of South America
-
3. Europe
- 3.1. United Kingdom
- 3.2. Germany
- 3.3. France
- 3.4. Italy
- 3.5. Spain
- 3.6. Russia
- 3.7. Benelux
- 3.8. Nordics
- 3.9. Rest of Europe
-
4. Middle East & Africa
- 4.1. Turkey
- 4.2. Israel
- 4.3. GCC
- 4.4. North Africa
- 4.5. South Africa
- 4.6. Rest of Middle East & Africa
-
5. Asia Pacific
- 5.1. China
- 5.2. India
- 5.3. Japan
- 5.4. South Korea
- 5.5. ASEAN
- 5.6. Oceania
- 5.7. Rest of Asia Pacific
Marine By Products Regional Market Share
Geographic Coverage of Marine By Products
Marine By Products REPORT HIGHLIGHTS
| Aspects | Details |
|---|---|
| Study Period | 2020-2034 |
| Base Year | 2025 |
| Estimated Year | 2026 |
| Forecast Period | 2026-2034 |
| Historical Period | 2020-2025 |
| Growth Rate | CAGR of XXX% from 2020-2034 |
| Segmentation |
|
Table of Contents
- 1. Introduction
- 1.1. Research Scope
- 1.2. Market Segmentation
- 1.3. Research Methodology
- 1.4. Definitions and Assumptions
- 2. Executive Summary
- 2.1. Introduction
- 3. Market Dynamics
- 3.1. Introduction
- 3.2. Market Drivers
- 3.3. Market Restrains
- 3.4. Market Trends
- 4. Market Factor Analysis
- 4.1. Porters Five Forces
- 4.2. Supply/Value Chain
- 4.3. PESTEL analysis
- 4.4. Market Entropy
- 4.5. Patent/Trademark Analysis
- 5. Global Marine By Products Analysis, Insights and Forecast, 2020-2032
- 5.1. Market Analysis, Insights and Forecast - by Application
- 5.1.1. Food And Nutritional Supplements
- 5.1.2. Feed Ingredients
- 5.1.3. Cosmetics And Personal Care
- 5.1.4. Medicine And Biotechnology
- 5.1.5. Agriculture
- 5.1.6. Environmental Protection And Biofuels
- 5.2. Market Analysis, Insights and Forecast - by Type
- 5.2.1. Frozen Seafood
- 5.2.2. Fish Oil
- 5.2.3. Fish Meal
- 5.3. Market Analysis, Insights and Forecast - by Region
- 5.3.1. North America
- 5.3.2. South America
- 5.3.3. Europe
- 5.3.4. Middle East & Africa
- 5.3.5. Asia Pacific
- 5.1. Market Analysis, Insights and Forecast - by Application
- 6. North America Marine By Products Analysis, Insights and Forecast, 2020-2032
- 6.1. Market Analysis, Insights and Forecast - by Application
- 6.1.1. Food And Nutritional Supplements
- 6.1.2. Feed Ingredients
- 6.1.3. Cosmetics And Personal Care
- 6.1.4. Medicine And Biotechnology
- 6.1.5. Agriculture
- 6.1.6. Environmental Protection And Biofuels
- 6.2. Market Analysis, Insights and Forecast - by Type
- 6.2.1. Frozen Seafood
- 6.2.2. Fish Oil
- 6.2.3. Fish Meal
- 6.1. Market Analysis, Insights and Forecast - by Application
- 7. South America Marine By Products Analysis, Insights and Forecast, 2020-2032
- 7.1. Market Analysis, Insights and Forecast - by Application
- 7.1.1. Food And Nutritional Supplements
- 7.1.2. Feed Ingredients
- 7.1.3. Cosmetics And Personal Care
- 7.1.4. Medicine And Biotechnology
- 7.1.5. Agriculture
- 7.1.6. Environmental Protection And Biofuels
- 7.2. Market Analysis, Insights and Forecast - by Type
- 7.2.1. Frozen Seafood
- 7.2.2. Fish Oil
- 7.2.3. Fish Meal
- 7.1. Market Analysis, Insights and Forecast - by Application
- 8. Europe Marine By Products Analysis, Insights and Forecast, 2020-2032
- 8.1. Market Analysis, Insights and Forecast - by Application
- 8.1.1. Food And Nutritional Supplements
- 8.1.2. Feed Ingredients
- 8.1.3. Cosmetics And Personal Care
- 8.1.4. Medicine And Biotechnology
- 8.1.5. Agriculture
- 8.1.6. Environmental Protection And Biofuels
- 8.2. Market Analysis, Insights and Forecast - by Type
- 8.2.1. Frozen Seafood
- 8.2.2. Fish Oil
- 8.2.3. Fish Meal
- 8.1. Market Analysis, Insights and Forecast - by Application
- 9. Middle East & Africa Marine By Products Analysis, Insights and Forecast, 2020-2032
- 9.1. Market Analysis, Insights and Forecast - by Application
- 9.1.1. Food And Nutritional Supplements
- 9.1.2. Feed Ingredients
- 9.1.3. Cosmetics And Personal Care
- 9.1.4. Medicine And Biotechnology
- 9.1.5. Agriculture
- 9.1.6. Environmental Protection And Biofuels
- 9.2. Market Analysis, Insights and Forecast - by Type
- 9.2.1. Frozen Seafood
- 9.2.2. Fish Oil
- 9.2.3. Fish Meal
- 9.1. Market Analysis, Insights and Forecast - by Application
- 10. Asia Pacific Marine By Products Analysis, Insights and Forecast, 2020-2032
- 10.1. Market Analysis, Insights and Forecast - by Application
- 10.1.1. Food And Nutritional Supplements
- 10.1.2. Feed Ingredients
- 10.1.3. Cosmetics And Personal Care
- 10.1.4. Medicine And Biotechnology
- 10.1.5. Agriculture
- 10.1.6. Environmental Protection And Biofuels
- 10.2. Market Analysis, Insights and Forecast - by Type
- 10.2.1. Frozen Seafood
- 10.2.2. Fish Oil
- 10.2.3. Fish Meal
- 10.1. Market Analysis, Insights and Forecast - by Application
- 11. Competitive Analysis
- 11.1. Global Market Share Analysis 2025
- 11.2. Company Profiles
- 11.2.1 Copeinca
- 11.2.1.1. Overview
- 11.2.1.2. Products
- 11.2.1.3. SWOT Analysis
- 11.2.1.4. Recent Developments
- 11.2.1.5. Financials (Based on Availability)
- 11.2.2 Pelagia AS
- 11.2.2.1. Overview
- 11.2.2.2. Products
- 11.2.2.3. SWOT Analysis
- 11.2.2.4. Recent Developments
- 11.2.2.5. Financials (Based on Availability)
- 11.2.3 Colpex International
- 11.2.3.1. Overview
- 11.2.3.2. Products
- 11.2.3.3. SWOT Analysis
- 11.2.3.4. Recent Developments
- 11.2.3.5. Financials (Based on Availability)
- 11.2.4 GC Rieber Oils
- 11.2.4.1. Overview
- 11.2.4.2. Products
- 11.2.4.3. SWOT Analysis
- 11.2.4.4. Recent Developments
- 11.2.4.5. Financials (Based on Availability)
- 11.2.5 KD Pharma Group
- 11.2.5.1. Overview
- 11.2.5.2. Products
- 11.2.5.3. SWOT Analysis
- 11.2.5.4. Recent Developments
- 11.2.5.5. Financials (Based on Availability)
- 11.2.6 FF Skagen
- 11.2.6.1. Overview
- 11.2.6.2. Products
- 11.2.6.3. SWOT Analysis
- 11.2.6.4. Recent Developments
- 11.2.6.5. Financials (Based on Availability)
- 11.2.7 Austevoll Seafood ASA
- 11.2.7.1. Overview
- 11.2.7.2. Products
- 11.2.7.3. SWOT Analysis
- 11.2.7.4. Recent Developments
- 11.2.7.5. Financials (Based on Availability)
- 11.2.8 Qingdao Kangjing Marine Biotechnology Co. Ltd
- 11.2.8.1. Overview
- 11.2.8.2. Products
- 11.2.8.3. SWOT Analysis
- 11.2.8.4. Recent Developments
- 11.2.8.5. Financials (Based on Availability)
- 11.2.9 Scanbio Marine Group
- 11.2.9.1. Overview
- 11.2.9.2. Products
- 11.2.9.3. SWOT Analysis
- 11.2.9.4. Recent Developments
- 11.2.9.5. Financials (Based on Availability)
- 11.2.10 Aker BioMarine
- 11.2.10.1. Overview
- 11.2.10.2. Products
- 11.2.10.3. SWOT Analysis
- 11.2.10.4. Recent Developments
- 11.2.10.5. Financials (Based on Availability)
- 11.2.11 Omega Protein Corporation
- 11.2.11.1. Overview
- 11.2.11.2. Products
- 11.2.11.3. SWOT Analysis
- 11.2.11.4. Recent Developments
- 11.2.11.5. Financials (Based on Availability)
- 11.2.1 Copeinca
List of Figures
- Figure 1: Global Marine By Products Revenue Breakdown (million, %) by Region 2025 & 2033
- Figure 2: North America Marine By Products Revenue (million), by Application 2025 & 2033
- Figure 3: North America Marine By Products Revenue Share (%), by Application 2025 & 2033
- Figure 4: North America Marine By Products Revenue (million), by Type 2025 & 2033
- Figure 5: North America Marine By Products Revenue Share (%), by Type 2025 & 2033
- Figure 6: North America Marine By Products Revenue (million), by Country 2025 & 2033
- Figure 7: North America Marine By Products Revenue Share (%), by Country 2025 & 2033
- Figure 8: South America Marine By Products Revenue (million), by Application 2025 & 2033
- Figure 9: South America Marine By Products Revenue Share (%), by Application 2025 & 2033
- Figure 10: South America Marine By Products Revenue (million), by Type 2025 & 2033
- Figure 11: South America Marine By Products Revenue Share (%), by Type 2025 & 2033
- Figure 12: South America Marine By Products Revenue (million), by Country 2025 & 2033
- Figure 13: South America Marine By Products Revenue Share (%), by Country 2025 & 2033
- Figure 14: Europe Marine By Products Revenue (million), by Application 2025 & 2033
- Figure 15: Europe Marine By Products Revenue Share (%), by Application 2025 & 2033
- Figure 16: Europe Marine By Products Revenue (million), by Type 2025 & 2033
- Figure 17: Europe Marine By Products Revenue Share (%), by Type 2025 & 2033
- Figure 18: Europe Marine By Products Revenue (million), by Country 2025 & 2033
- Figure 19: Europe Marine By Products Revenue Share (%), by Country 2025 & 2033
- Figure 20: Middle East & Africa Marine By Products Revenue (million), by Application 2025 & 2033
- Figure 21: Middle East & Africa Marine By Products Revenue Share (%), by Application 2025 & 2033
- Figure 22: Middle East & Africa Marine By Products Revenue (million), by Type 2025 & 2033
- Figure 23: Middle East & Africa Marine By Products Revenue Share (%), by Type 2025 & 2033
- Figure 24: Middle East & Africa Marine By Products Revenue (million), by Country 2025 & 2033
- Figure 25: Middle East & Africa Marine By Products Revenue Share (%), by Country 2025 & 2033
- Figure 26: Asia Pacific Marine By Products Revenue (million), by Application 2025 & 2033
- Figure 27: Asia Pacific Marine By Products Revenue Share (%), by Application 2025 & 2033
- Figure 28: Asia Pacific Marine By Products Revenue (million), by Type 2025 & 2033
- Figure 29: Asia Pacific Marine By Products Revenue Share (%), by Type 2025 & 2033
- Figure 30: Asia Pacific Marine By Products Revenue (million), by Country 2025 & 2033
- Figure 31: Asia Pacific Marine By Products Revenue Share (%), by Country 2025 & 2033
List of Tables
- Table 1: Global Marine By Products Revenue million Forecast, by Application 2020 & 2033
- Table 2: Global Marine By Products Revenue million Forecast, by Type 2020 & 2033
- Table 3: Global Marine By Products Revenue million Forecast, by Region 2020 & 2033
- Table 4: Global Marine By Products Revenue million Forecast, by Application 2020 & 2033
- Table 5: Global Marine By Products Revenue million Forecast, by Type 2020 & 2033
- Table 6: Global Marine By Products Revenue million Forecast, by Country 2020 & 2033
- Table 7: United States Marine By Products Revenue (million) Forecast, by Application 2020 & 2033
- Table 8: Canada Marine By Products Revenue (million) Forecast, by Application 2020 & 2033
- Table 9: Mexico Marine By Products Revenue (million) Forecast, by Application 2020 & 2033
- Table 10: Global Marine By Products Revenue million Forecast, by Application 2020 & 2033
- Table 11: Global Marine By Products Revenue million Forecast, by Type 2020 & 2033
- Table 12: Global Marine By Products Revenue million Forecast, by Country 2020 & 2033
- Table 13: Brazil Marine By Products Revenue (million) Forecast, by Application 2020 & 2033
- Table 14: Argentina Marine By Products Revenue (million) Forecast, by Application 2020 & 2033
- Table 15: Rest of South America Marine By Products Revenue (million) Forecast, by Application 2020 & 2033
- Table 16: Global Marine By Products Revenue million Forecast, by Application 2020 & 2033
- Table 17: Global Marine By Products Revenue million Forecast, by Type 2020 & 2033
- Table 18: Global Marine By Products Revenue million Forecast, by Country 2020 & 2033
- Table 19: United Kingdom Marine By Products Revenue (million) Forecast, by Application 2020 & 2033
- Table 20: Germany Marine By Products Revenue (million) Forecast, by Application 2020 & 2033
- Table 21: France Marine By Products Revenue (million) Forecast, by Application 2020 & 2033
- Table 22: Italy Marine By Products Revenue (million) Forecast, by Application 2020 & 2033
- Table 23: Spain Marine By Products Revenue (million) Forecast, by Application 2020 & 2033
- Table 24: Russia Marine By Products Revenue (million) Forecast, by Application 2020 & 2033
- Table 25: Benelux Marine By Products Revenue (million) Forecast, by Application 2020 & 2033
- Table 26: Nordics Marine By Products Revenue (million) Forecast, by Application 2020 & 2033
- Table 27: Rest of Europe Marine By Products Revenue (million) Forecast, by Application 2020 & 2033
- Table 28: Global Marine By Products Revenue million Forecast, by Application 2020 & 2033
- Table 29: Global Marine By Products Revenue million Forecast, by Type 2020 & 2033
- Table 30: Global Marine By Products Revenue million Forecast, by Country 2020 & 2033
- Table 31: Turkey Marine By Products Revenue (million) Forecast, by Application 2020 & 2033
- Table 32: Israel Marine By Products Revenue (million) Forecast, by Application 2020 & 2033
- Table 33: GCC Marine By Products Revenue (million) Forecast, by Application 2020 & 2033
- Table 34: North Africa Marine By Products Revenue (million) Forecast, by Application 2020 & 2033
- Table 35: South Africa Marine By Products Revenue (million) Forecast, by Application 2020 & 2033
- Table 36: Rest of Middle East & Africa Marine By Products Revenue (million) Forecast, by Application 2020 & 2033
- Table 37: Global Marine By Products Revenue million Forecast, by Application 2020 & 2033
- Table 38: Global Marine By Products Revenue million Forecast, by Type 2020 & 2033
- Table 39: Global Marine By Products Revenue million Forecast, by Country 2020 & 2033
- Table 40: China Marine By Products Revenue (million) Forecast, by Application 2020 & 2033
- Table 41: India Marine By Products Revenue (million) Forecast, by Application 2020 & 2033
- Table 42: Japan Marine By Products Revenue (million) Forecast, by Application 2020 & 2033
- Table 43: South Korea Marine By Products Revenue (million) Forecast, by Application 2020 & 2033
- Table 44: ASEAN Marine By Products Revenue (million) Forecast, by Application 2020 & 2033
- Table 45: Oceania Marine By Products Revenue (million) Forecast, by Application 2020 & 2033
- Table 46: Rest of Asia Pacific Marine By Products Revenue (million) Forecast, by Application 2020 & 2033
Frequently Asked Questions
1. What is the projected Compound Annual Growth Rate (CAGR) of the Marine By Products?
The projected CAGR is approximately XXX%.
2. Which companies are prominent players in the Marine By Products?
Key companies in the market include Copeinca, Pelagia AS, Colpex International, GC Rieber Oils, KD Pharma Group, FF Skagen, Austevoll Seafood ASA, Qingdao Kangjing Marine Biotechnology Co. Ltd, Scanbio Marine Group, Aker BioMarine, Omega Protein Corporation.
3. What are the main segments of the Marine By Products?
The market segments include Application, Type.
4. Can you provide details about the market size?
The market size is estimated to be USD XXX million as of 2022.
5. What are some drivers contributing to market growth?
N/A
6. What are the notable trends driving market growth?
N/A
7. Are there any restraints impacting market growth?
N/A
8. Can you provide examples of recent developments in the market?
N/A
9. What pricing options are available for accessing the report?
Pricing options include single-user, multi-user, and enterprise licenses priced at USD 4250.00, USD 6375.00, and USD 8500.00 respectively.
10. Is the market size provided in terms of value or volume?
The market size is provided in terms of value, measured in million.
11. Are there any specific market keywords associated with the report?
Yes, the market keyword associated with the report is "Marine By Products," which aids in identifying and referencing the specific market segment covered.
12. How do I determine which pricing option suits my needs best?
The pricing options vary based on user requirements and access needs. Individual users may opt for single-user licenses, while businesses requiring broader access may choose multi-user or enterprise licenses for cost-effective access to the report.
13. Are there any additional resources or data provided in the Marine By Products report?
While the report offers comprehensive insights, it's advisable to review the specific contents or supplementary materials provided to ascertain if additional resources or data are available.
14. How can I stay updated on further developments or reports in the Marine By Products?
To stay informed about further developments, trends, and reports in the Marine By Products, consider subscribing to industry newsletters, following relevant companies and organizations, or regularly checking reputable industry news sources and publications.
Methodology
Step 1 - Identification of Relevant Samples Size from Population Database


Step 2 - Approaches for Defining Global Market Size (Value, Volume* & Price*)

Note*: In applicable scenarios
Step 3 - Data Sources
Primary Research
- Web Analytics
- Survey Reports
- Research Institute
- Latest Research Reports
- Opinion Leaders
Secondary Research
- Annual Reports
- White Paper
- Latest Press Release
- Industry Association
- Paid Database
- Investor Presentations

Step 4 - Data Triangulation
Involves using different sources of information in order to increase the validity of a study
These sources are likely to be stakeholders in a program - participants, other researchers, program staff, other community members, and so on.
Then we put all data in single framework & apply various statistical tools to find out the dynamic on the market.
During the analysis stage, feedback from the stakeholder groups would be compared to determine areas of agreement as well as areas of divergence