

Key Insights
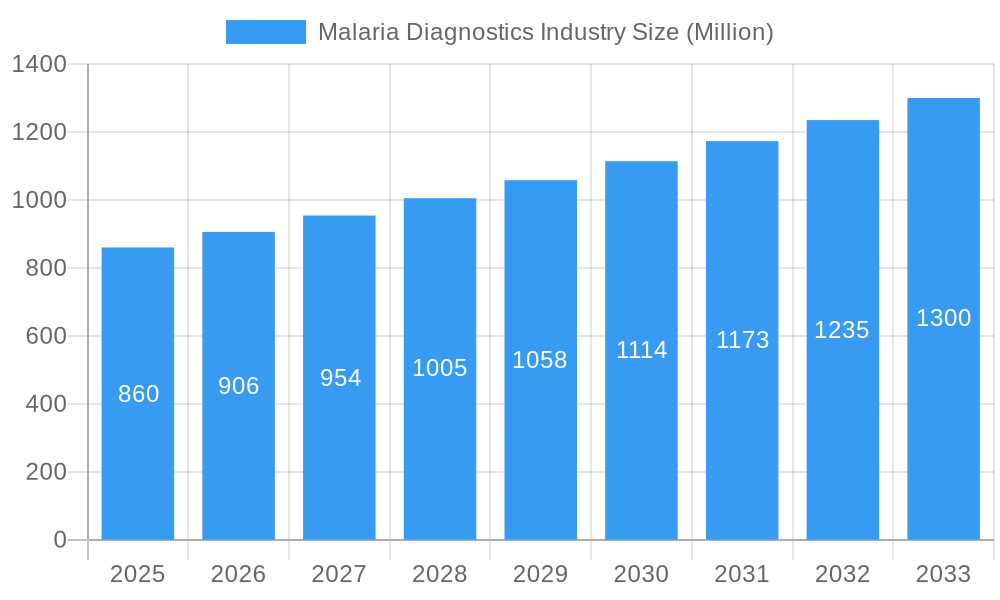
The global malaria diagnostics market, valued at $0.86 billion in 2025, is projected to experience robust growth, driven by increasing malaria prevalence in endemic regions, rising government initiatives for disease control, and advancements in diagnostic technologies. The market's Compound Annual Growth Rate (CAGR) of 5.23% from 2025 to 2033 indicates a significant expansion, particularly fueled by the adoption of rapid diagnostic tests (RDTs) due to their ease of use, portability, and affordability, especially in resource-limited settings. Molecular diagnostics, while more expensive, are gaining traction due to their higher sensitivity and specificity, contributing to improved disease management and surveillance. Technological advancements, including the development of point-of-care diagnostics and innovative molecular assays, are further stimulating market growth. However, challenges such as the emergence of drug-resistant malaria strains, inadequate healthcare infrastructure in many endemic areas, and inconsistencies in diagnostic accuracy across different test types pose some restraints. The market is segmented by technology (clinical diagnostics, microscopic diagnostics, RDTs, molecular diagnostics, and others), with RDTs currently dominating the market share due to their widespread use. Geographically, regions like sub-Saharan Africa and Southeast Asia, with high malaria burden, represent significant growth opportunities, alongside increasing investments in healthcare infrastructure and public health programs in these areas.
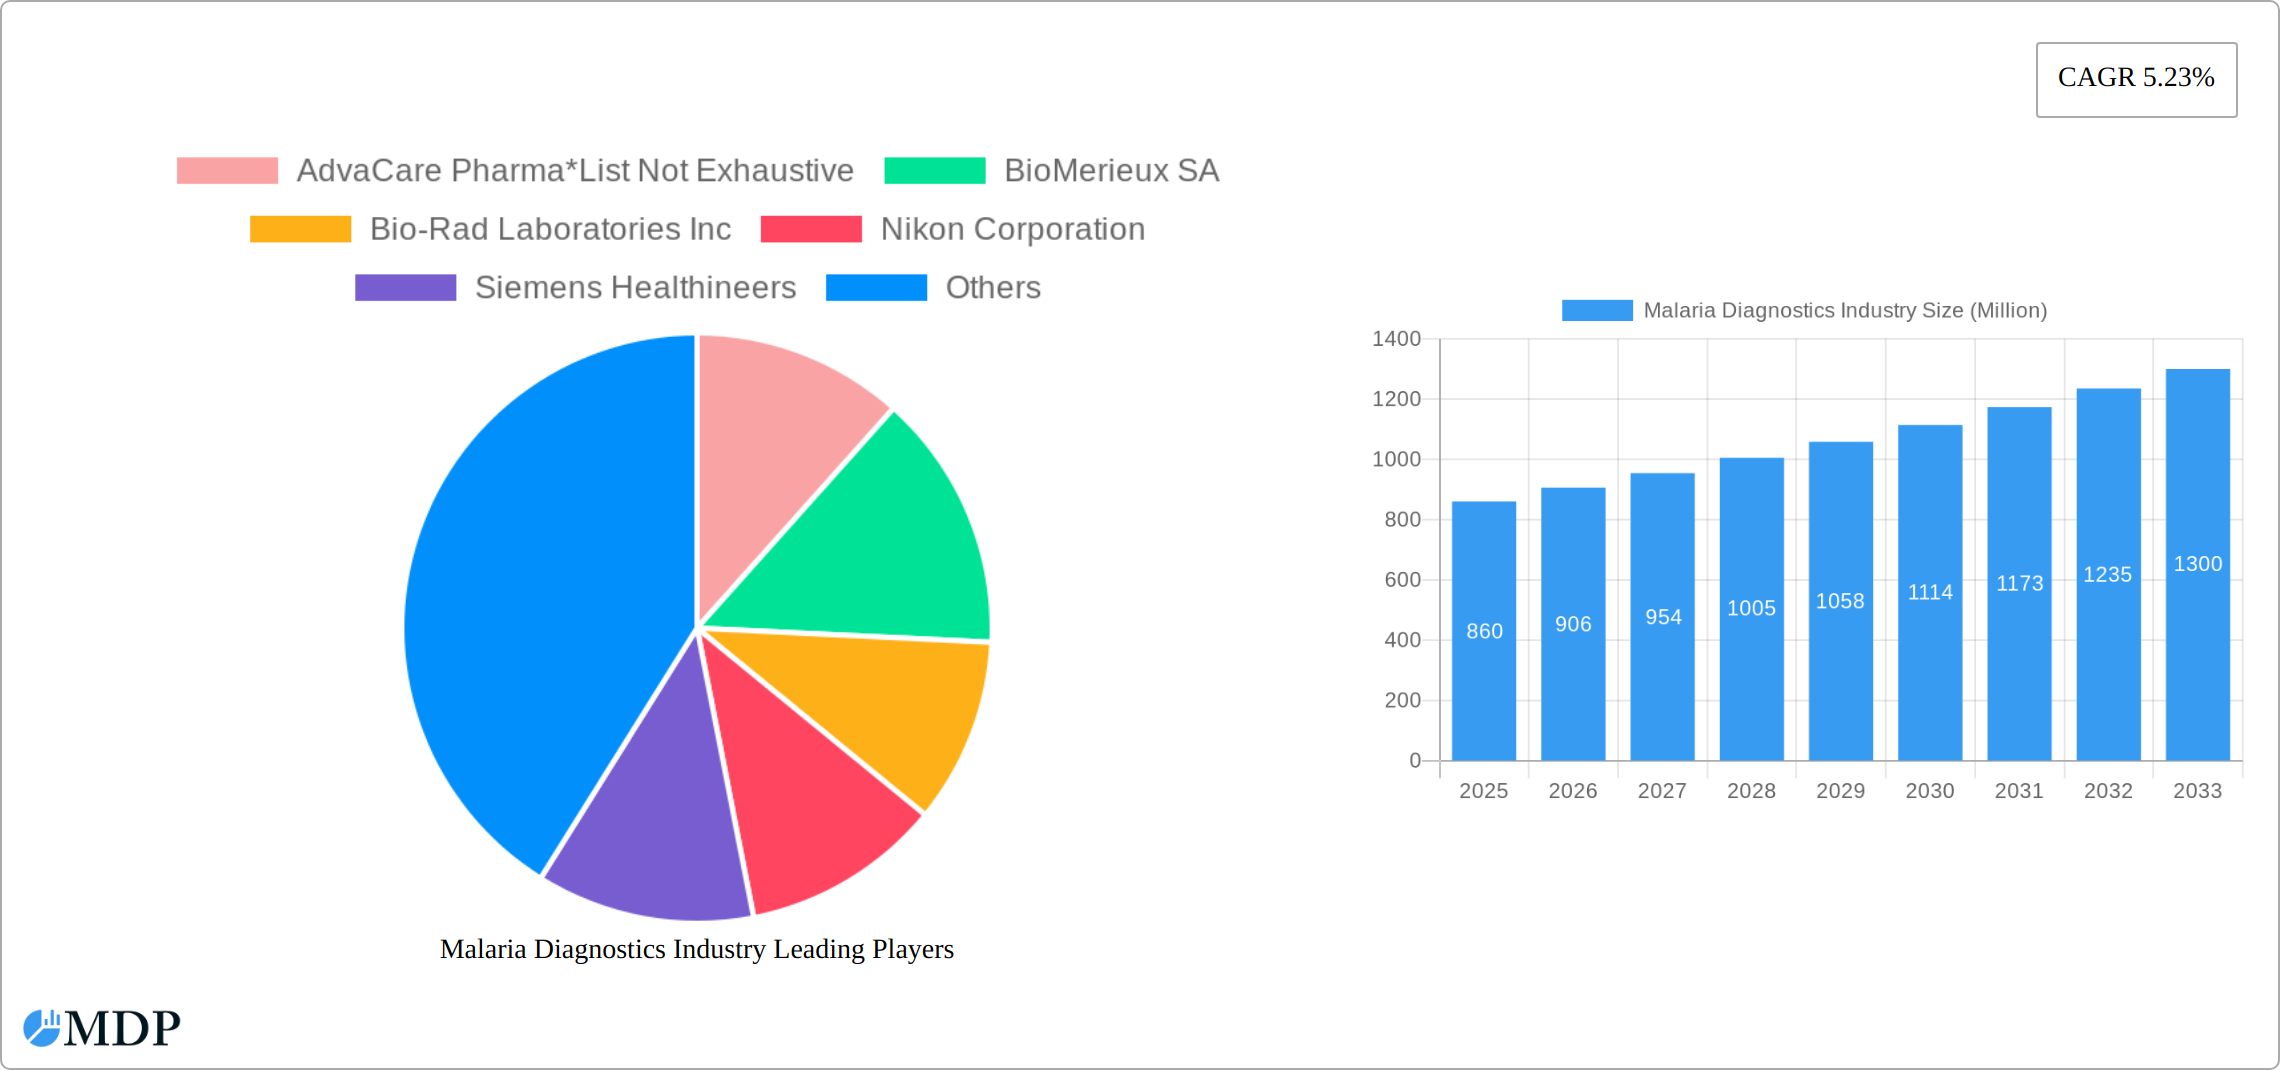
Malaria Diagnostics Industry Market Size (In Million)
The market's expansion is further influenced by several key factors. The growing awareness of the disease burden and its socio-economic impact is driving demand for effective diagnostic solutions. Furthermore, collaborations between public and private organizations, combined with research and development efforts focusing on improving diagnostic accuracy and affordability, will propel the market's trajectory. Competition among major players such as Abbott Laboratories, Bio-Rad Laboratories, and Thermo Fisher Scientific, driving innovation and technological advancements, will also play a pivotal role. While challenges remain, the overall outlook for the malaria diagnostics market remains positive, driven by a confluence of factors aimed at mitigating the significant global health challenge of malaria. Future growth will likely be influenced by the success of malaria eradication initiatives, the development of more robust and sensitive diagnostic tools, and improved access to healthcare in endemic regions.
Malaria Diagnostics Industry Company Market Share
Malaria Diagnostics Industry: A Comprehensive Market Report (2019-2033)
This comprehensive report provides an in-depth analysis of the Malaria Diagnostics Industry, offering invaluable insights for stakeholders, investors, and industry professionals. The report covers market dynamics, leading players, technological advancements, and future growth opportunities, leveraging data from 2019-2024 (Historical Period), with projections extending to 2033 (Forecast Period), using 2025 as the base and estimated year. The global market size is projected to reach xx Million by 2033.
Malaria Diagnostics Industry Market Dynamics & Concentration
This section delves into the market concentration, innovation drivers, regulatory landscape, product substitutes, end-user trends, and mergers & acquisitions (M&A) activities shaping the Malaria Diagnostics industry. While the market exhibits moderate concentration with several key players commanding significant shares, it's experiencing intensified competition from smaller entrants, especially within the rapid diagnostic test (RDT) segment. This dynamic landscape is influenced by several key factors:
- Market Share Dynamics: While precise figures are commercially sensitive, BioMerieux SA and Abbott Laboratories are established leaders, holding substantial market shares. Other major players like Thermo Fisher Scientific and Siemens Healthineers also contribute significantly. A considerable portion of the market, however, is comprised of numerous smaller companies, reflecting the sector's competitive nature and potential for disruption.
- Innovation Drivers: The demand for faster, more precise, and cost-effective diagnostic tools, combined with the persistent high prevalence of malaria in endemic regions, is a powerful catalyst for innovation. This is particularly evident in the burgeoning development of advanced molecular diagnostics and point-of-care testing technologies, promising improved accuracy and accessibility.
- Regulatory Landscape and Harmonization: Navigating the diverse and often stringent regulatory requirements for diagnostic devices across different geographical regions presents a significant challenge. Harmonization of these frameworks is crucial to facilitate market entry and streamline product approvals, ultimately fostering broader access to diagnostics.
- Product Substitutes and Complementary Approaches: While no direct substitutes for malaria diagnostics exist, indirect influences on market demand arise from alternative disease control strategies, such as comprehensive vector control programs. The success of these complementary approaches can impact the overall demand for diagnostic tools.
- Evolving End-User Needs and Preferences: The growing adoption of rapid diagnostic tests (RDTs), particularly in resource-constrained settings, is a key driver of market growth. The trend towards decentralized testing, enabling diagnosis closer to patients, further enhances accessibility and efficiency.
- M&A Activity and Strategic Consolidation: The Malaria Diagnostics industry has witnessed a considerable amount of M&A activity in recent years, averaging approximately xx deals annually over the past five years. These strategic transactions reflect efforts to consolidate market share, acquire innovative technologies, and expand geographic reach, underscoring the competitive intensity and pursuit of growth.
Malaria Diagnostics Industry Industry Trends & Analysis
The Malaria Diagnostics market is witnessing significant growth, driven by factors such as increasing prevalence of malaria, particularly in Sub-Saharan Africa, rising investments in healthcare infrastructure in developing nations, and ongoing technological advancements. The market is projected to experience a Compound Annual Growth Rate (CAGR) of xx% during the forecast period (2025-2033).
Market penetration of molecular diagnostics remains relatively low compared to RDTs, but is expected to increase due to its higher accuracy and ability to detect drug resistance. Consumer preference leans towards rapid, easy-to-use, and cost-effective diagnostic solutions, driving demand for RDTs. However, the need for improved accuracy and wider availability of molecular tests is influencing technological advancements and fostering competition among various testing modalities. The continuous rise in malaria cases, especially in resource-limited regions, contributes significantly to market growth.
Leading Markets & Segments in Malaria Diagnostics Industry
Sub-Saharan Africa represents the dominant region for malaria diagnostics, driven by high disease prevalence and increased investments in healthcare infrastructure. India and other Southeast Asian countries also constitute significant markets.
Technology Segments:
- Rapid Diagnostic Tests (RDTs): RDTs dominate the market due to their affordability, ease of use, and portability. Key drivers include increased funding for malaria control programs and growing awareness of the need for rapid diagnosis in remote areas.
- Microscopic Diagnostics: Microscopic diagnosis continues to be prevalent, especially in resource-limited settings, although it is being gradually replaced by RDTs and molecular diagnostics.
- Molecular Diagnostics: This segment shows significant growth potential, driven by the need for increased accuracy and the detection of drug resistance. Increased access to advanced diagnostic tools and trained personnel is driving the adoption of this technology.
- Clinical Diagnostics: This segment includes various laboratory tests used for confirmation and detailed analysis of malaria infections. Its adoption is linked to the increased availability of sophisticated laboratories and healthcare facilities.
- Other Technologies: This category encompasses newer diagnostic technologies that are under development or at an early stage of adoption.
Malaria Diagnostics Industry Product Developments
Recent product innovations focus on improving the accuracy, sensitivity, and speed of malaria diagnosis. This includes the development of novel RDTs with enhanced performance characteristics, advanced molecular diagnostic platforms enabling rapid detection of multiple malaria species and drug resistance markers, and innovative point-of-care testing devices. These developments aim to improve diagnostic capabilities in resource-limited settings and aid in disease control efforts.
Key Drivers of Malaria Diagnostics Industry Growth
Several factors are driving growth in the Malaria Diagnostics Industry:
- Increased funding for malaria control programs: Initiatives like the Global Fund's investment of over USD 16 Billion significantly boosts the market.
- Technological advancements: Development of improved RDTs and molecular diagnostic technologies enhances accuracy and ease of use.
- Rising awareness of malaria's impact: Public health campaigns and increased awareness drive demand for improved diagnostics.
- Expanding healthcare infrastructure: Increased access to healthcare facilities facilitates wider adoption of diagnostic tests.
Challenges in the Malaria Diagnostics Industry Market
The industry faces several challenges:
- High cost of advanced technologies: Molecular diagnostics, although more accurate, can be prohibitively expensive in resource-limited settings.
- Supply chain disruptions: Global supply chain vulnerabilities can impact the availability of diagnostic materials and reagents.
- Maintaining cold chain: Maintaining the cold chain for some diagnostic kits poses a logistical challenge.
- Limited skilled personnel: The availability of trained healthcare professionals to operate and interpret sophisticated diagnostic tools remains a constraint.
Emerging Opportunities in Malaria Diagnostics Industry
The industry is poised for significant growth due to several factors:
- Development of new diagnostic platforms: Next-generation sequencing and other advanced molecular diagnostic technologies offer increased accuracy and speed.
- Strategic partnerships: Collaboration between public health organizations, diagnostic companies, and research institutions accelerates innovation and market access.
- Expansion into new markets: Targeting underserved populations in malaria-endemic regions offers significant growth potential.
Leading Players in the Malaria Diagnostics Industry Sector
- AdvaCare Pharma
- BioMerieux SA
- Bio-Rad Laboratories Inc
- Nikon Corporation
- Siemens Healthineers
- Abbott Laboratories
- Ortho Clinical Diagnostics
- Premier Medical Corporation Pvt Ltd
- Advy Chemical Pvt Ltd
- Zephyr Biomedicals
- Access Bio Inc
- Thermo Fisher Scientific
Key Milestones in Malaria Diagnostics Industry Industry
- June 2022: SC Johnson and the Global Fund partnered to eradicate malaria. The Global Fund's commitment of over USD 16 billion significantly impacts malaria control efforts, thereby indirectly stimulating the demand for diagnostics.
- February 2022: Kenya Medical Research Institute (KEMRI) launched the Plasmochek diagnostic kit, enhancing diagnostic capabilities in Kenya.
Strategic Outlook for Malaria Diagnostics Industry Market
The Malaria Diagnostics market is poised for substantial growth driven by technological advancements, increased funding for malaria control, and expanding access to healthcare in endemic regions. Strategic partnerships and investments in R&D will further accelerate market expansion. Focus on developing affordable, accurate, and easy-to-use diagnostic tools will be crucial for success in this market.
Malaria Diagnostics Industry Segmentation
-
1. Technology
- 1.1. Clinical Diagnostics
- 1.2. Microscopic Diagnostics
- 1.3. Rapid Diagnostic Tests (RDTs)
- 1.4. Molecular Diagnostics
- 1.5. Other Technologies
Malaria Diagnostics Industry Segmentation By Geography
-
1. Americas
- 1.1. Venezuela
- 1.2. Brazil
- 1.3. Colombia
- 1.4. Rest of the Americas
-
2. Europe
- 2.1. Germany
- 2.2. United Kingdom
- 2.3. France
- 2.4. Turkey
- 2.5. Spain
- 2.6. Rest of Europe
- 3. Asia Pacific
-
4. India
- 4.1. Myanmar
- 4.2. Indonesia
- 4.3. Pakistan
- 4.4. China
- 4.5. Papua New Guinea
- 4.6. Cambodia
- 4.7. Rest of Asia Pacific
-
5. Africa
- 5.1. Democratic Republic of Congo
- 5.2. Nigeria
- 5.3. Uganda
- 5.4. Rest of Africa
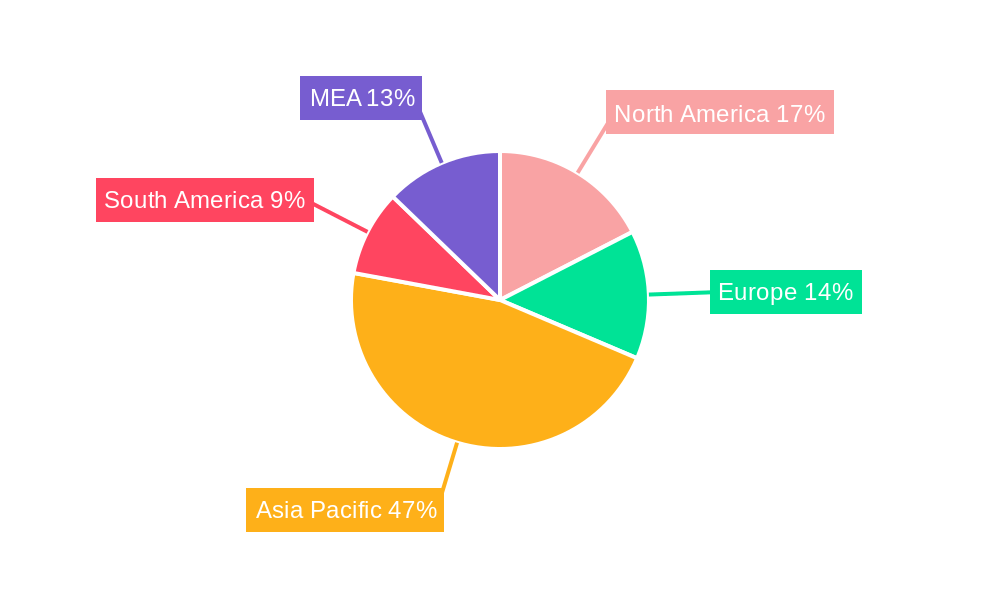
Malaria Diagnostics Industry Regional Market Share
Geographic Coverage of Malaria Diagnostics Industry
Malaria Diagnostics Industry REPORT HIGHLIGHTS
| Aspects | Details |
|---|---|
| Study Period | 2020-2034 |
| Base Year | 2025 |
| Estimated Year | 2026 |
| Forecast Period | 2026-2034 |
| Historical Period | 2020-2025 |
| Growth Rate | CAGR of 5.23% from 2020-2034 |
| Segmentation |
|
Table of Contents
- 1. Introduction
- 1.1. Research Scope
- 1.2. Market Segmentation
- 1.3. Research Objective
- 1.4. Definitions and Assumptions
- 2. Executive Summary
- 2.1. Market Snapshot
- 3. Market Dynamics
- 3.1. Market Drivers
- 3.2. Market Restrains
- 3.3. Market Trends
- 3.4. Market Opportunities
- 4. Market Factor Analysis
- 4.1. Porters Five Forces
- 4.1.1. Bargaining Power of Suppliers
- 4.1.2. Bargaining Power of Buyers
- 4.1.3. Threat of New Entrants
- 4.1.4. Threat of Substitutes
- 4.1.5. Competitive Rivalry
- 4.2. PESTEL analysis
- 4.3. BCG Analysis
- 4.3.1. Stars (High Growth, High Market Share)
- 4.3.2. Cash Cows (Low Growth, High Market Share)
- 4.3.3. Question Mark (High Growth, Low Market Share)
- 4.3.4. Dogs (Low Growth, Low Market Share)
- 4.4. Ansoff Matrix Analysis
- 4.5. Supply Chain Analysis
- 4.6. Regulatory Landscape
- 4.7. Current Market Potential and Opportunity Assessment (TAM–SAM–SOM Framework)
- 4.8. MDP Analyst Note
- 4.1. Porters Five Forces
- 5. Market Analysis, Insights and Forecast 2021-2033
- 5.1. Market Analysis, Insights and Forecast - by Technology
- 5.1.1. Clinical Diagnostics
- 5.1.2. Microscopic Diagnostics
- 5.1.3. Rapid Diagnostic Tests (RDTs)
- 5.1.4. Molecular Diagnostics
- 5.1.5. Other Technologies
- 5.2. Market Analysis, Insights and Forecast - by Region
- 5.2.1. Americas
- 5.2.2. Europe
- 5.2.3. Asia Pacific
- 5.2.4. India
- 5.2.5. Africa
- 5.1. Market Analysis, Insights and Forecast - by Technology
- 6. Global Malaria Diagnostics Industry Analysis, Insights and Forecast, 2021-2033
- 6.1. Market Analysis, Insights and Forecast - by Technology
- 6.1.1. Clinical Diagnostics
- 6.1.2. Microscopic Diagnostics
- 6.1.3. Rapid Diagnostic Tests (RDTs)
- 6.1.4. Molecular Diagnostics
- 6.1.5. Other Technologies
- 6.1. Market Analysis, Insights and Forecast - by Technology
- 7. Americas Malaria Diagnostics Industry Analysis, Insights and Forecast, 2020-2032
- 7.1. Market Analysis, Insights and Forecast - by Technology
- 7.1.1. Clinical Diagnostics
- 7.1.2. Microscopic Diagnostics
- 7.1.3. Rapid Diagnostic Tests (RDTs)
- 7.1.4. Molecular Diagnostics
- 7.1.5. Other Technologies
- 7.1. Market Analysis, Insights and Forecast - by Technology
- 8. Europe Malaria Diagnostics Industry Analysis, Insights and Forecast, 2020-2032
- 8.1. Market Analysis, Insights and Forecast - by Technology
- 8.1.1. Clinical Diagnostics
- 8.1.2. Microscopic Diagnostics
- 8.1.3. Rapid Diagnostic Tests (RDTs)
- 8.1.4. Molecular Diagnostics
- 8.1.5. Other Technologies
- 8.1. Market Analysis, Insights and Forecast - by Technology
- 9. Asia Pacific Malaria Diagnostics Industry Analysis, Insights and Forecast, 2020-2032
- 9.1. Market Analysis, Insights and Forecast - by Technology
- 9.1.1. Clinical Diagnostics
- 9.1.2. Microscopic Diagnostics
- 9.1.3. Rapid Diagnostic Tests (RDTs)
- 9.1.4. Molecular Diagnostics
- 9.1.5. Other Technologies
- 9.1. Market Analysis, Insights and Forecast - by Technology
- 10. India Malaria Diagnostics Industry Analysis, Insights and Forecast, 2020-2032
- 10.1. Market Analysis, Insights and Forecast - by Technology
- 10.1.1. Clinical Diagnostics
- 10.1.2. Microscopic Diagnostics
- 10.1.3. Rapid Diagnostic Tests (RDTs)
- 10.1.4. Molecular Diagnostics
- 10.1.5. Other Technologies
- 10.1. Market Analysis, Insights and Forecast - by Technology
- 11. Africa Malaria Diagnostics Industry Analysis, Insights and Forecast, 2020-2032
- 11.1. Market Analysis, Insights and Forecast - by Technology
- 11.1.1. Clinical Diagnostics
- 11.1.2. Microscopic Diagnostics
- 11.1.3. Rapid Diagnostic Tests (RDTs)
- 11.1.4. Molecular Diagnostics
- 11.1.5. Other Technologies
- 11.1. Market Analysis, Insights and Forecast - by Technology
- 12. Competitive Analysis
- 12.1. Company Profiles
- 12.1.1 AdvaCare Pharma*List Not Exhaustive
- 12.1.1.1. Company Overview
- 12.1.1.2. Products
- 12.1.1.3. Company Financials
- 12.1.1.4. SWOT Analysis
- 12.1.2 BioMerieux SA
- 12.1.2.1. Company Overview
- 12.1.2.2. Products
- 12.1.2.3. Company Financials
- 12.1.2.4. SWOT Analysis
- 12.1.3 Bio-Rad Laboratories Inc
- 12.1.3.1. Company Overview
- 12.1.3.2. Products
- 12.1.3.3. Company Financials
- 12.1.3.4. SWOT Analysis
- 12.1.4 Nikon Corporation
- 12.1.4.1. Company Overview
- 12.1.4.2. Products
- 12.1.4.3. Company Financials
- 12.1.4.4. SWOT Analysis
- 12.1.5 Siemens Healthineers
- 12.1.5.1. Company Overview
- 12.1.5.2. Products
- 12.1.5.3. Company Financials
- 12.1.5.4. SWOT Analysis
- 12.1.6 Abbott Laboratories
- 12.1.6.1. Company Overview
- 12.1.6.2. Products
- 12.1.6.3. Company Financials
- 12.1.6.4. SWOT Analysis
- 12.1.7 Ortho Clinical Diagnostics
- 12.1.7.1. Company Overview
- 12.1.7.2. Products
- 12.1.7.3. Company Financials
- 12.1.7.4. SWOT Analysis
- 12.1.8 Premier Medical Corporation Pvt Ltd
- 12.1.8.1. Company Overview
- 12.1.8.2. Products
- 12.1.8.3. Company Financials
- 12.1.8.4. SWOT Analysis
- 12.1.9 Advy Chemical Pvt Ltd
- 12.1.9.1. Company Overview
- 12.1.9.2. Products
- 12.1.9.3. Company Financials
- 12.1.9.4. SWOT Analysis
- 12.1.10 Zephyr Biomedicals
- 12.1.10.1. Company Overview
- 12.1.10.2. Products
- 12.1.10.3. Company Financials
- 12.1.10.4. SWOT Analysis
- 12.1.11 Access Bio Inc
- 12.1.11.1. Company Overview
- 12.1.11.2. Products
- 12.1.11.3. Company Financials
- 12.1.11.4. SWOT Analysis
- 12.1.12 Thermo Fisher Scientific
- 12.1.12.1. Company Overview
- 12.1.12.2. Products
- 12.1.12.3. Company Financials
- 12.1.12.4. SWOT Analysis
- 12.1.1 AdvaCare Pharma*List Not Exhaustive
- 12.2. Market Entropy
- 12.2.1 Company's Key Areas Served
- 12.2.2 Recent Developments
- 12.3. Company Market Share Analysis 2025
- 12.3.1 Top 5 Companies Market Share Analysis
- 12.3.2 Top 3 Companies Market Share Analysis
- 12.4. List of Potential Customers
- 13. Research Methodology
List of Figures
- Figure 1: Global Malaria Diagnostics Industry Revenue Breakdown (Million, %) by Region 2025 & 2033
- Figure 2: Americas Malaria Diagnostics Industry Revenue (Million), by Technology 2025 & 2033
- Figure 3: Americas Malaria Diagnostics Industry Revenue Share (%), by Technology 2025 & 2033
- Figure 4: Americas Malaria Diagnostics Industry Revenue (Million), by Country 2025 & 2033
- Figure 5: Americas Malaria Diagnostics Industry Revenue Share (%), by Country 2025 & 2033
- Figure 6: Europe Malaria Diagnostics Industry Revenue (Million), by Technology 2025 & 2033
- Figure 7: Europe Malaria Diagnostics Industry Revenue Share (%), by Technology 2025 & 2033
- Figure 8: Europe Malaria Diagnostics Industry Revenue (Million), by Country 2025 & 2033
- Figure 9: Europe Malaria Diagnostics Industry Revenue Share (%), by Country 2025 & 2033
- Figure 10: Asia Pacific Malaria Diagnostics Industry Revenue (Million), by Technology 2025 & 2033
- Figure 11: Asia Pacific Malaria Diagnostics Industry Revenue Share (%), by Technology 2025 & 2033
- Figure 12: Asia Pacific Malaria Diagnostics Industry Revenue (Million), by Country 2025 & 2033
- Figure 13: Asia Pacific Malaria Diagnostics Industry Revenue Share (%), by Country 2025 & 2033
- Figure 14: India Malaria Diagnostics Industry Revenue (Million), by Technology 2025 & 2033
- Figure 15: India Malaria Diagnostics Industry Revenue Share (%), by Technology 2025 & 2033
- Figure 16: India Malaria Diagnostics Industry Revenue (Million), by Country 2025 & 2033
- Figure 17: India Malaria Diagnostics Industry Revenue Share (%), by Country 2025 & 2033
- Figure 18: Africa Malaria Diagnostics Industry Revenue (Million), by Technology 2025 & 2033
- Figure 19: Africa Malaria Diagnostics Industry Revenue Share (%), by Technology 2025 & 2033
- Figure 20: Africa Malaria Diagnostics Industry Revenue (Million), by Country 2025 & 2033
- Figure 21: Africa Malaria Diagnostics Industry Revenue Share (%), by Country 2025 & 2033
List of Tables
- Table 1: Global Malaria Diagnostics Industry Revenue Million Forecast, by Technology 2020 & 2033
- Table 2: Global Malaria Diagnostics Industry Revenue Million Forecast, by Region 2020 & 2033
- Table 3: Global Malaria Diagnostics Industry Revenue Million Forecast, by Technology 2020 & 2033
- Table 4: Global Malaria Diagnostics Industry Revenue Million Forecast, by Country 2020 & 2033
- Table 5: Venezuela Malaria Diagnostics Industry Revenue (Million) Forecast, by Application 2020 & 2033
- Table 6: Brazil Malaria Diagnostics Industry Revenue (Million) Forecast, by Application 2020 & 2033
- Table 7: Colombia Malaria Diagnostics Industry Revenue (Million) Forecast, by Application 2020 & 2033
- Table 8: Rest of the Americas Malaria Diagnostics Industry Revenue (Million) Forecast, by Application 2020 & 2033
- Table 9: Global Malaria Diagnostics Industry Revenue Million Forecast, by Technology 2020 & 2033
- Table 10: Global Malaria Diagnostics Industry Revenue Million Forecast, by Country 2020 & 2033
- Table 11: Germany Malaria Diagnostics Industry Revenue (Million) Forecast, by Application 2020 & 2033
- Table 12: United Kingdom Malaria Diagnostics Industry Revenue (Million) Forecast, by Application 2020 & 2033
- Table 13: France Malaria Diagnostics Industry Revenue (Million) Forecast, by Application 2020 & 2033
- Table 14: Turkey Malaria Diagnostics Industry Revenue (Million) Forecast, by Application 2020 & 2033
- Table 15: Spain Malaria Diagnostics Industry Revenue (Million) Forecast, by Application 2020 & 2033
- Table 16: Rest of Europe Malaria Diagnostics Industry Revenue (Million) Forecast, by Application 2020 & 2033
- Table 17: Global Malaria Diagnostics Industry Revenue Million Forecast, by Technology 2020 & 2033
- Table 18: Global Malaria Diagnostics Industry Revenue Million Forecast, by Country 2020 & 2033
- Table 19: Global Malaria Diagnostics Industry Revenue Million Forecast, by Technology 2020 & 2033
- Table 20: Global Malaria Diagnostics Industry Revenue Million Forecast, by Country 2020 & 2033
- Table 21: Myanmar Malaria Diagnostics Industry Revenue (Million) Forecast, by Application 2020 & 2033
- Table 22: Indonesia Malaria Diagnostics Industry Revenue (Million) Forecast, by Application 2020 & 2033
- Table 23: Pakistan Malaria Diagnostics Industry Revenue (Million) Forecast, by Application 2020 & 2033
- Table 24: China Malaria Diagnostics Industry Revenue (Million) Forecast, by Application 2020 & 2033
- Table 25: Papua New Guinea Malaria Diagnostics Industry Revenue (Million) Forecast, by Application 2020 & 2033
- Table 26: Cambodia Malaria Diagnostics Industry Revenue (Million) Forecast, by Application 2020 & 2033
- Table 27: Rest of Asia Pacific Malaria Diagnostics Industry Revenue (Million) Forecast, by Application 2020 & 2033
- Table 28: Global Malaria Diagnostics Industry Revenue Million Forecast, by Technology 2020 & 2033
- Table 29: Global Malaria Diagnostics Industry Revenue Million Forecast, by Country 2020 & 2033
- Table 30: Democratic Republic of Congo Malaria Diagnostics Industry Revenue (Million) Forecast, by Application 2020 & 2033
- Table 31: Nigeria Malaria Diagnostics Industry Revenue (Million) Forecast, by Application 2020 & 2033
- Table 32: Uganda Malaria Diagnostics Industry Revenue (Million) Forecast, by Application 2020 & 2033
- Table 33: Rest of Africa Malaria Diagnostics Industry Revenue (Million) Forecast, by Application 2020 & 2033
Frequently Asked Questions
1. What is the projected Compound Annual Growth Rate (CAGR) of the Malaria Diagnostics Industry?
The projected CAGR is approximately 5.23%.
2. Which companies are prominent players in the Malaria Diagnostics Industry?
Key companies in the market include AdvaCare Pharma*List Not Exhaustive, BioMerieux SA, Bio-Rad Laboratories Inc, Nikon Corporation, Siemens Healthineers, Abbott Laboratories, Ortho Clinical Diagnostics, Premier Medical Corporation Pvt Ltd, Advy Chemical Pvt Ltd, Zephyr Biomedicals, Access Bio Inc, Thermo Fisher Scientific.
3. What are the main segments of the Malaria Diagnostics Industry?
The market segments include Technology.
4. Can you provide details about the market size?
The market size is estimated to be USD 0.86 Million as of 2022.
5. What are some drivers contributing to market growth?
Growing Demand for Diagnostic Tools in Malaria-endemic Regions; Increasing Technological Advancements and Efficient Diagnostics; Scale-up of Rapid Diagnostic Tests and Universal Access to Diagnosis.
6. What are the notable trends driving market growth?
Microscopic Diagnostics is Expected to Hold the Highest Market Share in the Technology Segment.
7. Are there any restraints impacting market growth?
Increasing Number of Malaria-free Countries; Rising Demand for Low-cost Diagnostic Tools.
8. Can you provide examples of recent developments in the market?
In June 2022, SC Johnson and Global Fund partnered to eradicate malaria. The Global Fund provides 56% of all international financing for malaria programs (39% of total available resources) and invested more than USD 16 billion in malaria control programs to date.
9. What pricing options are available for accessing the report?
Pricing options include single-user, multi-user, and enterprise licenses priced at USD 4750, USD 5250, and USD 8750 respectively.
10. Is the market size provided in terms of value or volume?
The market size is provided in terms of value, measured in Million.
11. Are there any specific market keywords associated with the report?
Yes, the market keyword associated with the report is "Malaria Diagnostics Industry," which aids in identifying and referencing the specific market segment covered.
12. How do I determine which pricing option suits my needs best?
The pricing options vary based on user requirements and access needs. Individual users may opt for single-user licenses, while businesses requiring broader access may choose multi-user or enterprise licenses for cost-effective access to the report.
13. Are there any additional resources or data provided in the Malaria Diagnostics Industry report?
While the report offers comprehensive insights, it's advisable to review the specific contents or supplementary materials provided to ascertain if additional resources or data are available.
14. How can I stay updated on further developments or reports in the Malaria Diagnostics Industry?
To stay informed about further developments, trends, and reports in the Malaria Diagnostics Industry, consider subscribing to industry newsletters, following relevant companies and organizations, or regularly checking reputable industry news sources and publications.
Methodology
Step 1 - Identification of Relevant Samples Size from Population Database


Step 2 - Approaches for Defining Global Market Size (Value, Volume* & Price*)

Note*: In applicable scenarios
Step 3 - Data Sources
Primary Research
- Web Analytics
- Survey Reports
- Research Institute
- Latest Research Reports
- Opinion Leaders
Secondary Research
- Annual Reports
- White Paper
- Latest Press Release
- Industry Association
- Paid Database
- Investor Presentations

Step 4 - Data Triangulation
Involves using different sources of information in order to increase the validity of a study
These sources are likely to be stakeholders in a program - participants, other researchers, program staff, other community members, and so on.
Then we put all data in single framework & apply various statistical tools to find out the dynamic on the market.
During the analysis stage, feedback from the stakeholder groups would be compared to determine areas of agreement as well as areas of divergence