

Key Insights
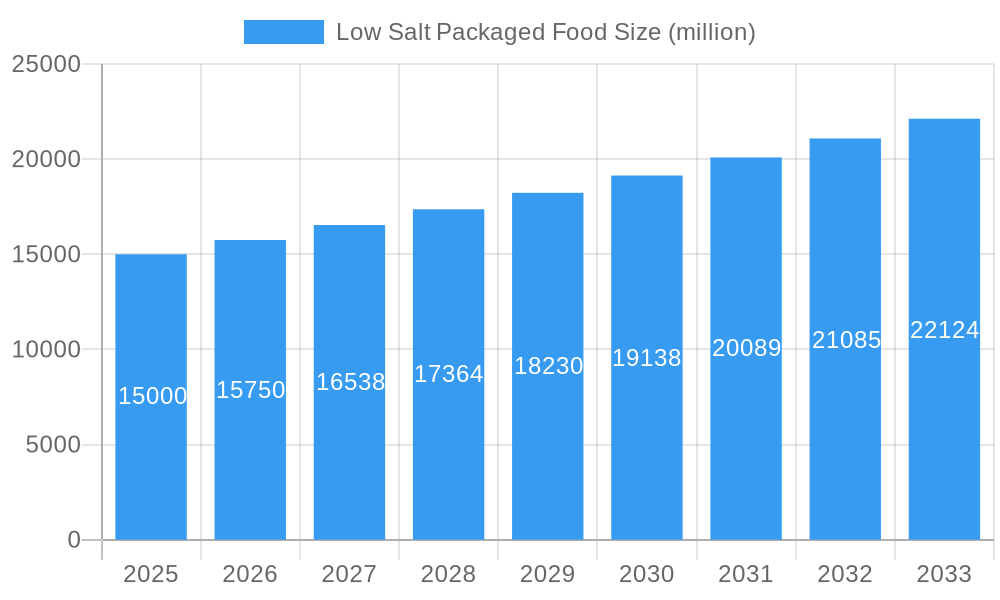
The global low-salt packaged food market is experiencing robust growth, driven by increasing health consciousness among consumers and a rising prevalence of hypertension and other cardiovascular diseases. The market's expansion is fueled by several key trends, including the increasing demand for healthier food options, the growing popularity of home cooking and meal prepping with convenient, low-sodium ingredients, and the innovative product development by major food manufacturers to cater to this expanding demand. Major players like PepsiCo, Kraft Heinz, and Nestle are actively investing in research and development to create palatable low-sodium alternatives to traditional high-salt products. While regulatory pressures and consumer perception challenges related to taste remain hurdles, the market's overall trajectory is positive, bolstered by consistent product innovation and expanding distribution channels through both traditional retail and e-commerce platforms. We project a market size of approximately $15 billion in 2025, with a compound annual growth rate (CAGR) of 5% from 2025 to 2033, reaching an estimated $23 billion by 2033. This growth will be driven by continued demand in developed regions such as North America and Europe, coupled with emerging market penetration in regions like Asia-Pacific and Latin America.
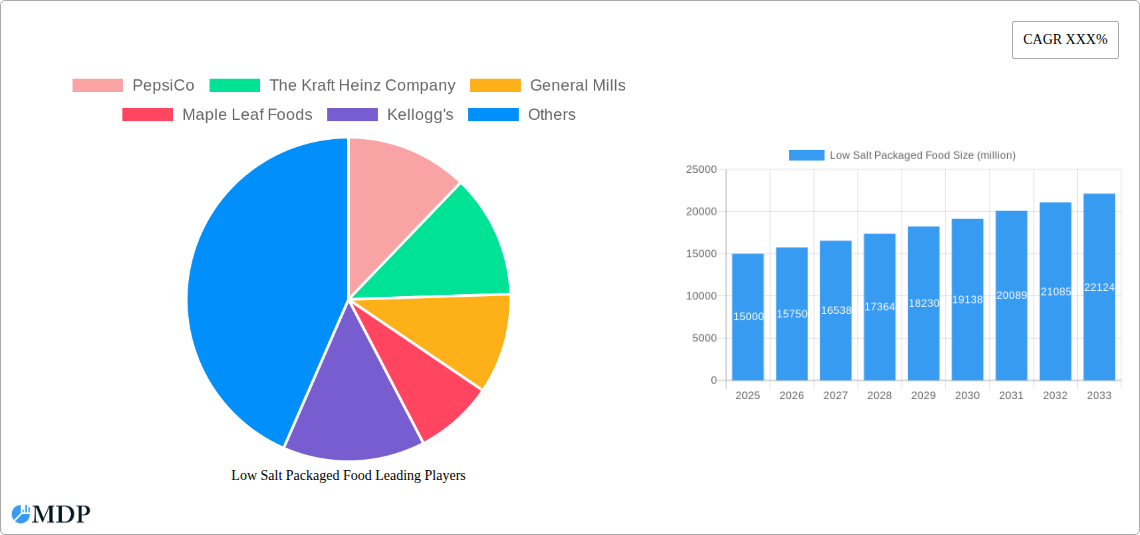
Low Salt Packaged Food Market Size (In Billion)
This growth, however, is not without its challenges. Maintaining consistent taste and texture in low-sodium products remains a key obstacle. Moreover, consumer education and awareness about the health benefits of reduced sodium intake are crucial to further accelerating market growth. Competition within the segment is intense, with established food giants competing alongside emerging brands specializing in health-conscious products. Successful market penetration will depend on innovative product formulations, strategic marketing that highlights health benefits, and effective distribution strategies to reach diverse consumer demographics. Segmentation within the market is likely driven by product type (e.g., snacks, ready meals, canned goods), distribution channel (e.g., retail, food service), and consumer demographics (e.g., age, income). Strategic partnerships and mergers and acquisitions will also likely shape the industry landscape in the coming years.
Low Salt Packaged Food Company Market Share
Low Salt Packaged Food Market Report: 2019-2033 - A Comprehensive Analysis
This comprehensive report provides a detailed analysis of the low salt packaged food market, projecting a significant growth trajectory over the forecast period (2025-2033). With a study period spanning 2019-2033, a base year of 2025, and an estimated year of 2025, this report offers invaluable insights for industry stakeholders, investors, and businesses seeking to navigate this evolving market landscape. The global market is projected to reach xx million by 2033, driven by increasing health consciousness and stringent regulatory frameworks.
Low Salt Packaged Food Market Dynamics & Concentration
This section analyzes the market's competitive landscape, highlighting key dynamics shaping its growth. We examine market concentration, identifying the major players and their respective market shares. The report also explores innovation drivers, including technological advancements in food processing and preservation. Regulatory frameworks, such as sodium reduction targets implemented by various governments, are also assessed for their impact on market dynamics. Further analysis includes an examination of product substitutes, evolving consumer preferences for healthier options, and the influence of mergers and acquisitions (M&A) activities on market consolidation.
- Market Share: PepsiCo holds an estimated xx% market share, followed by The Kraft Heinz Company with xx%, General Mills with xx%, and other key players with varying percentages.
- M&A Activity: The report documents xx M&A deals within the low salt packaged food sector during the historical period (2019-2024), indicating a trend of consolidation.
- Innovation Drivers: Key drivers include advancements in taste modulation technologies, enabling the development of low-sodium products that retain flavor.
- Regulatory Impact: Stringent sodium reduction targets implemented by various governments are driving innovation and shaping product development strategies.
Low Salt Packaged Food Industry Trends & Analysis
This section delves into the prevailing industry trends impacting the low salt packaged food market, offering a comprehensive perspective on its growth trajectory. We analyze market growth drivers, including the rising prevalence of hypertension and related health concerns, increasing consumer awareness of health benefits, and the growing demand for healthier food options. Technological disruptions, such as the development of novel food processing techniques, are also explored. The report provides a detailed examination of consumer preferences, shifts in dietary habits, and competitive dynamics influencing market share and profitability. This detailed analysis is accompanied by quantifiable metrics, including Compound Annual Growth Rate (CAGR) and market penetration rates, providing a clear picture of market performance. The predicted CAGR for the forecast period is xx%. Market penetration is expected to increase from xx% in 2025 to xx% by 2033.
Leading Markets & Segments in Low Salt Packaged Food
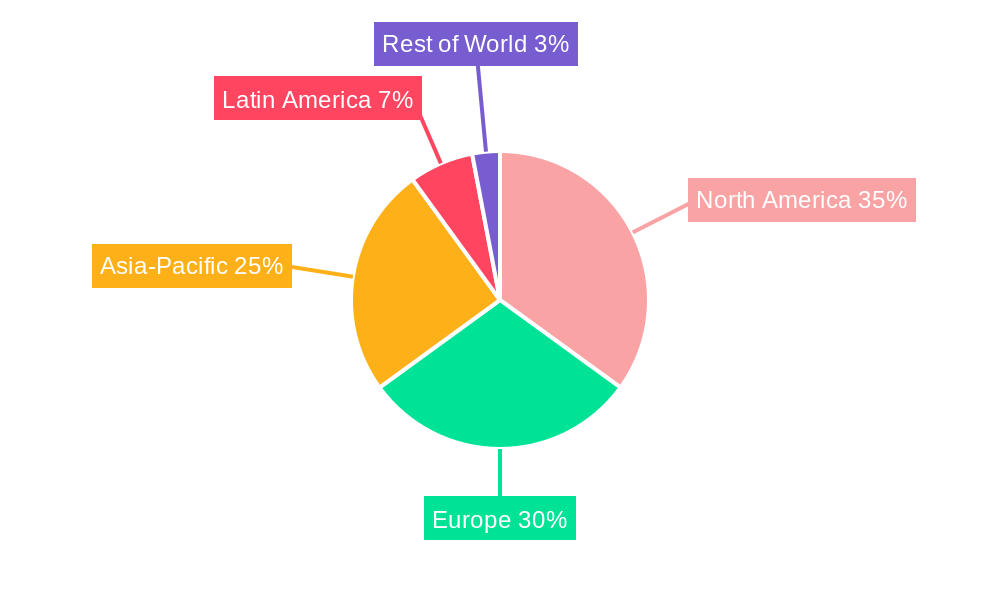
This section identifies the leading geographical markets and product segments within the low salt packaged food market. Dominant regions and countries are analyzed for their market size, growth drivers, and future potential. Key factors influencing market dominance are outlined, using bullet points to highlight economic policies, infrastructure development, and consumer behaviour.
- Key Drivers in Dominant Regions:
- North America: Strong consumer demand for health-conscious food options, coupled with robust regulatory frameworks promoting sodium reduction.
- Europe: High prevalence of hypertension and related health issues, driving demand for low-sodium products.
- Asia-Pacific: Rising disposable incomes and increasing awareness of health benefits contribute to market growth.
A detailed paragraph analysis of each dominant market will follow in the full report, providing further insight into market share, competitive landscape, and growth potential.
Low Salt Packaged Food Product Developments
Recent years have witnessed significant innovations in low salt packaged food products. Manufacturers are employing advanced taste modulation technologies to produce products that maintain flavor while minimizing sodium content. These innovations include the use of natural flavor enhancers, such as spices and herbs, to compensate for the reduction in salt. This technological trend allows for the development of palatable low-sodium options that meet consumer demands for both health and taste, resulting in improved market fit and competitive advantage.
Key Drivers of Low Salt Packaged Food Growth
Several factors are propelling the growth of the low salt packaged food market. Technological advancements, as described above, are crucial in addressing the challenge of reducing salt without compromising taste. Economic factors, such as increasing disposable incomes in emerging economies, are also contributing to market expansion. Furthermore, government regulations promoting sodium reduction initiatives are creating significant market drivers.
Challenges in the Low Salt Packaged Food Market
Despite the promising growth trajectory, the low salt packaged food market faces several challenges. Regulatory hurdles, including stringent labeling requirements and complex compliance processes, can pose significant obstacles. Supply chain issues, such as sourcing sustainable and high-quality ingredients, present further complexity. Moreover, intense competition among established players and new entrants creates a dynamic and challenging market environment impacting profitability. For example, xx million in losses were reported due to ingredient sourcing issues in 2024.
Emerging Opportunities in Low Salt Packaged Food
The low salt packaged food market offers several promising opportunities for long-term growth. Further technological breakthroughs in taste modulation and ingredient formulation will open new avenues for product innovation. Strategic partnerships between food manufacturers and healthcare providers can enhance market reach and promote consumer adoption. Expansion into emerging markets with growing health-conscious populations presents significant potential for market growth.
Leading Players in the Low Salt Packaged Food Sector
- PepsiCo
- The Kraft Heinz Company
- General Mills
- Maple Leaf Foods
- Kellogg's
- JBS
- Tesco
- Tyson Foods
- Nestle
- ConAgra Foods
- Hormel Foods
- Smithfield Foods
- Cargill
Key Milestones in Low Salt Packaged Food Industry
- 2020: Several major food companies announced ambitious sodium reduction targets.
- 2021: New regulations on sodium content in packaged foods were implemented in several countries.
- 2022: Significant advancements in taste modulation technology were achieved.
- 2023: Launch of several new low-sodium product lines by major food companies.
- 2024: Increased M&A activity in the sector, driving market consolidation.
Strategic Outlook for Low Salt Packaged Food Market
The low salt packaged food market is poised for continued expansion driven by increasing health awareness, technological innovation, and favorable regulatory environments. Strategic opportunities include developing innovative products tailored to specific consumer preferences, expanding into untapped markets, and establishing strategic partnerships to enhance market penetration. This report serves as a valuable tool for businesses seeking to capitalize on the considerable growth potential within this dynamic market.
Low Salt Packaged Food Segmentation
-
1. Application
- 1.1. Offline
- 1.2. Online
-
2. Type
- 2.1. Meat
- 2.2. Poultry
- 2.3. Seafood
- 2.4. Snacks
- 2.5. Others
Low Salt Packaged Food Segmentation By Geography
-
1. North America
- 1.1. United States
- 1.2. Canada
- 1.3. Mexico
-
2. South America
- 2.1. Brazil
- 2.2. Argentina
- 2.3. Rest of South America
-
3. Europe
- 3.1. United Kingdom
- 3.2. Germany
- 3.3. France
- 3.4. Italy
- 3.5. Spain
- 3.6. Russia
- 3.7. Benelux
- 3.8. Nordics
- 3.9. Rest of Europe
-
4. Middle East & Africa
- 4.1. Turkey
- 4.2. Israel
- 4.3. GCC
- 4.4. North Africa
- 4.5. South Africa
- 4.6. Rest of Middle East & Africa
-
5. Asia Pacific
- 5.1. China
- 5.2. India
- 5.3. Japan
- 5.4. South Korea
- 5.5. ASEAN
- 5.6. Oceania
- 5.7. Rest of Asia Pacific
Low Salt Packaged Food Regional Market Share
Geographic Coverage of Low Salt Packaged Food
Low Salt Packaged Food REPORT HIGHLIGHTS
| Aspects | Details |
|---|---|
| Study Period | 2020-2034 |
| Base Year | 2025 |
| Estimated Year | 2026 |
| Forecast Period | 2026-2034 |
| Historical Period | 2020-2025 |
| Growth Rate | CAGR of XXX% from 2020-2034 |
| Segmentation |
|
Table of Contents
- 1. Introduction
- 1.1. Research Scope
- 1.2. Market Segmentation
- 1.3. Research Methodology
- 1.4. Definitions and Assumptions
- 2. Executive Summary
- 2.1. Introduction
- 3. Market Dynamics
- 3.1. Introduction
- 3.2. Market Drivers
- 3.3. Market Restrains
- 3.4. Market Trends
- 4. Market Factor Analysis
- 4.1. Porters Five Forces
- 4.2. Supply/Value Chain
- 4.3. PESTEL analysis
- 4.4. Market Entropy
- 4.5. Patent/Trademark Analysis
- 5. Global Low Salt Packaged Food Analysis, Insights and Forecast, 2020-2032
- 5.1. Market Analysis, Insights and Forecast - by Application
- 5.1.1. Offline
- 5.1.2. Online
- 5.2. Market Analysis, Insights and Forecast - by Type
- 5.2.1. Meat
- 5.2.2. Poultry
- 5.2.3. Seafood
- 5.2.4. Snacks
- 5.2.5. Others
- 5.3. Market Analysis, Insights and Forecast - by Region
- 5.3.1. North America
- 5.3.2. South America
- 5.3.3. Europe
- 5.3.4. Middle East & Africa
- 5.3.5. Asia Pacific
- 5.1. Market Analysis, Insights and Forecast - by Application
- 6. North America Low Salt Packaged Food Analysis, Insights and Forecast, 2020-2032
- 6.1. Market Analysis, Insights and Forecast - by Application
- 6.1.1. Offline
- 6.1.2. Online
- 6.2. Market Analysis, Insights and Forecast - by Type
- 6.2.1. Meat
- 6.2.2. Poultry
- 6.2.3. Seafood
- 6.2.4. Snacks
- 6.2.5. Others
- 6.1. Market Analysis, Insights and Forecast - by Application
- 7. South America Low Salt Packaged Food Analysis, Insights and Forecast, 2020-2032
- 7.1. Market Analysis, Insights and Forecast - by Application
- 7.1.1. Offline
- 7.1.2. Online
- 7.2. Market Analysis, Insights and Forecast - by Type
- 7.2.1. Meat
- 7.2.2. Poultry
- 7.2.3. Seafood
- 7.2.4. Snacks
- 7.2.5. Others
- 7.1. Market Analysis, Insights and Forecast - by Application
- 8. Europe Low Salt Packaged Food Analysis, Insights and Forecast, 2020-2032
- 8.1. Market Analysis, Insights and Forecast - by Application
- 8.1.1. Offline
- 8.1.2. Online
- 8.2. Market Analysis, Insights and Forecast - by Type
- 8.2.1. Meat
- 8.2.2. Poultry
- 8.2.3. Seafood
- 8.2.4. Snacks
- 8.2.5. Others
- 8.1. Market Analysis, Insights and Forecast - by Application
- 9. Middle East & Africa Low Salt Packaged Food Analysis, Insights and Forecast, 2020-2032
- 9.1. Market Analysis, Insights and Forecast - by Application
- 9.1.1. Offline
- 9.1.2. Online
- 9.2. Market Analysis, Insights and Forecast - by Type
- 9.2.1. Meat
- 9.2.2. Poultry
- 9.2.3. Seafood
- 9.2.4. Snacks
- 9.2.5. Others
- 9.1. Market Analysis, Insights and Forecast - by Application
- 10. Asia Pacific Low Salt Packaged Food Analysis, Insights and Forecast, 2020-2032
- 10.1. Market Analysis, Insights and Forecast - by Application
- 10.1.1. Offline
- 10.1.2. Online
- 10.2. Market Analysis, Insights and Forecast - by Type
- 10.2.1. Meat
- 10.2.2. Poultry
- 10.2.3. Seafood
- 10.2.4. Snacks
- 10.2.5. Others
- 10.1. Market Analysis, Insights and Forecast - by Application
- 11. Competitive Analysis
- 11.1. Global Market Share Analysis 2025
- 11.2. Company Profiles
- 11.2.1 PepsiCo
- 11.2.1.1. Overview
- 11.2.1.2. Products
- 11.2.1.3. SWOT Analysis
- 11.2.1.4. Recent Developments
- 11.2.1.5. Financials (Based on Availability)
- 11.2.2 The Kraft Heinz Company
- 11.2.2.1. Overview
- 11.2.2.2. Products
- 11.2.2.3. SWOT Analysis
- 11.2.2.4. Recent Developments
- 11.2.2.5. Financials (Based on Availability)
- 11.2.3 General Mills
- 11.2.3.1. Overview
- 11.2.3.2. Products
- 11.2.3.3. SWOT Analysis
- 11.2.3.4. Recent Developments
- 11.2.3.5. Financials (Based on Availability)
- 11.2.4 Maple Leaf Foods
- 11.2.4.1. Overview
- 11.2.4.2. Products
- 11.2.4.3. SWOT Analysis
- 11.2.4.4. Recent Developments
- 11.2.4.5. Financials (Based on Availability)
- 11.2.5 Kellogg's
- 11.2.5.1. Overview
- 11.2.5.2. Products
- 11.2.5.3. SWOT Analysis
- 11.2.5.4. Recent Developments
- 11.2.5.5. Financials (Based on Availability)
- 11.2.6 JBS
- 11.2.6.1. Overview
- 11.2.6.2. Products
- 11.2.6.3. SWOT Analysis
- 11.2.6.4. Recent Developments
- 11.2.6.5. Financials (Based on Availability)
- 11.2.7 Tesco
- 11.2.7.1. Overview
- 11.2.7.2. Products
- 11.2.7.3. SWOT Analysis
- 11.2.7.4. Recent Developments
- 11.2.7.5. Financials (Based on Availability)
- 11.2.8 Tyson Foods
- 11.2.8.1. Overview
- 11.2.8.2. Products
- 11.2.8.3. SWOT Analysis
- 11.2.8.4. Recent Developments
- 11.2.8.5. Financials (Based on Availability)
- 11.2.9 Nestle
- 11.2.9.1. Overview
- 11.2.9.2. Products
- 11.2.9.3. SWOT Analysis
- 11.2.9.4. Recent Developments
- 11.2.9.5. Financials (Based on Availability)
- 11.2.10 ConAgra Foods
- 11.2.10.1. Overview
- 11.2.10.2. Products
- 11.2.10.3. SWOT Analysis
- 11.2.10.4. Recent Developments
- 11.2.10.5. Financials (Based on Availability)
- 11.2.11 Hormel Foods
- 11.2.11.1. Overview
- 11.2.11.2. Products
- 11.2.11.3. SWOT Analysis
- 11.2.11.4. Recent Developments
- 11.2.11.5. Financials (Based on Availability)
- 11.2.12 Smithfield Foods
- 11.2.12.1. Overview
- 11.2.12.2. Products
- 11.2.12.3. SWOT Analysis
- 11.2.12.4. Recent Developments
- 11.2.12.5. Financials (Based on Availability)
- 11.2.13 Cargill
- 11.2.13.1. Overview
- 11.2.13.2. Products
- 11.2.13.3. SWOT Analysis
- 11.2.13.4. Recent Developments
- 11.2.13.5. Financials (Based on Availability)
- 11.2.1 PepsiCo
List of Figures
- Figure 1: Global Low Salt Packaged Food Revenue Breakdown (million, %) by Region 2025 & 2033
- Figure 2: Global Low Salt Packaged Food Volume Breakdown (K, %) by Region 2025 & 2033
- Figure 3: North America Low Salt Packaged Food Revenue (million), by Application 2025 & 2033
- Figure 4: North America Low Salt Packaged Food Volume (K), by Application 2025 & 2033
- Figure 5: North America Low Salt Packaged Food Revenue Share (%), by Application 2025 & 2033
- Figure 6: North America Low Salt Packaged Food Volume Share (%), by Application 2025 & 2033
- Figure 7: North America Low Salt Packaged Food Revenue (million), by Type 2025 & 2033
- Figure 8: North America Low Salt Packaged Food Volume (K), by Type 2025 & 2033
- Figure 9: North America Low Salt Packaged Food Revenue Share (%), by Type 2025 & 2033
- Figure 10: North America Low Salt Packaged Food Volume Share (%), by Type 2025 & 2033
- Figure 11: North America Low Salt Packaged Food Revenue (million), by Country 2025 & 2033
- Figure 12: North America Low Salt Packaged Food Volume (K), by Country 2025 & 2033
- Figure 13: North America Low Salt Packaged Food Revenue Share (%), by Country 2025 & 2033
- Figure 14: North America Low Salt Packaged Food Volume Share (%), by Country 2025 & 2033
- Figure 15: South America Low Salt Packaged Food Revenue (million), by Application 2025 & 2033
- Figure 16: South America Low Salt Packaged Food Volume (K), by Application 2025 & 2033
- Figure 17: South America Low Salt Packaged Food Revenue Share (%), by Application 2025 & 2033
- Figure 18: South America Low Salt Packaged Food Volume Share (%), by Application 2025 & 2033
- Figure 19: South America Low Salt Packaged Food Revenue (million), by Type 2025 & 2033
- Figure 20: South America Low Salt Packaged Food Volume (K), by Type 2025 & 2033
- Figure 21: South America Low Salt Packaged Food Revenue Share (%), by Type 2025 & 2033
- Figure 22: South America Low Salt Packaged Food Volume Share (%), by Type 2025 & 2033
- Figure 23: South America Low Salt Packaged Food Revenue (million), by Country 2025 & 2033
- Figure 24: South America Low Salt Packaged Food Volume (K), by Country 2025 & 2033
- Figure 25: South America Low Salt Packaged Food Revenue Share (%), by Country 2025 & 2033
- Figure 26: South America Low Salt Packaged Food Volume Share (%), by Country 2025 & 2033
- Figure 27: Europe Low Salt Packaged Food Revenue (million), by Application 2025 & 2033
- Figure 28: Europe Low Salt Packaged Food Volume (K), by Application 2025 & 2033
- Figure 29: Europe Low Salt Packaged Food Revenue Share (%), by Application 2025 & 2033
- Figure 30: Europe Low Salt Packaged Food Volume Share (%), by Application 2025 & 2033
- Figure 31: Europe Low Salt Packaged Food Revenue (million), by Type 2025 & 2033
- Figure 32: Europe Low Salt Packaged Food Volume (K), by Type 2025 & 2033
- Figure 33: Europe Low Salt Packaged Food Revenue Share (%), by Type 2025 & 2033
- Figure 34: Europe Low Salt Packaged Food Volume Share (%), by Type 2025 & 2033
- Figure 35: Europe Low Salt Packaged Food Revenue (million), by Country 2025 & 2033
- Figure 36: Europe Low Salt Packaged Food Volume (K), by Country 2025 & 2033
- Figure 37: Europe Low Salt Packaged Food Revenue Share (%), by Country 2025 & 2033
- Figure 38: Europe Low Salt Packaged Food Volume Share (%), by Country 2025 & 2033
- Figure 39: Middle East & Africa Low Salt Packaged Food Revenue (million), by Application 2025 & 2033
- Figure 40: Middle East & Africa Low Salt Packaged Food Volume (K), by Application 2025 & 2033
- Figure 41: Middle East & Africa Low Salt Packaged Food Revenue Share (%), by Application 2025 & 2033
- Figure 42: Middle East & Africa Low Salt Packaged Food Volume Share (%), by Application 2025 & 2033
- Figure 43: Middle East & Africa Low Salt Packaged Food Revenue (million), by Type 2025 & 2033
- Figure 44: Middle East & Africa Low Salt Packaged Food Volume (K), by Type 2025 & 2033
- Figure 45: Middle East & Africa Low Salt Packaged Food Revenue Share (%), by Type 2025 & 2033
- Figure 46: Middle East & Africa Low Salt Packaged Food Volume Share (%), by Type 2025 & 2033
- Figure 47: Middle East & Africa Low Salt Packaged Food Revenue (million), by Country 2025 & 2033
- Figure 48: Middle East & Africa Low Salt Packaged Food Volume (K), by Country 2025 & 2033
- Figure 49: Middle East & Africa Low Salt Packaged Food Revenue Share (%), by Country 2025 & 2033
- Figure 50: Middle East & Africa Low Salt Packaged Food Volume Share (%), by Country 2025 & 2033
- Figure 51: Asia Pacific Low Salt Packaged Food Revenue (million), by Application 2025 & 2033
- Figure 52: Asia Pacific Low Salt Packaged Food Volume (K), by Application 2025 & 2033
- Figure 53: Asia Pacific Low Salt Packaged Food Revenue Share (%), by Application 2025 & 2033
- Figure 54: Asia Pacific Low Salt Packaged Food Volume Share (%), by Application 2025 & 2033
- Figure 55: Asia Pacific Low Salt Packaged Food Revenue (million), by Type 2025 & 2033
- Figure 56: Asia Pacific Low Salt Packaged Food Volume (K), by Type 2025 & 2033
- Figure 57: Asia Pacific Low Salt Packaged Food Revenue Share (%), by Type 2025 & 2033
- Figure 58: Asia Pacific Low Salt Packaged Food Volume Share (%), by Type 2025 & 2033
- Figure 59: Asia Pacific Low Salt Packaged Food Revenue (million), by Country 2025 & 2033
- Figure 60: Asia Pacific Low Salt Packaged Food Volume (K), by Country 2025 & 2033
- Figure 61: Asia Pacific Low Salt Packaged Food Revenue Share (%), by Country 2025 & 2033
- Figure 62: Asia Pacific Low Salt Packaged Food Volume Share (%), by Country 2025 & 2033
List of Tables
- Table 1: Global Low Salt Packaged Food Revenue million Forecast, by Application 2020 & 2033
- Table 2: Global Low Salt Packaged Food Volume K Forecast, by Application 2020 & 2033
- Table 3: Global Low Salt Packaged Food Revenue million Forecast, by Type 2020 & 2033
- Table 4: Global Low Salt Packaged Food Volume K Forecast, by Type 2020 & 2033
- Table 5: Global Low Salt Packaged Food Revenue million Forecast, by Region 2020 & 2033
- Table 6: Global Low Salt Packaged Food Volume K Forecast, by Region 2020 & 2033
- Table 7: Global Low Salt Packaged Food Revenue million Forecast, by Application 2020 & 2033
- Table 8: Global Low Salt Packaged Food Volume K Forecast, by Application 2020 & 2033
- Table 9: Global Low Salt Packaged Food Revenue million Forecast, by Type 2020 & 2033
- Table 10: Global Low Salt Packaged Food Volume K Forecast, by Type 2020 & 2033
- Table 11: Global Low Salt Packaged Food Revenue million Forecast, by Country 2020 & 2033
- Table 12: Global Low Salt Packaged Food Volume K Forecast, by Country 2020 & 2033
- Table 13: United States Low Salt Packaged Food Revenue (million) Forecast, by Application 2020 & 2033
- Table 14: United States Low Salt Packaged Food Volume (K) Forecast, by Application 2020 & 2033
- Table 15: Canada Low Salt Packaged Food Revenue (million) Forecast, by Application 2020 & 2033
- Table 16: Canada Low Salt Packaged Food Volume (K) Forecast, by Application 2020 & 2033
- Table 17: Mexico Low Salt Packaged Food Revenue (million) Forecast, by Application 2020 & 2033
- Table 18: Mexico Low Salt Packaged Food Volume (K) Forecast, by Application 2020 & 2033
- Table 19: Global Low Salt Packaged Food Revenue million Forecast, by Application 2020 & 2033
- Table 20: Global Low Salt Packaged Food Volume K Forecast, by Application 2020 & 2033
- Table 21: Global Low Salt Packaged Food Revenue million Forecast, by Type 2020 & 2033
- Table 22: Global Low Salt Packaged Food Volume K Forecast, by Type 2020 & 2033
- Table 23: Global Low Salt Packaged Food Revenue million Forecast, by Country 2020 & 2033
- Table 24: Global Low Salt Packaged Food Volume K Forecast, by Country 2020 & 2033
- Table 25: Brazil Low Salt Packaged Food Revenue (million) Forecast, by Application 2020 & 2033
- Table 26: Brazil Low Salt Packaged Food Volume (K) Forecast, by Application 2020 & 2033
- Table 27: Argentina Low Salt Packaged Food Revenue (million) Forecast, by Application 2020 & 2033
- Table 28: Argentina Low Salt Packaged Food Volume (K) Forecast, by Application 2020 & 2033
- Table 29: Rest of South America Low Salt Packaged Food Revenue (million) Forecast, by Application 2020 & 2033
- Table 30: Rest of South America Low Salt Packaged Food Volume (K) Forecast, by Application 2020 & 2033
- Table 31: Global Low Salt Packaged Food Revenue million Forecast, by Application 2020 & 2033
- Table 32: Global Low Salt Packaged Food Volume K Forecast, by Application 2020 & 2033
- Table 33: Global Low Salt Packaged Food Revenue million Forecast, by Type 2020 & 2033
- Table 34: Global Low Salt Packaged Food Volume K Forecast, by Type 2020 & 2033
- Table 35: Global Low Salt Packaged Food Revenue million Forecast, by Country 2020 & 2033
- Table 36: Global Low Salt Packaged Food Volume K Forecast, by Country 2020 & 2033
- Table 37: United Kingdom Low Salt Packaged Food Revenue (million) Forecast, by Application 2020 & 2033
- Table 38: United Kingdom Low Salt Packaged Food Volume (K) Forecast, by Application 2020 & 2033
- Table 39: Germany Low Salt Packaged Food Revenue (million) Forecast, by Application 2020 & 2033
- Table 40: Germany Low Salt Packaged Food Volume (K) Forecast, by Application 2020 & 2033
- Table 41: France Low Salt Packaged Food Revenue (million) Forecast, by Application 2020 & 2033
- Table 42: France Low Salt Packaged Food Volume (K) Forecast, by Application 2020 & 2033
- Table 43: Italy Low Salt Packaged Food Revenue (million) Forecast, by Application 2020 & 2033
- Table 44: Italy Low Salt Packaged Food Volume (K) Forecast, by Application 2020 & 2033
- Table 45: Spain Low Salt Packaged Food Revenue (million) Forecast, by Application 2020 & 2033
- Table 46: Spain Low Salt Packaged Food Volume (K) Forecast, by Application 2020 & 2033
- Table 47: Russia Low Salt Packaged Food Revenue (million) Forecast, by Application 2020 & 2033
- Table 48: Russia Low Salt Packaged Food Volume (K) Forecast, by Application 2020 & 2033
- Table 49: Benelux Low Salt Packaged Food Revenue (million) Forecast, by Application 2020 & 2033
- Table 50: Benelux Low Salt Packaged Food Volume (K) Forecast, by Application 2020 & 2033
- Table 51: Nordics Low Salt Packaged Food Revenue (million) Forecast, by Application 2020 & 2033
- Table 52: Nordics Low Salt Packaged Food Volume (K) Forecast, by Application 2020 & 2033
- Table 53: Rest of Europe Low Salt Packaged Food Revenue (million) Forecast, by Application 2020 & 2033
- Table 54: Rest of Europe Low Salt Packaged Food Volume (K) Forecast, by Application 2020 & 2033
- Table 55: Global Low Salt Packaged Food Revenue million Forecast, by Application 2020 & 2033
- Table 56: Global Low Salt Packaged Food Volume K Forecast, by Application 2020 & 2033
- Table 57: Global Low Salt Packaged Food Revenue million Forecast, by Type 2020 & 2033
- Table 58: Global Low Salt Packaged Food Volume K Forecast, by Type 2020 & 2033
- Table 59: Global Low Salt Packaged Food Revenue million Forecast, by Country 2020 & 2033
- Table 60: Global Low Salt Packaged Food Volume K Forecast, by Country 2020 & 2033
- Table 61: Turkey Low Salt Packaged Food Revenue (million) Forecast, by Application 2020 & 2033
- Table 62: Turkey Low Salt Packaged Food Volume (K) Forecast, by Application 2020 & 2033
- Table 63: Israel Low Salt Packaged Food Revenue (million) Forecast, by Application 2020 & 2033
- Table 64: Israel Low Salt Packaged Food Volume (K) Forecast, by Application 2020 & 2033
- Table 65: GCC Low Salt Packaged Food Revenue (million) Forecast, by Application 2020 & 2033
- Table 66: GCC Low Salt Packaged Food Volume (K) Forecast, by Application 2020 & 2033
- Table 67: North Africa Low Salt Packaged Food Revenue (million) Forecast, by Application 2020 & 2033
- Table 68: North Africa Low Salt Packaged Food Volume (K) Forecast, by Application 2020 & 2033
- Table 69: South Africa Low Salt Packaged Food Revenue (million) Forecast, by Application 2020 & 2033
- Table 70: South Africa Low Salt Packaged Food Volume (K) Forecast, by Application 2020 & 2033
- Table 71: Rest of Middle East & Africa Low Salt Packaged Food Revenue (million) Forecast, by Application 2020 & 2033
- Table 72: Rest of Middle East & Africa Low Salt Packaged Food Volume (K) Forecast, by Application 2020 & 2033
- Table 73: Global Low Salt Packaged Food Revenue million Forecast, by Application 2020 & 2033
- Table 74: Global Low Salt Packaged Food Volume K Forecast, by Application 2020 & 2033
- Table 75: Global Low Salt Packaged Food Revenue million Forecast, by Type 2020 & 2033
- Table 76: Global Low Salt Packaged Food Volume K Forecast, by Type 2020 & 2033
- Table 77: Global Low Salt Packaged Food Revenue million Forecast, by Country 2020 & 2033
- Table 78: Global Low Salt Packaged Food Volume K Forecast, by Country 2020 & 2033
- Table 79: China Low Salt Packaged Food Revenue (million) Forecast, by Application 2020 & 2033
- Table 80: China Low Salt Packaged Food Volume (K) Forecast, by Application 2020 & 2033
- Table 81: India Low Salt Packaged Food Revenue (million) Forecast, by Application 2020 & 2033
- Table 82: India Low Salt Packaged Food Volume (K) Forecast, by Application 2020 & 2033
- Table 83: Japan Low Salt Packaged Food Revenue (million) Forecast, by Application 2020 & 2033
- Table 84: Japan Low Salt Packaged Food Volume (K) Forecast, by Application 2020 & 2033
- Table 85: South Korea Low Salt Packaged Food Revenue (million) Forecast, by Application 2020 & 2033
- Table 86: South Korea Low Salt Packaged Food Volume (K) Forecast, by Application 2020 & 2033
- Table 87: ASEAN Low Salt Packaged Food Revenue (million) Forecast, by Application 2020 & 2033
- Table 88: ASEAN Low Salt Packaged Food Volume (K) Forecast, by Application 2020 & 2033
- Table 89: Oceania Low Salt Packaged Food Revenue (million) Forecast, by Application 2020 & 2033
- Table 90: Oceania Low Salt Packaged Food Volume (K) Forecast, by Application 2020 & 2033
- Table 91: Rest of Asia Pacific Low Salt Packaged Food Revenue (million) Forecast, by Application 2020 & 2033
- Table 92: Rest of Asia Pacific Low Salt Packaged Food Volume (K) Forecast, by Application 2020 & 2033
Frequently Asked Questions
1. What is the projected Compound Annual Growth Rate (CAGR) of the Low Salt Packaged Food?
The projected CAGR is approximately XXX%.
2. Which companies are prominent players in the Low Salt Packaged Food?
Key companies in the market include PepsiCo, The Kraft Heinz Company, General Mills, Maple Leaf Foods, Kellogg's, JBS, Tesco, Tyson Foods, Nestle, ConAgra Foods, Hormel Foods, Smithfield Foods, Cargill.
3. What are the main segments of the Low Salt Packaged Food?
The market segments include Application, Type.
4. Can you provide details about the market size?
The market size is estimated to be USD XXX million as of 2022.
5. What are some drivers contributing to market growth?
N/A
6. What are the notable trends driving market growth?
N/A
7. Are there any restraints impacting market growth?
N/A
8. Can you provide examples of recent developments in the market?
N/A
9. What pricing options are available for accessing the report?
Pricing options include single-user, multi-user, and enterprise licenses priced at USD 3950.00, USD 5925.00, and USD 7900.00 respectively.
10. Is the market size provided in terms of value or volume?
The market size is provided in terms of value, measured in million and volume, measured in K.
11. Are there any specific market keywords associated with the report?
Yes, the market keyword associated with the report is "Low Salt Packaged Food," which aids in identifying and referencing the specific market segment covered.
12. How do I determine which pricing option suits my needs best?
The pricing options vary based on user requirements and access needs. Individual users may opt for single-user licenses, while businesses requiring broader access may choose multi-user or enterprise licenses for cost-effective access to the report.
13. Are there any additional resources or data provided in the Low Salt Packaged Food report?
While the report offers comprehensive insights, it's advisable to review the specific contents or supplementary materials provided to ascertain if additional resources or data are available.
14. How can I stay updated on further developments or reports in the Low Salt Packaged Food?
To stay informed about further developments, trends, and reports in the Low Salt Packaged Food, consider subscribing to industry newsletters, following relevant companies and organizations, or regularly checking reputable industry news sources and publications.
Methodology
Step 1 - Identification of Relevant Samples Size from Population Database


Step 2 - Approaches for Defining Global Market Size (Value, Volume* & Price*)

Note*: In applicable scenarios
Step 3 - Data Sources
Primary Research
- Web Analytics
- Survey Reports
- Research Institute
- Latest Research Reports
- Opinion Leaders
Secondary Research
- Annual Reports
- White Paper
- Latest Press Release
- Industry Association
- Paid Database
- Investor Presentations

Step 4 - Data Triangulation
Involves using different sources of information in order to increase the validity of a study
These sources are likely to be stakeholders in a program - participants, other researchers, program staff, other community members, and so on.
Then we put all data in single framework & apply various statistical tools to find out the dynamic on the market.
During the analysis stage, feedback from the stakeholder groups would be compared to determine areas of agreement as well as areas of divergence