

Key Insights
The global Household Emergency Food market is projected to reach $9 billion by 2025, exhibiting a Compound Annual Growth Rate (CAGR) of 5.83% from 2025 to 2033. This growth is fueled by increasing consumer awareness of food security, disaster preparedness, and the demand for long-shelf-life food options. The market's significant size reflects substantial investments in emergency food supplies. Key drivers include concerns over supply chain disruptions, extreme weather events, and geopolitical uncertainties, prompting a shift towards self-sufficiency and pre-prepared food solutions. The expanding online retail sector enhances market accessibility, facilitating broader consumer procurement of these essential supplies.
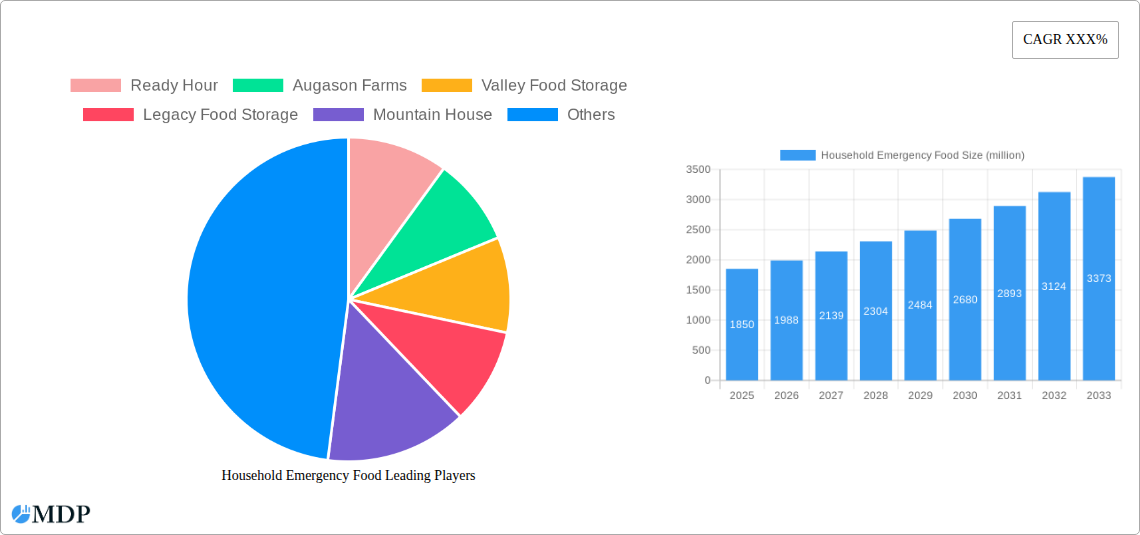
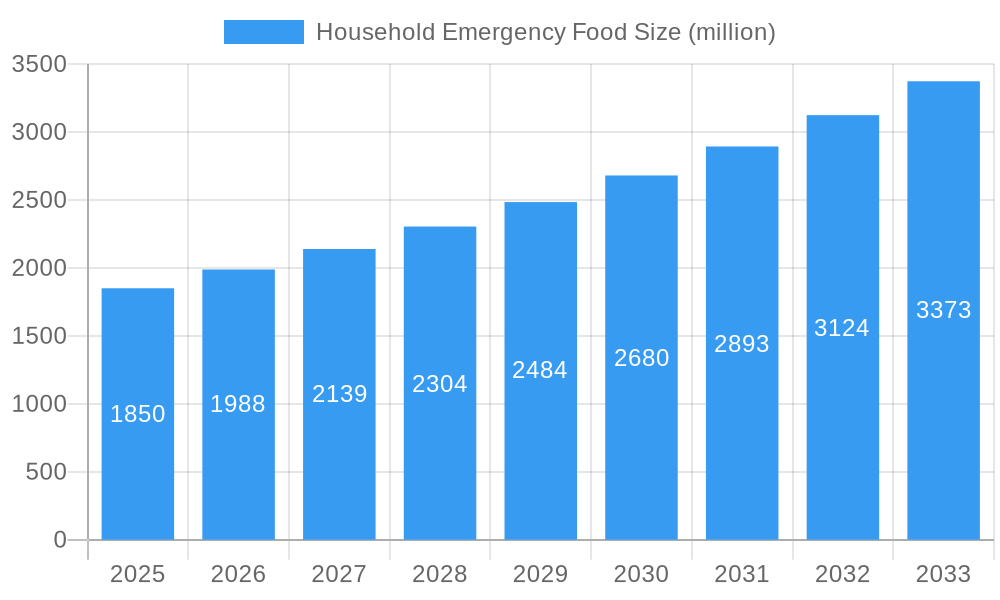
Household Emergency Food Market Size (In Billion)
The market is segmented by application and product type to meet diverse consumer needs. Online sales are expected to surpass offline channels due to convenience and wider product selection. Freeze-dried food dominates product types, valued for its extended shelf life, nutritional integrity, and lightweight properties, making it ideal for long-term storage and emergency kits. Non-freeze-dried alternatives also serve consumers seeking more traditional, shorter-shelf-life options. Leading companies such as Ready Hour, Augason Farms, and Mountain House are actively innovating their product portfolios. However, potential restraints include the initial cost of some emergency food supplies and limited consumer education on proper storage and utilization, which may affect market penetration in specific demographics. Nevertheless, the overarching trend of enhanced preparedness is expected to drive consistent market expansion.
Household Emergency Food Company Market Share
This comprehensive report analyzes the Household Emergency Food market from 2019 to 2033, with a base and estimated year of 2025, offering actionable insights for stakeholders focused on resilient food solutions.
Discover market dynamics, emerging trends, leading segments, and strategic opportunities within the global household emergency food industry. This report is an essential resource for manufacturers, distributors, investors, and policymakers seeking to capitalize on this critical and growing sector.
Household Emergency Food Market Dynamics & Concentration
The household emergency food market is experiencing significant evolution, marked by a moderate level of concentration with a few key players holding substantial market share. Companies such as Ready Hour, Augason Farms, Valley Food Storage, Legacy Food Storage, Mountain House, Nutristore, SOS Food Lab, Survival Frog, BePrepared, Mother Earth Products, Thrive Life, and ReadyWise are actively shaping the landscape. Innovation drivers, including advancements in food preservation technologies and an increasing consumer focus on self-sufficiency, are pushing the market forward. Regulatory frameworks, primarily centered on food safety standards and labeling requirements, are well-established but continually adapt to new product formulations. Product substitutes, while present in the form of traditional canned goods and basic pantry staples, are increasingly differentiated by their extended shelf life and specialized nutritional profiles. End-user trends highlight a growing demand for convenient, long-lasting, and nutritionally balanced emergency food options, driven by heightened awareness of natural disasters, geopolitical instability, and personal health concerns. Mergers and acquisitions (M&A) activities, though not at an extreme level, indicate strategic consolidation and expansion efforts by larger entities seeking to broaden their product portfolios and market reach. The market share distribution is dynamic, with estimated market share for leading companies ranging from 5% to 15% in 2025. The number of M&A deals in the historical period (2019-2024) was approximately 20, signaling growing industry consolidation.
Household Emergency Food Industry Trends & Analysis
The household emergency food industry is poised for robust growth, projected to experience a Compound Annual Growth Rate (CAGR) of approximately 8.5% during the forecast period of 2025-2033. This expansion is primarily fueled by a confluence of factors including increasing consumer awareness regarding natural disasters and emergency preparedness, a growing trend towards self-reliance and homesteading, and the evolving food preservation technologies that enhance shelf-life and nutritional value. Technological disruptions are significantly impacting the market, with advancements in freeze-drying and innovative packaging solutions offering extended product viability and improved taste profiles. The non-freeze-dried segment, while still relevant, is seeing a shift towards more sophisticated preservation methods. Consumer preferences are leaning towards a wider variety of meal options, including vegetarian and specialized dietary needs, alongside traditional high-calorie emergency rations. The competitive dynamics are characterized by both established players and new entrants vying for market share through product innovation, aggressive marketing strategies, and competitive pricing. Market penetration is expected to rise from an estimated 25% in 2025 to over 40% by 2033, indicating a substantial opportunity for market expansion. The overall market size is estimated to be over $2,000 million in 2025, with projections to exceed $4,500 million by 2033. The demand for freeze-dried food is anticipated to grow at a CAGR of 9.0%, while the non-freeze-dried segment is expected to grow at a CAGR of 7.8%.
Leading Markets & Segments in Household Emergency Food
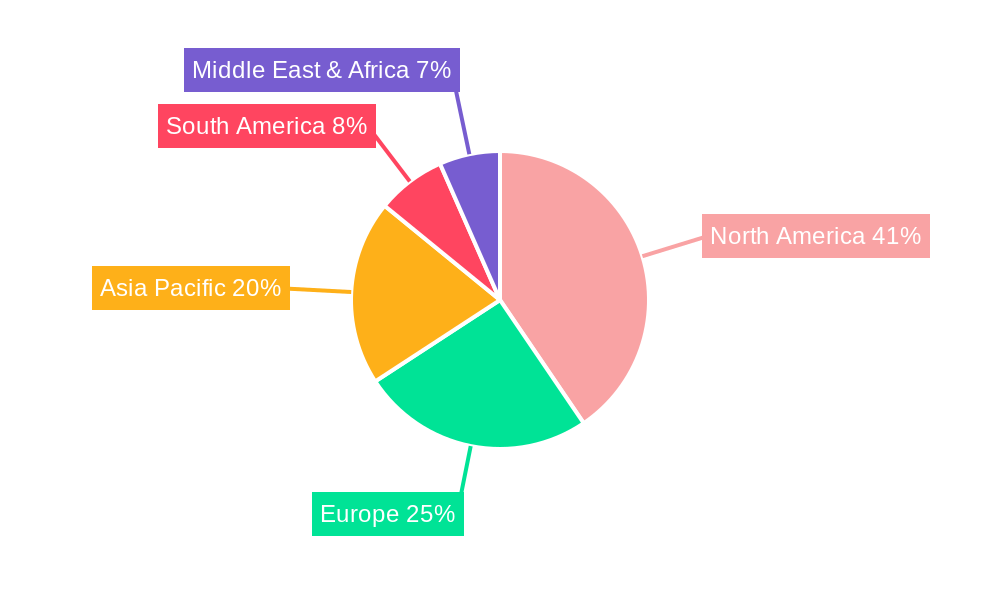
The North American region is identified as the dominant market for household emergency food, driven by a deeply ingrained culture of preparedness and a high prevalence of natural disaster awareness. Within North America, the United States represents the largest country market, with an estimated market size of over $1,200 million in 2025. The application segment of online sales is experiencing exponential growth, projected to account for over 60% of total sales by 2033. This surge is attributable to the convenience of e-commerce, wider product availability, and targeted digital marketing efforts. Key drivers for online sales dominance include ease of comparison, direct-to-consumer models, and the ability to reach a broader demographic.
The segment of freeze-dried food continues to lead in terms of consumer preference and market share, estimated at over 70% of the total market in 2025. This dominance is attributed to its superior shelf-life, minimal weight, and ability to retain nutrients and taste. Key drivers for freeze-dried food dominance include its portability, ease of preparation, and suitability for long-term storage. Economic policies supporting disaster preparedness initiatives and robust e-commerce infrastructure further bolster the growth in these segments. The estimated market size for freeze-dried food in 2025 is over $1,400 million, while non-freeze-dried food is estimated at over $600 million.
Household Emergency Food Product Developments
Recent product developments in the household emergency food sector are focused on enhancing nutritional value, expanding flavor profiles, and improving convenience. Innovations include the introduction of gluten-free and plant-based emergency meal options, catering to a wider range of dietary needs. Furthermore, advancements in packaging technology are leading to more compact and durable solutions with extended shelf lives, often exceeding 30 years. Competitive advantages are being carved out through the development of complete meal kits designed for specific scenarios, such as backpacking or family preparedness, offering a blend of taste, nutrition, and long-term viability. Technological trends are driving the integration of more natural ingredients and a reduction in preservatives, appealing to health-conscious consumers.
Key Drivers of Household Emergency Food Growth
Several key factors are propelling the growth of the household emergency food market. Heightened consumer awareness regarding natural disasters, such as hurricanes, earthquakes, and wildfires, is a significant driver, prompting individuals and families to invest in preparedness solutions. Economic factors, including increasing disposable incomes and a growing sense of economic instability, also contribute to the demand for self-sufficiency. Regulatory frameworks that encourage or mandate emergency preparedness for businesses and government agencies indirectly boost the consumer market by normalizing the concept. Technological advancements in food preservation, particularly freeze-drying and retort pouch technology, have made emergency food more palatable, nutritious, and longer-lasting. The increasing popularity of outdoor activities and preparedness-focused lifestyles further fuels demand.
Challenges in the Household Emergency Food Market
Despite its strong growth trajectory, the household emergency food market faces several challenges. Regulatory hurdles related to food safety standards and labeling can be complex and costly for manufacturers, particularly for new product formulations or international distribution. Supply chain issues, including raw material sourcing and logistical complexities, can impact product availability and cost. Competitive pressures from both established brands and emerging players often lead to price wars and necessitate continuous innovation to maintain market share. Consumer perception regarding the taste and palatability of some emergency food products remains a barrier for broader adoption. The estimated cost impact of regulatory compliance can be upwards of 5% of production costs for smaller manufacturers.
Emerging Opportunities in Household Emergency Food
Emerging opportunities in the household emergency food market are ripe for exploration. Technological breakthroughs in sustainable food preservation and packaging are creating avenues for environmentally friendly and cost-effective solutions. Strategic partnerships between emergency food manufacturers and disaster relief organizations, as well as government agencies, can foster wider distribution and public awareness campaigns. Market expansion into developing regions with increasing awareness of climate change and disaster preparedness presents significant long-term growth potential. The development of subscription-based emergency food services and personalized preparedness plans can foster customer loyalty and recurring revenue streams.
Leading Players in the Household Emergency Food Sector
- Ready Hour
- Augason Farms
- Valley Food Storage
- Legacy Food Storage
- Mountain House
- Nutristore
- SOS Food Lab
- Survival Frog
- BePrepared
- Mother Earth Products
- Thrive Life
- ReadyWise
Key Milestones in Household Emergency Food Industry
- 2019: Increased focus on plant-based and allergen-free emergency food options.
- 2020: Surge in demand due to global pandemic, highlighting the importance of home preparedness.
- 2021: Introduction of advanced vacuum-sealed meal pouches with extended shelf lives exceeding 25 years.
- 2022: Significant investment in e-commerce platforms by major players, enhancing online sales accessibility.
- 2023: Growing consumer interest in sustainable sourcing and eco-friendly packaging for emergency food.
- 2024: Development of smart packaging solutions for monitoring food freshness and expiration dates.
Strategic Outlook for Household Emergency Food Market
The strategic outlook for the household emergency food market remains exceptionally positive, driven by an escalating global awareness of preparedness needs and continuous innovation in food technology. Growth accelerators include the increasing frequency and severity of natural disasters, coupled with geopolitical uncertainties, which are compelling consumers to invest in long-term food security. The market is poised for continued expansion through the development of more diverse, palatable, and nutritionally complete emergency food options. Strategic opportunities lie in expanding product lines to cater to niche dietary requirements, enhancing direct-to-consumer sales channels, and fostering robust partnerships with disaster preparedness agencies and government entities. The adoption of sustainable practices and advanced packaging will further differentiate brands and capture market share in the coming years.
Household Emergency Food Segmentation
-
1. Application
- 1.1. Online Sales
- 1.2. Offline Sales
-
2. Type
- 2.1. Freeze Dried Food
- 2.2. Non-Freeze Dried Food
Household Emergency Food Segmentation By Geography
-
1. North America
- 1.1. United States
- 1.2. Canada
- 1.3. Mexico
-
2. South America
- 2.1. Brazil
- 2.2. Argentina
- 2.3. Rest of South America
-
3. Europe
- 3.1. United Kingdom
- 3.2. Germany
- 3.3. France
- 3.4. Italy
- 3.5. Spain
- 3.6. Russia
- 3.7. Benelux
- 3.8. Nordics
- 3.9. Rest of Europe
-
4. Middle East & Africa
- 4.1. Turkey
- 4.2. Israel
- 4.3. GCC
- 4.4. North Africa
- 4.5. South Africa
- 4.6. Rest of Middle East & Africa
-
5. Asia Pacific
- 5.1. China
- 5.2. India
- 5.3. Japan
- 5.4. South Korea
- 5.5. ASEAN
- 5.6. Oceania
- 5.7. Rest of Asia Pacific
Household Emergency Food Regional Market Share
Geographic Coverage of Household Emergency Food
Household Emergency Food REPORT HIGHLIGHTS
| Aspects | Details |
|---|---|
| Study Period | 2020-2034 |
| Base Year | 2025 |
| Estimated Year | 2026 |
| Forecast Period | 2026-2034 |
| Historical Period | 2020-2025 |
| Growth Rate | CAGR of 5.83% from 2020-2034 |
| Segmentation |
|
Table of Contents
- 1. Introduction
- 1.1. Research Scope
- 1.2. Market Segmentation
- 1.3. Research Methodology
- 1.4. Definitions and Assumptions
- 2. Executive Summary
- 2.1. Introduction
- 3. Market Dynamics
- 3.1. Introduction
- 3.2. Market Drivers
- 3.3. Market Restrains
- 3.4. Market Trends
- 4. Market Factor Analysis
- 4.1. Porters Five Forces
- 4.2. Supply/Value Chain
- 4.3. PESTEL analysis
- 4.4. Market Entropy
- 4.5. Patent/Trademark Analysis
- 5. Global Household Emergency Food Analysis, Insights and Forecast, 2020-2032
- 5.1. Market Analysis, Insights and Forecast - by Application
- 5.1.1. Online Sales
- 5.1.2. Offline Sales
- 5.2. Market Analysis, Insights and Forecast - by Type
- 5.2.1. Freeze Dried Food
- 5.2.2. Non-Freeze Dried Food
- 5.3. Market Analysis, Insights and Forecast - by Region
- 5.3.1. North America
- 5.3.2. South America
- 5.3.3. Europe
- 5.3.4. Middle East & Africa
- 5.3.5. Asia Pacific
- 5.1. Market Analysis, Insights and Forecast - by Application
- 6. North America Household Emergency Food Analysis, Insights and Forecast, 2020-2032
- 6.1. Market Analysis, Insights and Forecast - by Application
- 6.1.1. Online Sales
- 6.1.2. Offline Sales
- 6.2. Market Analysis, Insights and Forecast - by Type
- 6.2.1. Freeze Dried Food
- 6.2.2. Non-Freeze Dried Food
- 6.1. Market Analysis, Insights and Forecast - by Application
- 7. South America Household Emergency Food Analysis, Insights and Forecast, 2020-2032
- 7.1. Market Analysis, Insights and Forecast - by Application
- 7.1.1. Online Sales
- 7.1.2. Offline Sales
- 7.2. Market Analysis, Insights and Forecast - by Type
- 7.2.1. Freeze Dried Food
- 7.2.2. Non-Freeze Dried Food
- 7.1. Market Analysis, Insights and Forecast - by Application
- 8. Europe Household Emergency Food Analysis, Insights and Forecast, 2020-2032
- 8.1. Market Analysis, Insights and Forecast - by Application
- 8.1.1. Online Sales
- 8.1.2. Offline Sales
- 8.2. Market Analysis, Insights and Forecast - by Type
- 8.2.1. Freeze Dried Food
- 8.2.2. Non-Freeze Dried Food
- 8.1. Market Analysis, Insights and Forecast - by Application
- 9. Middle East & Africa Household Emergency Food Analysis, Insights and Forecast, 2020-2032
- 9.1. Market Analysis, Insights and Forecast - by Application
- 9.1.1. Online Sales
- 9.1.2. Offline Sales
- 9.2. Market Analysis, Insights and Forecast - by Type
- 9.2.1. Freeze Dried Food
- 9.2.2. Non-Freeze Dried Food
- 9.1. Market Analysis, Insights and Forecast - by Application
- 10. Asia Pacific Household Emergency Food Analysis, Insights and Forecast, 2020-2032
- 10.1. Market Analysis, Insights and Forecast - by Application
- 10.1.1. Online Sales
- 10.1.2. Offline Sales
- 10.2. Market Analysis, Insights and Forecast - by Type
- 10.2.1. Freeze Dried Food
- 10.2.2. Non-Freeze Dried Food
- 10.1. Market Analysis, Insights and Forecast - by Application
- 11. Competitive Analysis
- 11.1. Global Market Share Analysis 2025
- 11.2. Company Profiles
- 11.2.1 Ready Hour
- 11.2.1.1. Overview
- 11.2.1.2. Products
- 11.2.1.3. SWOT Analysis
- 11.2.1.4. Recent Developments
- 11.2.1.5. Financials (Based on Availability)
- 11.2.2 Augason Farms
- 11.2.2.1. Overview
- 11.2.2.2. Products
- 11.2.2.3. SWOT Analysis
- 11.2.2.4. Recent Developments
- 11.2.2.5. Financials (Based on Availability)
- 11.2.3 Valley Food Storage
- 11.2.3.1. Overview
- 11.2.3.2. Products
- 11.2.3.3. SWOT Analysis
- 11.2.3.4. Recent Developments
- 11.2.3.5. Financials (Based on Availability)
- 11.2.4 Legacy Food Storage
- 11.2.4.1. Overview
- 11.2.4.2. Products
- 11.2.4.3. SWOT Analysis
- 11.2.4.4. Recent Developments
- 11.2.4.5. Financials (Based on Availability)
- 11.2.5 Mountain House
- 11.2.5.1. Overview
- 11.2.5.2. Products
- 11.2.5.3. SWOT Analysis
- 11.2.5.4. Recent Developments
- 11.2.5.5. Financials (Based on Availability)
- 11.2.6 Nutristore
- 11.2.6.1. Overview
- 11.2.6.2. Products
- 11.2.6.3. SWOT Analysis
- 11.2.6.4. Recent Developments
- 11.2.6.5. Financials (Based on Availability)
- 11.2.7 SOS Food Lab
- 11.2.7.1. Overview
- 11.2.7.2. Products
- 11.2.7.3. SWOT Analysis
- 11.2.7.4. Recent Developments
- 11.2.7.5. Financials (Based on Availability)
- 11.2.8 Survival Frog
- 11.2.8.1. Overview
- 11.2.8.2. Products
- 11.2.8.3. SWOT Analysis
- 11.2.8.4. Recent Developments
- 11.2.8.5. Financials (Based on Availability)
- 11.2.9 BePrepared
- 11.2.9.1. Overview
- 11.2.9.2. Products
- 11.2.9.3. SWOT Analysis
- 11.2.9.4. Recent Developments
- 11.2.9.5. Financials (Based on Availability)
- 11.2.10 Mother Earth Products
- 11.2.10.1. Overview
- 11.2.10.2. Products
- 11.2.10.3. SWOT Analysis
- 11.2.10.4. Recent Developments
- 11.2.10.5. Financials (Based on Availability)
- 11.2.11 Thrive Life
- 11.2.11.1. Overview
- 11.2.11.2. Products
- 11.2.11.3. SWOT Analysis
- 11.2.11.4. Recent Developments
- 11.2.11.5. Financials (Based on Availability)
- 11.2.12 ReadyWise
- 11.2.12.1. Overview
- 11.2.12.2. Products
- 11.2.12.3. SWOT Analysis
- 11.2.12.4. Recent Developments
- 11.2.12.5. Financials (Based on Availability)
- 11.2.1 Ready Hour
List of Figures
- Figure 1: Global Household Emergency Food Revenue Breakdown (billion, %) by Region 2025 & 2033
- Figure 2: Global Household Emergency Food Volume Breakdown (K, %) by Region 2025 & 2033
- Figure 3: North America Household Emergency Food Revenue (billion), by Application 2025 & 2033
- Figure 4: North America Household Emergency Food Volume (K), by Application 2025 & 2033
- Figure 5: North America Household Emergency Food Revenue Share (%), by Application 2025 & 2033
- Figure 6: North America Household Emergency Food Volume Share (%), by Application 2025 & 2033
- Figure 7: North America Household Emergency Food Revenue (billion), by Type 2025 & 2033
- Figure 8: North America Household Emergency Food Volume (K), by Type 2025 & 2033
- Figure 9: North America Household Emergency Food Revenue Share (%), by Type 2025 & 2033
- Figure 10: North America Household Emergency Food Volume Share (%), by Type 2025 & 2033
- Figure 11: North America Household Emergency Food Revenue (billion), by Country 2025 & 2033
- Figure 12: North America Household Emergency Food Volume (K), by Country 2025 & 2033
- Figure 13: North America Household Emergency Food Revenue Share (%), by Country 2025 & 2033
- Figure 14: North America Household Emergency Food Volume Share (%), by Country 2025 & 2033
- Figure 15: South America Household Emergency Food Revenue (billion), by Application 2025 & 2033
- Figure 16: South America Household Emergency Food Volume (K), by Application 2025 & 2033
- Figure 17: South America Household Emergency Food Revenue Share (%), by Application 2025 & 2033
- Figure 18: South America Household Emergency Food Volume Share (%), by Application 2025 & 2033
- Figure 19: South America Household Emergency Food Revenue (billion), by Type 2025 & 2033
- Figure 20: South America Household Emergency Food Volume (K), by Type 2025 & 2033
- Figure 21: South America Household Emergency Food Revenue Share (%), by Type 2025 & 2033
- Figure 22: South America Household Emergency Food Volume Share (%), by Type 2025 & 2033
- Figure 23: South America Household Emergency Food Revenue (billion), by Country 2025 & 2033
- Figure 24: South America Household Emergency Food Volume (K), by Country 2025 & 2033
- Figure 25: South America Household Emergency Food Revenue Share (%), by Country 2025 & 2033
- Figure 26: South America Household Emergency Food Volume Share (%), by Country 2025 & 2033
- Figure 27: Europe Household Emergency Food Revenue (billion), by Application 2025 & 2033
- Figure 28: Europe Household Emergency Food Volume (K), by Application 2025 & 2033
- Figure 29: Europe Household Emergency Food Revenue Share (%), by Application 2025 & 2033
- Figure 30: Europe Household Emergency Food Volume Share (%), by Application 2025 & 2033
- Figure 31: Europe Household Emergency Food Revenue (billion), by Type 2025 & 2033
- Figure 32: Europe Household Emergency Food Volume (K), by Type 2025 & 2033
- Figure 33: Europe Household Emergency Food Revenue Share (%), by Type 2025 & 2033
- Figure 34: Europe Household Emergency Food Volume Share (%), by Type 2025 & 2033
- Figure 35: Europe Household Emergency Food Revenue (billion), by Country 2025 & 2033
- Figure 36: Europe Household Emergency Food Volume (K), by Country 2025 & 2033
- Figure 37: Europe Household Emergency Food Revenue Share (%), by Country 2025 & 2033
- Figure 38: Europe Household Emergency Food Volume Share (%), by Country 2025 & 2033
- Figure 39: Middle East & Africa Household Emergency Food Revenue (billion), by Application 2025 & 2033
- Figure 40: Middle East & Africa Household Emergency Food Volume (K), by Application 2025 & 2033
- Figure 41: Middle East & Africa Household Emergency Food Revenue Share (%), by Application 2025 & 2033
- Figure 42: Middle East & Africa Household Emergency Food Volume Share (%), by Application 2025 & 2033
- Figure 43: Middle East & Africa Household Emergency Food Revenue (billion), by Type 2025 & 2033
- Figure 44: Middle East & Africa Household Emergency Food Volume (K), by Type 2025 & 2033
- Figure 45: Middle East & Africa Household Emergency Food Revenue Share (%), by Type 2025 & 2033
- Figure 46: Middle East & Africa Household Emergency Food Volume Share (%), by Type 2025 & 2033
- Figure 47: Middle East & Africa Household Emergency Food Revenue (billion), by Country 2025 & 2033
- Figure 48: Middle East & Africa Household Emergency Food Volume (K), by Country 2025 & 2033
- Figure 49: Middle East & Africa Household Emergency Food Revenue Share (%), by Country 2025 & 2033
- Figure 50: Middle East & Africa Household Emergency Food Volume Share (%), by Country 2025 & 2033
- Figure 51: Asia Pacific Household Emergency Food Revenue (billion), by Application 2025 & 2033
- Figure 52: Asia Pacific Household Emergency Food Volume (K), by Application 2025 & 2033
- Figure 53: Asia Pacific Household Emergency Food Revenue Share (%), by Application 2025 & 2033
- Figure 54: Asia Pacific Household Emergency Food Volume Share (%), by Application 2025 & 2033
- Figure 55: Asia Pacific Household Emergency Food Revenue (billion), by Type 2025 & 2033
- Figure 56: Asia Pacific Household Emergency Food Volume (K), by Type 2025 & 2033
- Figure 57: Asia Pacific Household Emergency Food Revenue Share (%), by Type 2025 & 2033
- Figure 58: Asia Pacific Household Emergency Food Volume Share (%), by Type 2025 & 2033
- Figure 59: Asia Pacific Household Emergency Food Revenue (billion), by Country 2025 & 2033
- Figure 60: Asia Pacific Household Emergency Food Volume (K), by Country 2025 & 2033
- Figure 61: Asia Pacific Household Emergency Food Revenue Share (%), by Country 2025 & 2033
- Figure 62: Asia Pacific Household Emergency Food Volume Share (%), by Country 2025 & 2033
List of Tables
- Table 1: Global Household Emergency Food Revenue billion Forecast, by Application 2020 & 2033
- Table 2: Global Household Emergency Food Volume K Forecast, by Application 2020 & 2033
- Table 3: Global Household Emergency Food Revenue billion Forecast, by Type 2020 & 2033
- Table 4: Global Household Emergency Food Volume K Forecast, by Type 2020 & 2033
- Table 5: Global Household Emergency Food Revenue billion Forecast, by Region 2020 & 2033
- Table 6: Global Household Emergency Food Volume K Forecast, by Region 2020 & 2033
- Table 7: Global Household Emergency Food Revenue billion Forecast, by Application 2020 & 2033
- Table 8: Global Household Emergency Food Volume K Forecast, by Application 2020 & 2033
- Table 9: Global Household Emergency Food Revenue billion Forecast, by Type 2020 & 2033
- Table 10: Global Household Emergency Food Volume K Forecast, by Type 2020 & 2033
- Table 11: Global Household Emergency Food Revenue billion Forecast, by Country 2020 & 2033
- Table 12: Global Household Emergency Food Volume K Forecast, by Country 2020 & 2033
- Table 13: United States Household Emergency Food Revenue (billion) Forecast, by Application 2020 & 2033
- Table 14: United States Household Emergency Food Volume (K) Forecast, by Application 2020 & 2033
- Table 15: Canada Household Emergency Food Revenue (billion) Forecast, by Application 2020 & 2033
- Table 16: Canada Household Emergency Food Volume (K) Forecast, by Application 2020 & 2033
- Table 17: Mexico Household Emergency Food Revenue (billion) Forecast, by Application 2020 & 2033
- Table 18: Mexico Household Emergency Food Volume (K) Forecast, by Application 2020 & 2033
- Table 19: Global Household Emergency Food Revenue billion Forecast, by Application 2020 & 2033
- Table 20: Global Household Emergency Food Volume K Forecast, by Application 2020 & 2033
- Table 21: Global Household Emergency Food Revenue billion Forecast, by Type 2020 & 2033
- Table 22: Global Household Emergency Food Volume K Forecast, by Type 2020 & 2033
- Table 23: Global Household Emergency Food Revenue billion Forecast, by Country 2020 & 2033
- Table 24: Global Household Emergency Food Volume K Forecast, by Country 2020 & 2033
- Table 25: Brazil Household Emergency Food Revenue (billion) Forecast, by Application 2020 & 2033
- Table 26: Brazil Household Emergency Food Volume (K) Forecast, by Application 2020 & 2033
- Table 27: Argentina Household Emergency Food Revenue (billion) Forecast, by Application 2020 & 2033
- Table 28: Argentina Household Emergency Food Volume (K) Forecast, by Application 2020 & 2033
- Table 29: Rest of South America Household Emergency Food Revenue (billion) Forecast, by Application 2020 & 2033
- Table 30: Rest of South America Household Emergency Food Volume (K) Forecast, by Application 2020 & 2033
- Table 31: Global Household Emergency Food Revenue billion Forecast, by Application 2020 & 2033
- Table 32: Global Household Emergency Food Volume K Forecast, by Application 2020 & 2033
- Table 33: Global Household Emergency Food Revenue billion Forecast, by Type 2020 & 2033
- Table 34: Global Household Emergency Food Volume K Forecast, by Type 2020 & 2033
- Table 35: Global Household Emergency Food Revenue billion Forecast, by Country 2020 & 2033
- Table 36: Global Household Emergency Food Volume K Forecast, by Country 2020 & 2033
- Table 37: United Kingdom Household Emergency Food Revenue (billion) Forecast, by Application 2020 & 2033
- Table 38: United Kingdom Household Emergency Food Volume (K) Forecast, by Application 2020 & 2033
- Table 39: Germany Household Emergency Food Revenue (billion) Forecast, by Application 2020 & 2033
- Table 40: Germany Household Emergency Food Volume (K) Forecast, by Application 2020 & 2033
- Table 41: France Household Emergency Food Revenue (billion) Forecast, by Application 2020 & 2033
- Table 42: France Household Emergency Food Volume (K) Forecast, by Application 2020 & 2033
- Table 43: Italy Household Emergency Food Revenue (billion) Forecast, by Application 2020 & 2033
- Table 44: Italy Household Emergency Food Volume (K) Forecast, by Application 2020 & 2033
- Table 45: Spain Household Emergency Food Revenue (billion) Forecast, by Application 2020 & 2033
- Table 46: Spain Household Emergency Food Volume (K) Forecast, by Application 2020 & 2033
- Table 47: Russia Household Emergency Food Revenue (billion) Forecast, by Application 2020 & 2033
- Table 48: Russia Household Emergency Food Volume (K) Forecast, by Application 2020 & 2033
- Table 49: Benelux Household Emergency Food Revenue (billion) Forecast, by Application 2020 & 2033
- Table 50: Benelux Household Emergency Food Volume (K) Forecast, by Application 2020 & 2033
- Table 51: Nordics Household Emergency Food Revenue (billion) Forecast, by Application 2020 & 2033
- Table 52: Nordics Household Emergency Food Volume (K) Forecast, by Application 2020 & 2033
- Table 53: Rest of Europe Household Emergency Food Revenue (billion) Forecast, by Application 2020 & 2033
- Table 54: Rest of Europe Household Emergency Food Volume (K) Forecast, by Application 2020 & 2033
- Table 55: Global Household Emergency Food Revenue billion Forecast, by Application 2020 & 2033
- Table 56: Global Household Emergency Food Volume K Forecast, by Application 2020 & 2033
- Table 57: Global Household Emergency Food Revenue billion Forecast, by Type 2020 & 2033
- Table 58: Global Household Emergency Food Volume K Forecast, by Type 2020 & 2033
- Table 59: Global Household Emergency Food Revenue billion Forecast, by Country 2020 & 2033
- Table 60: Global Household Emergency Food Volume K Forecast, by Country 2020 & 2033
- Table 61: Turkey Household Emergency Food Revenue (billion) Forecast, by Application 2020 & 2033
- Table 62: Turkey Household Emergency Food Volume (K) Forecast, by Application 2020 & 2033
- Table 63: Israel Household Emergency Food Revenue (billion) Forecast, by Application 2020 & 2033
- Table 64: Israel Household Emergency Food Volume (K) Forecast, by Application 2020 & 2033
- Table 65: GCC Household Emergency Food Revenue (billion) Forecast, by Application 2020 & 2033
- Table 66: GCC Household Emergency Food Volume (K) Forecast, by Application 2020 & 2033
- Table 67: North Africa Household Emergency Food Revenue (billion) Forecast, by Application 2020 & 2033
- Table 68: North Africa Household Emergency Food Volume (K) Forecast, by Application 2020 & 2033
- Table 69: South Africa Household Emergency Food Revenue (billion) Forecast, by Application 2020 & 2033
- Table 70: South Africa Household Emergency Food Volume (K) Forecast, by Application 2020 & 2033
- Table 71: Rest of Middle East & Africa Household Emergency Food Revenue (billion) Forecast, by Application 2020 & 2033
- Table 72: Rest of Middle East & Africa Household Emergency Food Volume (K) Forecast, by Application 2020 & 2033
- Table 73: Global Household Emergency Food Revenue billion Forecast, by Application 2020 & 2033
- Table 74: Global Household Emergency Food Volume K Forecast, by Application 2020 & 2033
- Table 75: Global Household Emergency Food Revenue billion Forecast, by Type 2020 & 2033
- Table 76: Global Household Emergency Food Volume K Forecast, by Type 2020 & 2033
- Table 77: Global Household Emergency Food Revenue billion Forecast, by Country 2020 & 2033
- Table 78: Global Household Emergency Food Volume K Forecast, by Country 2020 & 2033
- Table 79: China Household Emergency Food Revenue (billion) Forecast, by Application 2020 & 2033
- Table 80: China Household Emergency Food Volume (K) Forecast, by Application 2020 & 2033
- Table 81: India Household Emergency Food Revenue (billion) Forecast, by Application 2020 & 2033
- Table 82: India Household Emergency Food Volume (K) Forecast, by Application 2020 & 2033
- Table 83: Japan Household Emergency Food Revenue (billion) Forecast, by Application 2020 & 2033
- Table 84: Japan Household Emergency Food Volume (K) Forecast, by Application 2020 & 2033
- Table 85: South Korea Household Emergency Food Revenue (billion) Forecast, by Application 2020 & 2033
- Table 86: South Korea Household Emergency Food Volume (K) Forecast, by Application 2020 & 2033
- Table 87: ASEAN Household Emergency Food Revenue (billion) Forecast, by Application 2020 & 2033
- Table 88: ASEAN Household Emergency Food Volume (K) Forecast, by Application 2020 & 2033
- Table 89: Oceania Household Emergency Food Revenue (billion) Forecast, by Application 2020 & 2033
- Table 90: Oceania Household Emergency Food Volume (K) Forecast, by Application 2020 & 2033
- Table 91: Rest of Asia Pacific Household Emergency Food Revenue (billion) Forecast, by Application 2020 & 2033
- Table 92: Rest of Asia Pacific Household Emergency Food Volume (K) Forecast, by Application 2020 & 2033
Frequently Asked Questions
1. What is the projected Compound Annual Growth Rate (CAGR) of the Household Emergency Food?
The projected CAGR is approximately 5.83%.
2. Which companies are prominent players in the Household Emergency Food?
Key companies in the market include Ready Hour, Augason Farms, Valley Food Storage, Legacy Food Storage, Mountain House, Nutristore, SOS Food Lab, Survival Frog, BePrepared, Mother Earth Products, Thrive Life, ReadyWise.
3. What are the main segments of the Household Emergency Food?
The market segments include Application, Type.
4. Can you provide details about the market size?
The market size is estimated to be USD 9 billion as of 2022.
5. What are some drivers contributing to market growth?
N/A
6. What are the notable trends driving market growth?
N/A
7. Are there any restraints impacting market growth?
N/A
8. Can you provide examples of recent developments in the market?
N/A
9. What pricing options are available for accessing the report?
Pricing options include single-user, multi-user, and enterprise licenses priced at USD 3950.00, USD 5925.00, and USD 7900.00 respectively.
10. Is the market size provided in terms of value or volume?
The market size is provided in terms of value, measured in billion and volume, measured in K.
11. Are there any specific market keywords associated with the report?
Yes, the market keyword associated with the report is "Household Emergency Food," which aids in identifying and referencing the specific market segment covered.
12. How do I determine which pricing option suits my needs best?
The pricing options vary based on user requirements and access needs. Individual users may opt for single-user licenses, while businesses requiring broader access may choose multi-user or enterprise licenses for cost-effective access to the report.
13. Are there any additional resources or data provided in the Household Emergency Food report?
While the report offers comprehensive insights, it's advisable to review the specific contents or supplementary materials provided to ascertain if additional resources or data are available.
14. How can I stay updated on further developments or reports in the Household Emergency Food?
To stay informed about further developments, trends, and reports in the Household Emergency Food, consider subscribing to industry newsletters, following relevant companies and organizations, or regularly checking reputable industry news sources and publications.
Methodology
Step 1 - Identification of Relevant Samples Size from Population Database


Step 2 - Approaches for Defining Global Market Size (Value, Volume* & Price*)

Note*: In applicable scenarios
Step 3 - Data Sources
Primary Research
- Web Analytics
- Survey Reports
- Research Institute
- Latest Research Reports
- Opinion Leaders
Secondary Research
- Annual Reports
- White Paper
- Latest Press Release
- Industry Association
- Paid Database
- Investor Presentations

Step 4 - Data Triangulation
Involves using different sources of information in order to increase the validity of a study
These sources are likely to be stakeholders in a program - participants, other researchers, program staff, other community members, and so on.
Then we put all data in single framework & apply various statistical tools to find out the dynamic on the market.
During the analysis stage, feedback from the stakeholder groups would be compared to determine areas of agreement as well as areas of divergence