

Key Insights
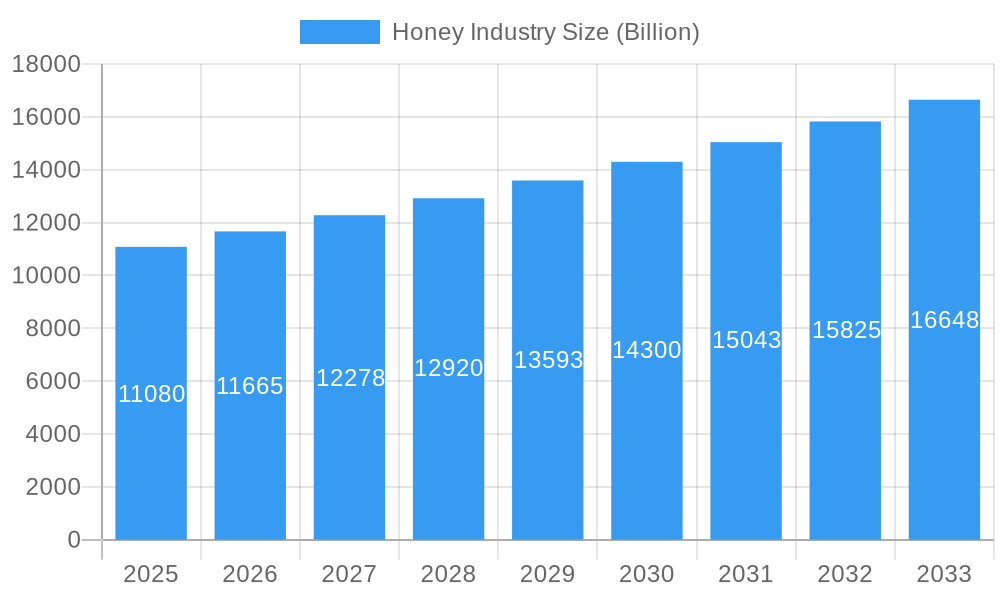
The global honey market, valued at $11.08 billion in 2025, is projected to experience robust growth, exhibiting a Compound Annual Growth Rate (CAGR) of 5.20% from 2025 to 2033. This expansion is driven by several key factors. Rising consumer awareness of honey's health benefits, including its antioxidant and antimicrobial properties, fuels demand for both raw and specialized honey varieties like Manuka honey. The increasing prevalence of health-conscious lifestyles and a preference for natural sweeteners are further boosting market growth. Furthermore, the burgeoning food and beverage industry, incorporating honey into diverse products from confectionery to beverages, creates significant market opportunities. E-commerce platforms are facilitating increased accessibility and convenience, contributing to online sales growth. However, factors such as fluctuating honey production due to climate change and bee colony health, along with adulteration concerns, pose challenges to market expansion. The market is segmented by honey type (raw, filtered, flavored, organic, Manuka), distribution channel (retail, online, bulk), and end-user (household, food manufacturers, pharmaceutical industry). Major players like Dabur Honey, Patanjali Ayurved, and Al Kabeer Exports are driving innovation and expanding their product portfolios to cater to evolving consumer preferences. Geographic growth varies, with North America and Europe representing significant markets, though Asia-Pacific's burgeoning middle class shows high potential for future growth.
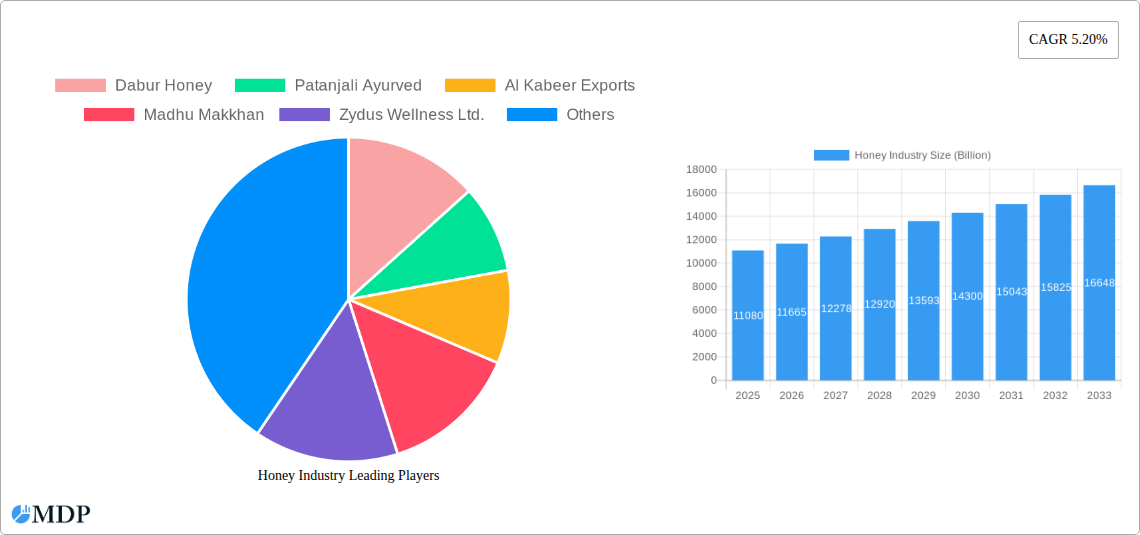
Honey Industry Market Size (In Billion)
The segmentation within the honey market provides further insights into market dynamics. The demand for organic and Manuka honey is rapidly increasing due to their perceived higher health benefits and premium pricing. The retail channel dominates the distribution landscape, but online sales are growing at a faster rate, particularly amongst younger demographics. Food manufacturers are integrating honey into a wide range of products, driving bulk purchases and significant revenue streams. The pharmaceutical industry uses honey for its medicinal properties, presenting another important growth segment. Competitive analysis reveals that established brands are strategically leveraging their brand recognition while newer entrants focus on specialized honey varieties and sustainable sourcing practices. Overall, the honey market presents a positive outlook, albeit with challenges requiring proactive management by industry players.
Honey Industry Company Market Share
Honey Industry Market Report: A Billion-Dollar Deep Dive (2019-2033)
This comprehensive report provides an in-depth analysis of the global honey industry, projecting a market valuation exceeding billions by 2033. It offers invaluable insights for industry stakeholders, investors, and businesses seeking to navigate this lucrative and rapidly evolving sector. With a focus on key players like Dabur Honey, Patanjali Ayurved, Al Kabeer Exports, Madhu Makkhan, and Zydus Wellness Ltd., this report covers market dynamics, trends, leading segments, and future opportunities, leveraging data from the historical period (2019-2024), the base year (2025), and the forecast period (2025-2033).
Honey Industry Market Dynamics & Concentration
The global honey market, valued at billions in 2024, exhibits a moderately concentrated structure. Market share is distributed among established players and numerous smaller regional producers. Innovation is primarily driven by advancements in beekeeping practices, honey processing techniques, and the development of value-added honey products like flavored and organic varieties. Stringent regulatory frameworks concerning food safety and authenticity significantly influence market operations. Competition from substitutes like artificial sweeteners is a considerable factor, although honey’s natural origin and perceived health benefits continue to fuel demand. End-user trends reveal a growing preference for organic and specialized honeys, particularly Manuka honey. The M&A landscape shows xx major deals in the last five years, indicating consolidation within the industry.
- Market Concentration: xx% market share held by top 5 players (2024).
- M&A Activity: xx deals completed between 2019-2024.
- Innovation Drivers: Sustainable beekeeping, advanced processing technologies, and value-added product development.
- Regulatory Landscape: Stringent food safety standards and labeling regulations.
- Substitute Products: Artificial sweeteners pose a competitive threat.
- End-User Trends: Increasing demand for organic, specialized, and functional honey products.
Honey Industry Industry Trends & Analysis
The global honey market is experiencing robust growth, driven by several key factors. Rising consumer awareness of honey's health benefits and its versatility as a natural sweetener are fueling demand. The increasing adoption of organic and sustainable beekeeping practices contributes to premium honey production. Technological advancements, such as improved hive management techniques and honey processing technologies, enhance efficiency and product quality. The global honey market is projected to achieve a CAGR of xx% during the forecast period (2025-2033), with market penetration expected to reach xx% by 2033. Competitive dynamics are shaped by both established players and emerging brands focusing on niche markets and innovative product offerings.
Leading Markets & Segments in Honey Industry
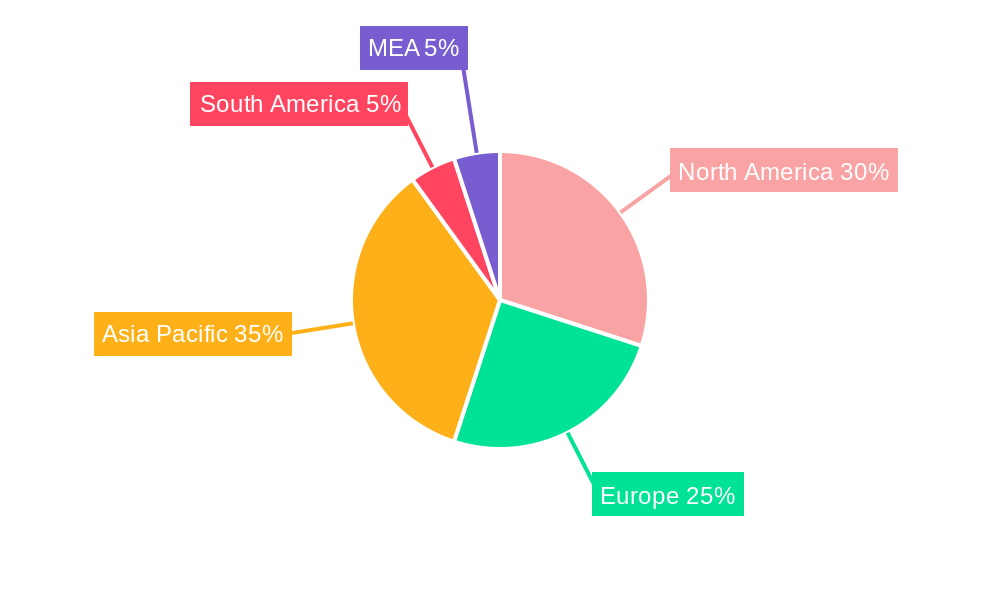
The global honey market shows significant regional variations, with Asia-Pacific, North America, and Europe accounting for the largest shares.
Dominant Region: Asia-Pacific, owing to large-scale honey production and consumption.
Key Drivers in Asia-Pacific:
- Growing population and rising disposable incomes.
- Increasing health consciousness and awareness of honey’s health benefits.
- Government support for beekeeping and honey production.
Dominant Segment (Type): Raw honey maintains a significant share, reflecting consumers’ preference for natural products.
Dominant Segment (Distribution Channel): Retail channels dominate, but online sales are rapidly growing.
Dominant Segment (End-User): Household consumption accounts for the largest share, followed by the food manufacturing industry.
Honey Industry Product Developments
Product innovation centers around value-added honey types, such as organic, Manuka, and flavored honeys, catering to diverse consumer preferences and health-conscious trends. This includes advancements in packaging, ensuring product freshness and quality. The development of honey-based functional foods and health supplements is also gaining traction, enhancing the market appeal.
Key Drivers of Honey Industry Growth
Several factors are propelling the honey industry's growth trajectory. Technological advancements in beekeeping practices and processing boost efficiency and product quality. Favorable government policies and initiatives, such as the NBHM in India, incentivize honey production and export. The rising demand for natural and healthy food products drives the overall market expansion. Lastly, growing health awareness further enhances honey's appeal as a natural sweetener and functional food.
Challenges in the Honey Industry Market
The honey industry faces significant challenges, including fluctuating honey yields due to environmental factors and bee health issues. Supply chain inefficiencies and counterfeit products pose threats to market stability. Furthermore, intense competition and rising raw material costs impact profitability. The impact of these factors is estimated to result in a xx% reduction in projected growth by 2030.
Emerging Opportunities in Honey Industry
The burgeoning demand for organic and specialized honeys presents significant opportunities. Expanding into new markets and developing innovative honey-based products can unlock significant revenue streams. Strategic partnerships with food manufacturers and healthcare companies broaden the application of honey across various sectors.
Leading Players in the Honey Industry Sector
- Dabur Honey
- Patanjali Ayurved
- Al Kabeer Exports
- Madhu Makkhan
- Zydus Wellness Ltd.
Key Milestones in Honey Industry Industry
- August 2022: India's AtmaNirbhar Bharat initiative allocates INR 500 crore (USD 60.5 million) to the NBHM for three years (2020-21 to 2022-23), boosting domestic honey production.
- May 2024: The Canadian government increases funding for the Honey Bee Health Initiative by USD 1 million to enhance beekeeper operations and combat threats like varroa mites. This initiative positively impacts honey production in Ontario and beyond.
Strategic Outlook for Honey Industry Market
The global honey market presents a significant growth opportunity, driven by shifting consumer preferences and increasing demand for natural food products. Companies focusing on sustainable beekeeping practices, product innovation, and strategic market expansion are poised to capture significant market share. Investment in technology, particularly in bee health and processing, will also play a pivotal role in shaping the future of the honey industry.
Honey Industry Segmentation
- 1. Production Analysis
- 2. Consumption Analysis
- 3. Import Market Analysis (Value & Volume)
- 4. Export Market Analysis (Value & Volume)
- 5. Price Trend Analysis
Honey Industry Segmentation By Geography
-
1. North America
- 1.1. United States
- 1.2. Canada
- 1.3. Mexico
-
2. Europe
- 2.1. Spain
- 2.2. Ukraine
- 2.3. Poland
- 2.4. Germany
-
3. Asia Pacific
- 3.1. China
- 3.2. India
- 3.3. Japan
- 3.4. New Zealand
-
4. South America
- 4.1. Argentina
- 4.2. Brazil
-
5. Middle East and Africa
- 5.1. Turkey
- 5.2. Iran
Honey Industry Regional Market Share
Geographic Coverage of Honey Industry
Honey Industry REPORT HIGHLIGHTS
| Aspects | Details |
|---|---|
| Study Period | 2020-2034 |
| Base Year | 2025 |
| Estimated Year | 2026 |
| Forecast Period | 2026-2034 |
| Historical Period | 2020-2025 |
| Growth Rate | CAGR of 5.20% from 2020-2034 |
| Segmentation |
|
Table of Contents
- 1. Introduction
- 1.1. Research Scope
- 1.2. Market Segmentation
- 1.3. Research Methodology
- 1.4. Definitions and Assumptions
- 2. Executive Summary
- 2.1. Introduction
- 3. Market Dynamics
- 3.1. Introduction
- 3.2. Market Drivers
- 3.2.1. Increasing Demand for Garlic Due to Various Uses in Industries; Rising Demad of Organic Garlic; Increasing Government Initiatives
- 3.3. Market Restrains
- 3.3.1. Lack of Technical Knowledge of Farmers; Price Fluctuations
- 3.4. Market Trends
- 3.4.1. Increasing Demand for Natural Sweeteners with Health Benefits of Natural Honey
- 4. Market Factor Analysis
- 4.1. Porters Five Forces
- 4.2. Supply/Value Chain
- 4.3. PESTEL analysis
- 4.4. Market Entropy
- 4.5. Patent/Trademark Analysis
- 5. Global Honey Industry Analysis, Insights and Forecast, 2020-2032
- 5.1. Market Analysis, Insights and Forecast - by Production Analysis
- 5.2. Market Analysis, Insights and Forecast - by Consumption Analysis
- 5.3. Market Analysis, Insights and Forecast - by Import Market Analysis (Value & Volume)
- 5.4. Market Analysis, Insights and Forecast - by Export Market Analysis (Value & Volume)
- 5.5. Market Analysis, Insights and Forecast - by Price Trend Analysis
- 5.6. Market Analysis, Insights and Forecast - by Region
- 5.6.1. North America
- 5.6.2. Europe
- 5.6.3. Asia Pacific
- 5.6.4. South America
- 5.6.5. Middle East and Africa
- 5.1. Market Analysis, Insights and Forecast - by Production Analysis
- 6. North America Honey Industry Analysis, Insights and Forecast, 2020-2032
- 6.1. Market Analysis, Insights and Forecast - by Production Analysis
- 6.2. Market Analysis, Insights and Forecast - by Consumption Analysis
- 6.3. Market Analysis, Insights and Forecast - by Import Market Analysis (Value & Volume)
- 6.4. Market Analysis, Insights and Forecast - by Export Market Analysis (Value & Volume)
- 6.5. Market Analysis, Insights and Forecast - by Price Trend Analysis
- 6.1. Market Analysis, Insights and Forecast - by Production Analysis
- 7. Europe Honey Industry Analysis, Insights and Forecast, 2020-2032
- 7.1. Market Analysis, Insights and Forecast - by Production Analysis
- 7.2. Market Analysis, Insights and Forecast - by Consumption Analysis
- 7.3. Market Analysis, Insights and Forecast - by Import Market Analysis (Value & Volume)
- 7.4. Market Analysis, Insights and Forecast - by Export Market Analysis (Value & Volume)
- 7.5. Market Analysis, Insights and Forecast - by Price Trend Analysis
- 7.1. Market Analysis, Insights and Forecast - by Production Analysis
- 8. Asia Pacific Honey Industry Analysis, Insights and Forecast, 2020-2032
- 8.1. Market Analysis, Insights and Forecast - by Production Analysis
- 8.2. Market Analysis, Insights and Forecast - by Consumption Analysis
- 8.3. Market Analysis, Insights and Forecast - by Import Market Analysis (Value & Volume)
- 8.4. Market Analysis, Insights and Forecast - by Export Market Analysis (Value & Volume)
- 8.5. Market Analysis, Insights and Forecast - by Price Trend Analysis
- 8.1. Market Analysis, Insights and Forecast - by Production Analysis
- 9. South America Honey Industry Analysis, Insights and Forecast, 2020-2032
- 9.1. Market Analysis, Insights and Forecast - by Production Analysis
- 9.2. Market Analysis, Insights and Forecast - by Consumption Analysis
- 9.3. Market Analysis, Insights and Forecast - by Import Market Analysis (Value & Volume)
- 9.4. Market Analysis, Insights and Forecast - by Export Market Analysis (Value & Volume)
- 9.5. Market Analysis, Insights and Forecast - by Price Trend Analysis
- 9.1. Market Analysis, Insights and Forecast - by Production Analysis
- 10. Middle East and Africa Honey Industry Analysis, Insights and Forecast, 2020-2032
- 10.1. Market Analysis, Insights and Forecast - by Production Analysis
- 10.2. Market Analysis, Insights and Forecast - by Consumption Analysis
- 10.3. Market Analysis, Insights and Forecast - by Import Market Analysis (Value & Volume)
- 10.4. Market Analysis, Insights and Forecast - by Export Market Analysis (Value & Volume)
- 10.5. Market Analysis, Insights and Forecast - by Price Trend Analysis
- 10.1. Market Analysis, Insights and Forecast - by Production Analysis
- 11. Competitive Analysis
- 11.1. Global Market Share Analysis 2025
- 11.2. Company Profiles
- 11.2.1 Dabur Honey
- 11.2.1.1. Overview
- 11.2.1.2. Products
- 11.2.1.3. SWOT Analysis
- 11.2.1.4. Recent Developments
- 11.2.1.5. Financials (Based on Availability)
- 11.2.2 Patanjali Ayurved
- 11.2.2.1. Overview
- 11.2.2.2. Products
- 11.2.2.3. SWOT Analysis
- 11.2.2.4. Recent Developments
- 11.2.2.5. Financials (Based on Availability)
- 11.2.3 Al Kabeer Exports
- 11.2.3.1. Overview
- 11.2.3.2. Products
- 11.2.3.3. SWOT Analysis
- 11.2.3.4. Recent Developments
- 11.2.3.5. Financials (Based on Availability)
- 11.2.4 Madhu Makkhan
- 11.2.4.1. Overview
- 11.2.4.2. Products
- 11.2.4.3. SWOT Analysis
- 11.2.4.4. Recent Developments
- 11.2.4.5. Financials (Based on Availability)
- 11.2.5 Zydus Wellness Ltd.
- 11.2.5.1. Overview
- 11.2.5.2. Products
- 11.2.5.3. SWOT Analysis
- 11.2.5.4. Recent Developments
- 11.2.5.5. Financials (Based on Availability)
- 11.2.1 Dabur Honey
List of Figures
- Figure 1: Global Honey Industry Revenue Breakdown (Billion, %) by Region 2025 & 2033
- Figure 2: North America Honey Industry Revenue (Billion), by Production Analysis 2025 & 2033
- Figure 3: North America Honey Industry Revenue Share (%), by Production Analysis 2025 & 2033
- Figure 4: North America Honey Industry Revenue (Billion), by Consumption Analysis 2025 & 2033
- Figure 5: North America Honey Industry Revenue Share (%), by Consumption Analysis 2025 & 2033
- Figure 6: North America Honey Industry Revenue (Billion), by Import Market Analysis (Value & Volume) 2025 & 2033
- Figure 7: North America Honey Industry Revenue Share (%), by Import Market Analysis (Value & Volume) 2025 & 2033
- Figure 8: North America Honey Industry Revenue (Billion), by Export Market Analysis (Value & Volume) 2025 & 2033
- Figure 9: North America Honey Industry Revenue Share (%), by Export Market Analysis (Value & Volume) 2025 & 2033
- Figure 10: North America Honey Industry Revenue (Billion), by Price Trend Analysis 2025 & 2033
- Figure 11: North America Honey Industry Revenue Share (%), by Price Trend Analysis 2025 & 2033
- Figure 12: North America Honey Industry Revenue (Billion), by Country 2025 & 2033
- Figure 13: North America Honey Industry Revenue Share (%), by Country 2025 & 2033
- Figure 14: Europe Honey Industry Revenue (Billion), by Production Analysis 2025 & 2033
- Figure 15: Europe Honey Industry Revenue Share (%), by Production Analysis 2025 & 2033
- Figure 16: Europe Honey Industry Revenue (Billion), by Consumption Analysis 2025 & 2033
- Figure 17: Europe Honey Industry Revenue Share (%), by Consumption Analysis 2025 & 2033
- Figure 18: Europe Honey Industry Revenue (Billion), by Import Market Analysis (Value & Volume) 2025 & 2033
- Figure 19: Europe Honey Industry Revenue Share (%), by Import Market Analysis (Value & Volume) 2025 & 2033
- Figure 20: Europe Honey Industry Revenue (Billion), by Export Market Analysis (Value & Volume) 2025 & 2033
- Figure 21: Europe Honey Industry Revenue Share (%), by Export Market Analysis (Value & Volume) 2025 & 2033
- Figure 22: Europe Honey Industry Revenue (Billion), by Price Trend Analysis 2025 & 2033
- Figure 23: Europe Honey Industry Revenue Share (%), by Price Trend Analysis 2025 & 2033
- Figure 24: Europe Honey Industry Revenue (Billion), by Country 2025 & 2033
- Figure 25: Europe Honey Industry Revenue Share (%), by Country 2025 & 2033
- Figure 26: Asia Pacific Honey Industry Revenue (Billion), by Production Analysis 2025 & 2033
- Figure 27: Asia Pacific Honey Industry Revenue Share (%), by Production Analysis 2025 & 2033
- Figure 28: Asia Pacific Honey Industry Revenue (Billion), by Consumption Analysis 2025 & 2033
- Figure 29: Asia Pacific Honey Industry Revenue Share (%), by Consumption Analysis 2025 & 2033
- Figure 30: Asia Pacific Honey Industry Revenue (Billion), by Import Market Analysis (Value & Volume) 2025 & 2033
- Figure 31: Asia Pacific Honey Industry Revenue Share (%), by Import Market Analysis (Value & Volume) 2025 & 2033
- Figure 32: Asia Pacific Honey Industry Revenue (Billion), by Export Market Analysis (Value & Volume) 2025 & 2033
- Figure 33: Asia Pacific Honey Industry Revenue Share (%), by Export Market Analysis (Value & Volume) 2025 & 2033
- Figure 34: Asia Pacific Honey Industry Revenue (Billion), by Price Trend Analysis 2025 & 2033
- Figure 35: Asia Pacific Honey Industry Revenue Share (%), by Price Trend Analysis 2025 & 2033
- Figure 36: Asia Pacific Honey Industry Revenue (Billion), by Country 2025 & 2033
- Figure 37: Asia Pacific Honey Industry Revenue Share (%), by Country 2025 & 2033
- Figure 38: South America Honey Industry Revenue (Billion), by Production Analysis 2025 & 2033
- Figure 39: South America Honey Industry Revenue Share (%), by Production Analysis 2025 & 2033
- Figure 40: South America Honey Industry Revenue (Billion), by Consumption Analysis 2025 & 2033
- Figure 41: South America Honey Industry Revenue Share (%), by Consumption Analysis 2025 & 2033
- Figure 42: South America Honey Industry Revenue (Billion), by Import Market Analysis (Value & Volume) 2025 & 2033
- Figure 43: South America Honey Industry Revenue Share (%), by Import Market Analysis (Value & Volume) 2025 & 2033
- Figure 44: South America Honey Industry Revenue (Billion), by Export Market Analysis (Value & Volume) 2025 & 2033
- Figure 45: South America Honey Industry Revenue Share (%), by Export Market Analysis (Value & Volume) 2025 & 2033
- Figure 46: South America Honey Industry Revenue (Billion), by Price Trend Analysis 2025 & 2033
- Figure 47: South America Honey Industry Revenue Share (%), by Price Trend Analysis 2025 & 2033
- Figure 48: South America Honey Industry Revenue (Billion), by Country 2025 & 2033
- Figure 49: South America Honey Industry Revenue Share (%), by Country 2025 & 2033
- Figure 50: Middle East and Africa Honey Industry Revenue (Billion), by Production Analysis 2025 & 2033
- Figure 51: Middle East and Africa Honey Industry Revenue Share (%), by Production Analysis 2025 & 2033
- Figure 52: Middle East and Africa Honey Industry Revenue (Billion), by Consumption Analysis 2025 & 2033
- Figure 53: Middle East and Africa Honey Industry Revenue Share (%), by Consumption Analysis 2025 & 2033
- Figure 54: Middle East and Africa Honey Industry Revenue (Billion), by Import Market Analysis (Value & Volume) 2025 & 2033
- Figure 55: Middle East and Africa Honey Industry Revenue Share (%), by Import Market Analysis (Value & Volume) 2025 & 2033
- Figure 56: Middle East and Africa Honey Industry Revenue (Billion), by Export Market Analysis (Value & Volume) 2025 & 2033
- Figure 57: Middle East and Africa Honey Industry Revenue Share (%), by Export Market Analysis (Value & Volume) 2025 & 2033
- Figure 58: Middle East and Africa Honey Industry Revenue (Billion), by Price Trend Analysis 2025 & 2033
- Figure 59: Middle East and Africa Honey Industry Revenue Share (%), by Price Trend Analysis 2025 & 2033
- Figure 60: Middle East and Africa Honey Industry Revenue (Billion), by Country 2025 & 2033
- Figure 61: Middle East and Africa Honey Industry Revenue Share (%), by Country 2025 & 2033
List of Tables
- Table 1: Global Honey Industry Revenue Billion Forecast, by Production Analysis 2020 & 2033
- Table 2: Global Honey Industry Revenue Billion Forecast, by Consumption Analysis 2020 & 2033
- Table 3: Global Honey Industry Revenue Billion Forecast, by Import Market Analysis (Value & Volume) 2020 & 2033
- Table 4: Global Honey Industry Revenue Billion Forecast, by Export Market Analysis (Value & Volume) 2020 & 2033
- Table 5: Global Honey Industry Revenue Billion Forecast, by Price Trend Analysis 2020 & 2033
- Table 6: Global Honey Industry Revenue Billion Forecast, by Region 2020 & 2033
- Table 7: Global Honey Industry Revenue Billion Forecast, by Production Analysis 2020 & 2033
- Table 8: Global Honey Industry Revenue Billion Forecast, by Consumption Analysis 2020 & 2033
- Table 9: Global Honey Industry Revenue Billion Forecast, by Import Market Analysis (Value & Volume) 2020 & 2033
- Table 10: Global Honey Industry Revenue Billion Forecast, by Export Market Analysis (Value & Volume) 2020 & 2033
- Table 11: Global Honey Industry Revenue Billion Forecast, by Price Trend Analysis 2020 & 2033
- Table 12: Global Honey Industry Revenue Billion Forecast, by Country 2020 & 2033
- Table 13: United States Honey Industry Revenue (Billion) Forecast, by Application 2020 & 2033
- Table 14: Canada Honey Industry Revenue (Billion) Forecast, by Application 2020 & 2033
- Table 15: Mexico Honey Industry Revenue (Billion) Forecast, by Application 2020 & 2033
- Table 16: Global Honey Industry Revenue Billion Forecast, by Production Analysis 2020 & 2033
- Table 17: Global Honey Industry Revenue Billion Forecast, by Consumption Analysis 2020 & 2033
- Table 18: Global Honey Industry Revenue Billion Forecast, by Import Market Analysis (Value & Volume) 2020 & 2033
- Table 19: Global Honey Industry Revenue Billion Forecast, by Export Market Analysis (Value & Volume) 2020 & 2033
- Table 20: Global Honey Industry Revenue Billion Forecast, by Price Trend Analysis 2020 & 2033
- Table 21: Global Honey Industry Revenue Billion Forecast, by Country 2020 & 2033
- Table 22: Spain Honey Industry Revenue (Billion) Forecast, by Application 2020 & 2033
- Table 23: Ukraine Honey Industry Revenue (Billion) Forecast, by Application 2020 & 2033
- Table 24: Poland Honey Industry Revenue (Billion) Forecast, by Application 2020 & 2033
- Table 25: Germany Honey Industry Revenue (Billion) Forecast, by Application 2020 & 2033
- Table 26: Global Honey Industry Revenue Billion Forecast, by Production Analysis 2020 & 2033
- Table 27: Global Honey Industry Revenue Billion Forecast, by Consumption Analysis 2020 & 2033
- Table 28: Global Honey Industry Revenue Billion Forecast, by Import Market Analysis (Value & Volume) 2020 & 2033
- Table 29: Global Honey Industry Revenue Billion Forecast, by Export Market Analysis (Value & Volume) 2020 & 2033
- Table 30: Global Honey Industry Revenue Billion Forecast, by Price Trend Analysis 2020 & 2033
- Table 31: Global Honey Industry Revenue Billion Forecast, by Country 2020 & 2033
- Table 32: China Honey Industry Revenue (Billion) Forecast, by Application 2020 & 2033
- Table 33: India Honey Industry Revenue (Billion) Forecast, by Application 2020 & 2033
- Table 34: Japan Honey Industry Revenue (Billion) Forecast, by Application 2020 & 2033
- Table 35: New Zealand Honey Industry Revenue (Billion) Forecast, by Application 2020 & 2033
- Table 36: Global Honey Industry Revenue Billion Forecast, by Production Analysis 2020 & 2033
- Table 37: Global Honey Industry Revenue Billion Forecast, by Consumption Analysis 2020 & 2033
- Table 38: Global Honey Industry Revenue Billion Forecast, by Import Market Analysis (Value & Volume) 2020 & 2033
- Table 39: Global Honey Industry Revenue Billion Forecast, by Export Market Analysis (Value & Volume) 2020 & 2033
- Table 40: Global Honey Industry Revenue Billion Forecast, by Price Trend Analysis 2020 & 2033
- Table 41: Global Honey Industry Revenue Billion Forecast, by Country 2020 & 2033
- Table 42: Argentina Honey Industry Revenue (Billion) Forecast, by Application 2020 & 2033
- Table 43: Brazil Honey Industry Revenue (Billion) Forecast, by Application 2020 & 2033
- Table 44: Global Honey Industry Revenue Billion Forecast, by Production Analysis 2020 & 2033
- Table 45: Global Honey Industry Revenue Billion Forecast, by Consumption Analysis 2020 & 2033
- Table 46: Global Honey Industry Revenue Billion Forecast, by Import Market Analysis (Value & Volume) 2020 & 2033
- Table 47: Global Honey Industry Revenue Billion Forecast, by Export Market Analysis (Value & Volume) 2020 & 2033
- Table 48: Global Honey Industry Revenue Billion Forecast, by Price Trend Analysis 2020 & 2033
- Table 49: Global Honey Industry Revenue Billion Forecast, by Country 2020 & 2033
- Table 50: Turkey Honey Industry Revenue (Billion) Forecast, by Application 2020 & 2033
- Table 51: Iran Honey Industry Revenue (Billion) Forecast, by Application 2020 & 2033
Frequently Asked Questions
1. What is the projected Compound Annual Growth Rate (CAGR) of the Honey Industry?
The projected CAGR is approximately 5.20%.
2. Which companies are prominent players in the Honey Industry?
Key companies in the market include Dabur Honey , Patanjali Ayurved , Al Kabeer Exports , Madhu Makkhan, Zydus Wellness Ltd. .
3. What are the main segments of the Honey Industry?
The market segments include Production Analysis, Consumption Analysis, Import Market Analysis (Value & Volume), Export Market Analysis (Value & Volume), Price Trend Analysis.
4. Can you provide details about the market size?
The market size is estimated to be USD 11.08 Billion as of 2022.
5. What are some drivers contributing to market growth?
Increasing Demand for Garlic Due to Various Uses in Industries; Rising Demad of Organic Garlic; Increasing Government Initiatives.
6. What are the notable trends driving market growth?
Increasing Demand for Natural Sweeteners with Health Benefits of Natural Honey.
7. Are there any restraints impacting market growth?
Lack of Technical Knowledge of Farmers; Price Fluctuations.
8. Can you provide examples of recent developments in the market?
May 2024: The government of Canada is increasing funding to the Honey Bee Health Initiative by up to USD 1 million to help improve the resiliency and competitiveness of beekeeper operations in Ontario. The additional funding will help more Ontario beekeepers better protect their colonies over the winter and protect against invasive pests such as varroa mites which pose a serious threat to honeybee health.
9. What pricing options are available for accessing the report?
Pricing options include single-user, multi-user, and enterprise licenses priced at USD 4750, USD 5250, and USD 8750 respectively.
10. Is the market size provided in terms of value or volume?
The market size is provided in terms of value, measured in Billion.
11. Are there any specific market keywords associated with the report?
Yes, the market keyword associated with the report is "Honey Industry," which aids in identifying and referencing the specific market segment covered.
12. How do I determine which pricing option suits my needs best?
The pricing options vary based on user requirements and access needs. Individual users may opt for single-user licenses, while businesses requiring broader access may choose multi-user or enterprise licenses for cost-effective access to the report.
13. Are there any additional resources or data provided in the Honey Industry report?
While the report offers comprehensive insights, it's advisable to review the specific contents or supplementary materials provided to ascertain if additional resources or data are available.
14. How can I stay updated on further developments or reports in the Honey Industry?
To stay informed about further developments, trends, and reports in the Honey Industry, consider subscribing to industry newsletters, following relevant companies and organizations, or regularly checking reputable industry news sources and publications.
Methodology
Step 1 - Identification of Relevant Samples Size from Population Database


Step 2 - Approaches for Defining Global Market Size (Value, Volume* & Price*)

Note*: In applicable scenarios
Step 3 - Data Sources
Primary Research
- Web Analytics
- Survey Reports
- Research Institute
- Latest Research Reports
- Opinion Leaders
Secondary Research
- Annual Reports
- White Paper
- Latest Press Release
- Industry Association
- Paid Database
- Investor Presentations

Step 4 - Data Triangulation
Involves using different sources of information in order to increase the validity of a study
These sources are likely to be stakeholders in a program - participants, other researchers, program staff, other community members, and so on.
Then we put all data in single framework & apply various statistical tools to find out the dynamic on the market.
During the analysis stage, feedback from the stakeholder groups would be compared to determine areas of agreement as well as areas of divergence