

Key Insights
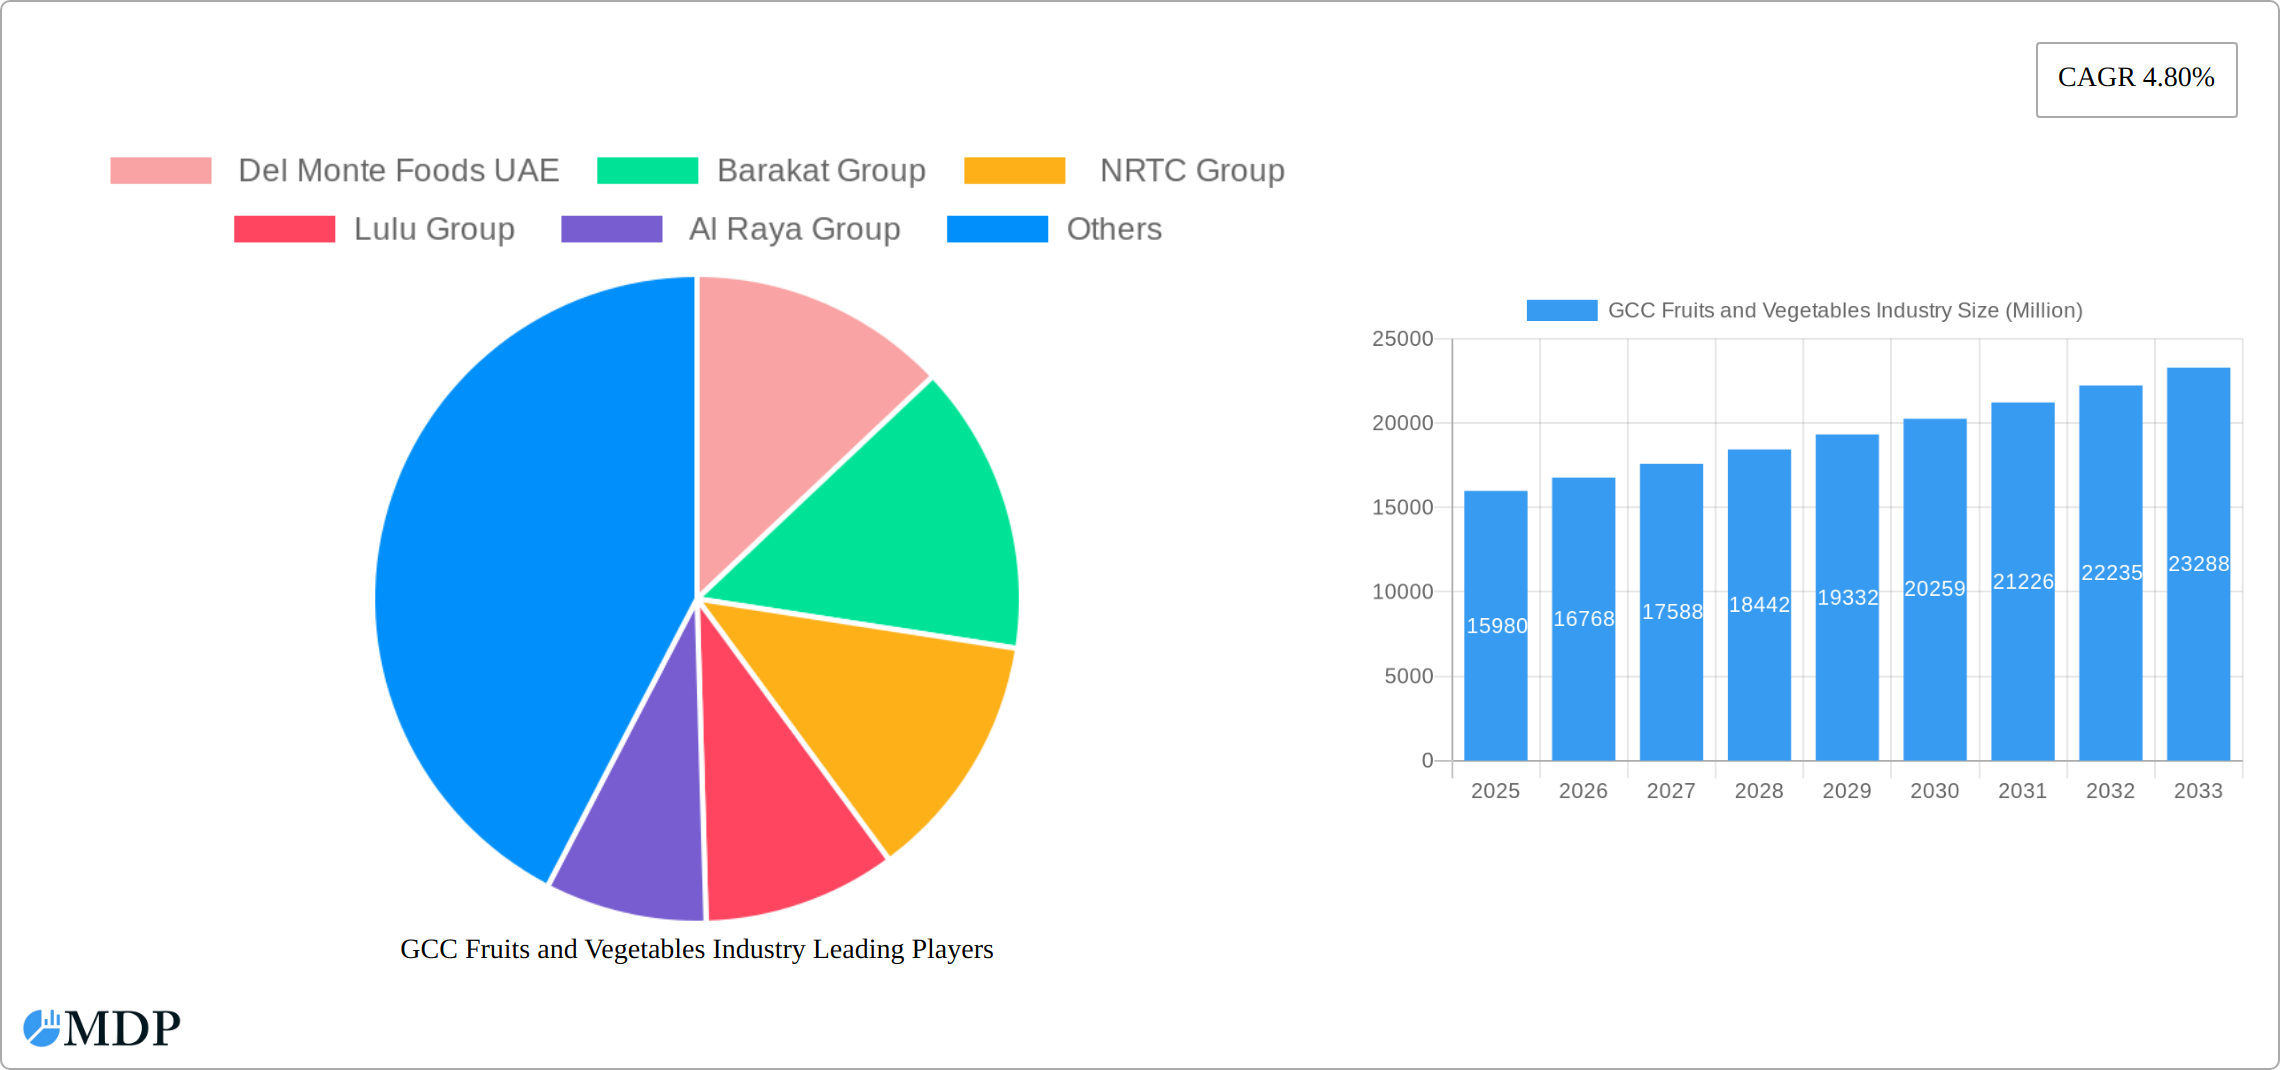
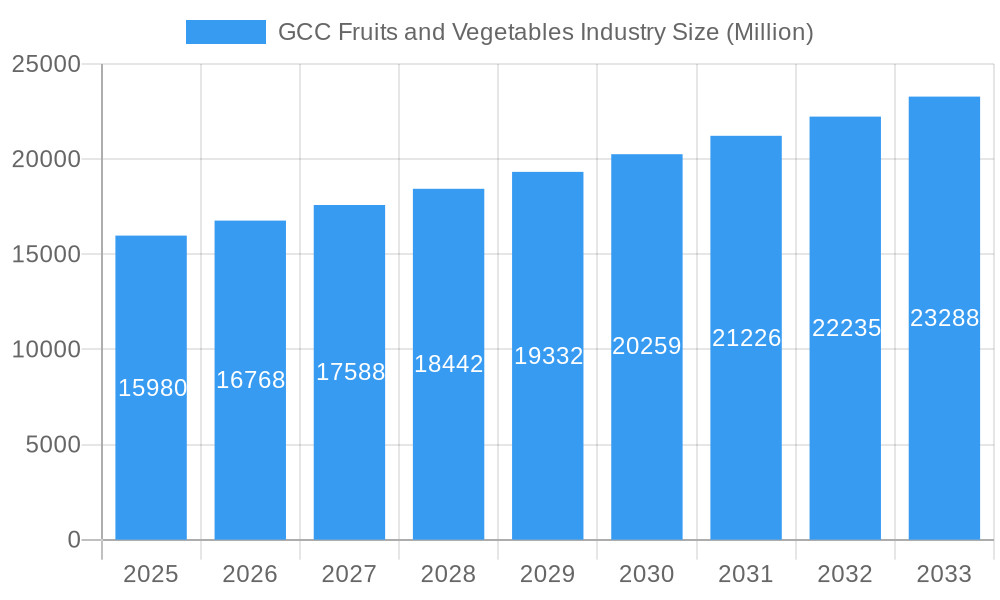
The GCC fruits and vegetables market, valued at $15.98 billion in 2025, is projected to experience robust growth, driven by a rising population, increasing health consciousness, and a shift towards convenient, ready-to-eat options. The market's Compound Annual Growth Rate (CAGR) of 4.80% from 2019 to 2024 indicates a steady upward trajectory, expected to continue through 2033. Key growth drivers include the expanding food service sector (restaurants and catering), the rising popularity of processed fruits and vegetables, and the increasing penetration of e-commerce platforms for grocery shopping. Supermarkets and hypermarkets currently dominate distribution channels, but traditional markets maintain a significant presence, particularly in reaching price-sensitive consumers. The increasing adoption of modern retail formats and the expansion of cold chain infrastructure will further fuel market growth. However, challenges such as seasonal fluctuations in supply, price volatility, and maintaining food safety and quality standards represent potential restraints. Furthermore, competition among established players like Del Monte Foods UAE, Barakat Group, and Lulu Group, along with the emergence of new entrants, will shape the competitive landscape. Significant opportunities exist for companies focusing on sustainable sourcing, innovative packaging, and value-added products catering to the evolving consumer preferences. The expanding tourism sector in the GCC also positively impacts demand, particularly for fresh produce.
GCC Fruits and Vegetables Industry Market Size (In Billion)
The segmentation analysis reveals the dominance of fresh produce (fruits and vegetables) within the market. However, the processed fruits and vegetables segment is anticipated to witness faster growth due to its convenience and extended shelf life. Household consumption constitutes the largest end-use segment, followed by food processing and the hospitality industry. Geographic analysis would show varying growth rates across the GCC countries, with potentially higher growth in regions experiencing rapid urbanization and economic development. The industry's success hinges on addressing challenges related to efficient supply chains, waste reduction, and consumer education on the nutritional benefits of fruits and vegetables. Strategic investments in technology, infrastructure, and marketing will be crucial for players seeking to capitalize on the market's potential and gain a competitive edge.
GCC Fruits and Vegetables Industry Company Market Share
GCC Fruits and Vegetables Industry: A Comprehensive Market Report (2019-2033)
This in-depth report provides a comprehensive analysis of the GCC fruits and vegetables industry, offering invaluable insights for stakeholders seeking to navigate this dynamic market. With a focus on the period 2019-2033, including a base year of 2025 and a forecast period of 2025-2033, this report covers market size, growth drivers, challenges, opportunities, and key players. The report leverages data from the historical period (2019-2024) and incorporates recent developments to provide a forward-looking perspective on the industry's trajectory. Discover actionable insights into market dynamics, leading segments, and strategic opportunities to thrive in this lucrative sector. The report covers key players such as Del Monte Foods UAE, Barakat Group, NRTC Group, Lulu Group, Al Raya Group, Al-Futtaim Group, Al Bakrawe Group, Fresh Fruits Company, SPAR, and Carrefour. Expected market value in 2025 is estimated at xx Million.
GCC Fruits and Vegetables Industry Market Dynamics & Concentration
The GCC fruits and vegetables market is characterized by a moderately concentrated landscape, with a few large players commanding significant market share. Market concentration is influenced by factors such as economies of scale, strong brand recognition, and efficient distribution networks. Key players like Lulu Group and Al-Futtaim Group have expanded their reach through strategic acquisitions and investments, driving consolidation within the sector. However, smaller regional players also contribute significantly, especially in traditional market channels.
- Market Share: Lulu Group and Al-Futtaim Group hold approximately xx% and yy% market share respectively (estimated 2025).
- M&A Activities: The number of M&A deals in the sector has shown a steady increase over the past five years, reaching xx deals in 2024. This highlights the ongoing consolidation and expansion within the industry.
- Innovation Drivers: Technological advancements in areas like cold chain logistics, packaging technology, and traceability are driving innovation and improving efficiency across the value chain.
- Regulatory Frameworks: Government initiatives promoting food safety, traceability, and sustainable agricultural practices are shaping industry standards and driving investments in technology.
- Product Substitutes: The increasing popularity of processed and convenient food options presents a challenge to the fresh produce segment, necessitating innovation in product offerings and marketing strategies.
- End-User Trends: A growing preference for healthy and convenient food options, driven by increasing health awareness, is boosting demand for fresh fruits and vegetables, particularly within the household consumption segment.
GCC Fruits and Vegetables Industry Industry Trends & Analysis
The GCC fruits and vegetables market is experiencing dynamic growth, propelled by a confluence of factors including a burgeoning population, escalating disposable incomes, rapid urbanization, and a pronounced societal shift towards healthier lifestyles and conscious consumption. The landscape is actively transforming with a significant move towards organized retail channels, where supermarkets and hypermarkets are steadily capturing market share from traditional, fragmented markets. Concurrently, the burgeoning influence of e-commerce is unlocking novel avenues for market expansion and consumer engagement.
The Compound Annual Growth Rate (CAGR) for the GCC fruits and vegetables market during the projected forecast period (2025-2033) is anticipated to be **[Insert specific CAGR percentage here, e.g., XX%]**. This upward trajectory is further amplified by the flourishing tourism and hospitality sectors, which continuously drive demand for high-quality fresh produce. The market penetration of processed fruits and vegetables is also poised for considerable growth in the forthcoming years. Groundbreaking technological advancements, particularly in areas such as hydroponics and vertical farming, are set to revolutionize the industry by enhancing production efficiency, optimizing resource utilization, and mitigating reliance on conventional agricultural practices. Consumer preferences are demonstrably pivoting towards organic and sustainably produced fruits and vegetables, presenting lucrative opportunities for producers who champion these ethical and environmental values. The competitive ecosystem is intricately shaped by strategic pricing models, extensive product diversification, and robust brand building initiatives.
Leading Markets & Segments in GCC Fruits and Vegetables Industry
The UAE and Saudi Arabia are the leading markets within the GCC region, driven by strong economic growth, higher disposable incomes, and robust retail infrastructure. The fresh fruits segment is the largest product type, followed by fresh vegetables and then processed fruits and vegetables. Supermarkets and hypermarkets dominate the distribution channels, with traditional markets still playing a significant role, especially in smaller cities and towns. Household consumption is the largest end-use segment, followed by food processing and restaurants/catering.
- Key Drivers of Dominance:
- UAE and Saudi Arabia: Strong economic growth, high disposable incomes, advanced retail infrastructure, and a large expatriate population.
- Fresh Fruits Segment: High consumer preference for fresh fruits, diverse product availability, and suitability for various consumption occasions.
- Supermarkets and Hypermarkets: Organized retail formats offer convenient shopping experiences, wider product range, and improved quality control.
- Household Consumption: A large population base and growing preference for healthy food choices drive high household consumption of fruits and vegetables.
GCC Fruits and Vegetables Industry Product Developments
Recent innovations in the GCC fruits and vegetables industry include ready-to-eat fruit and vegetable salads, value-added products with enhanced nutritional benefits, and improved packaging solutions that enhance shelf life and maintain product freshness. Technological advancements such as smart farming technologies and improved cold chain logistics are also enhancing the overall efficiency and quality of the product. These developments cater to the increasing demand for convenience, quality, and nutritional value among consumers.
Key Drivers of GCC Fruits and Vegetables Industry Growth
The sustained growth of the GCC fruits and vegetables industry is underpinned by a potent mix of factors. These include a growing population and accelerating urbanization, leading to increased demand for essential food items. Rising disposable incomes directly translate to a higher propensity to spend on food, including premium and fresh produce. Furthermore, a demonstrably health-conscious demographic is actively seeking nutritious food choices, thereby boosting the demand for fruits and vegetables. Government-backed initiatives aimed at fostering agricultural development and enhancing food security are also playing a pivotal role, complemented by strategic investments in modernizing supply chain infrastructure. The proliferation of e-commerce platforms and the expansion of organized retail are further contributing to market growth and accessibility.
Challenges in the GCC Fruits and Vegetables Industry Market
Challenges faced by the GCC fruits and vegetables industry include the high dependence on imports, price volatility due to fluctuations in global supply, and stringent food safety regulations requiring significant investments in compliance. Supply chain inefficiencies, such as post-harvest losses and inadequate cold storage facilities, further impact profitability. The industry also faces competition from cheaper imported products and the need to manage seasonal variations in production.
Emerging Opportunities in GCC Fruits and Vegetables Industry
The GCC fruits and vegetables sector presents a fertile ground for significant growth opportunities. A prime area for expansion lies within the burgeoning market for organic and sustainably grown produce, catering to an increasingly health-aware consumer base. Embracing advanced technologies for enhanced traceability and stringent food safety measures will be instrumental in building consumer trust and solidifying market penetration. Forging strategic alliances with local farmers and distributors can fortify supply chains, reduce dependency on imports, and ensure consistent availability. The exploration and adoption of innovative farming techniques like vertical farming and hydroponics offer substantial potential to optimize water usage and boost production efficiency, particularly in arid environments characteristic of the GCC region.
Leading Players in the GCC Fruits and Vegetables Industry Sector
- Del Monte Foods UAE
- Barakat Group
- NRTC Group
- Lulu Group
- Al Raya Group
- Al-Futtaim Group
- Al Bakrawe Group
- Fresh Fruits Company
- SPAR
- Carrefour
Key Milestones in GCC Fruits and Vegetables Industry Industry
- February 2024: Lulu Group marked a significant expansion with the opening of its 23rd hypermarket in Doha Mall, Qatar. This new outlet features an extensive and diverse selection of fresh produce and introduced a new customer loyalty program, underscoring the growth of organized retail and intensified market competition.
- February 2024: SPAR Oman continued its growth trajectory by expanding its retail presence with a new outlet in Al Muna Bousher. This expansion directly addresses the escalating demand for fresh produce across Oman and increases product accessibility for consumers.
- February 2024: Carrefour launched its impactful 'Choose Better' program, actively promoting healthier and more sustainable food choices among its customers. This initiative aligns with prevailing consumer trends emphasizing health and sustainability, strategically positioning Carrefour as a frontrunner in offering responsible retail options.
Strategic Outlook for GCC Fruits and Vegetables Industry Market
The GCC fruits and vegetables industry is poised for substantial and sustained growth, propelled by favorable demographic trends, increasing consumer purchasing power, and a heightened societal emphasis on healthy diets. Strategic imperatives for market players include the imperative to enhance supply chain efficiency, significant investment in cutting-edge technologies for optimizing production and preservation methods, and a dedicated focus on meeting the escalating demand for organic and ethically sourced products. Further unlocking the market's considerable potential will be achieved through strategic expansion into the e-commerce domain and a concentrated effort on developing and promoting value-added fruit and vegetable products.
GCC Fruits and Vegetables Industry Segmentation
- 1. Production Analysis
- 2. Consumption Analysis
- 3. Import Market Analysis (Value & Volume)
- 4. Export Market Analysis (Value & Volume)
- 5. Price Trend Analysis
GCC Fruits and Vegetables Industry Segmentation By Geography
-
1. United Arab Emirates
- 1.1. Fruits
- 1.2. Vegetables
-
2. Bahrain
- 2.1. Fruits
- 2.2. Vegetables
-
3. Kuwait
- 3.1. Fruits
- 3.2. Vegetables
-
4. Oman
- 4.1. Fruits
- 4.2. Vegetables
-
5. Qatar
- 5.1. Fruits
- 5.2. Vegetables
-
6. Saudi Arabia
- 6.1. Fruits
- 6.2. Vegetables
GCC Fruits and Vegetables Industry Regional Market Share
Geographic Coverage of GCC Fruits and Vegetables Industry
GCC Fruits and Vegetables Industry REPORT HIGHLIGHTS
| Aspects | Details |
|---|---|
| Study Period | 2020-2034 |
| Base Year | 2025 |
| Estimated Year | 2026 |
| Forecast Period | 2026-2034 |
| Historical Period | 2020-2025 |
| Growth Rate | CAGR of 4.80% from 2020-2034 |
| Segmentation |
|
Table of Contents
- 1. Introduction
- 1.1. Research Scope
- 1.2. Market Segmentation
- 1.3. Research Objective
- 1.4. Definitions and Assumptions
- 2. Executive Summary
- 2.1. Market Snapshot
- 3. Market Dynamics
- 3.1. Market Drivers
- 3.2. Market Restrains
- 3.3. Market Trends
- 3.4. Market Opportunities
- 4. Market Factor Analysis
- 4.1. Porters Five Forces
- 4.1.1. Bargaining Power of Suppliers
- 4.1.2. Bargaining Power of Buyers
- 4.1.3. Threat of New Entrants
- 4.1.4. Threat of Substitutes
- 4.1.5. Competitive Rivalry
- 4.2. PESTEL analysis
- 4.3. BCG Analysis
- 4.3.1. Stars (High Growth, High Market Share)
- 4.3.2. Cash Cows (Low Growth, High Market Share)
- 4.3.3. Question Mark (High Growth, Low Market Share)
- 4.3.4. Dogs (Low Growth, Low Market Share)
- 4.4. Ansoff Matrix Analysis
- 4.5. Supply Chain Analysis
- 4.6. Regulatory Landscape
- 4.7. Current Market Potential and Opportunity Assessment (TAM–SAM–SOM Framework)
- 4.8. MDP Analyst Note
- 4.1. Porters Five Forces
- 5. Market Analysis, Insights and Forecast 2021-2033
- 5.1. Market Analysis, Insights and Forecast - by Production Analysis
- 5.2. Market Analysis, Insights and Forecast - by Consumption Analysis
- 5.3. Market Analysis, Insights and Forecast - by Import Market Analysis (Value & Volume)
- 5.4. Market Analysis, Insights and Forecast - by Export Market Analysis (Value & Volume)
- 5.5. Market Analysis, Insights and Forecast - by Price Trend Analysis
- 5.6. Market Analysis, Insights and Forecast - by Region
- 5.6.1. United Arab Emirates
- 5.6.2. Bahrain
- 5.6.3. Kuwait
- 5.6.4. Oman
- 5.6.5. Qatar
- 5.6.6. Saudi Arabia
- 6. Global GCC Fruits and Vegetables Industry Analysis, Insights and Forecast, 2021-2033
- 6.1. Market Analysis, Insights and Forecast - by Production Analysis
- 6.2. Market Analysis, Insights and Forecast - by Consumption Analysis
- 6.3. Market Analysis, Insights and Forecast - by Import Market Analysis (Value & Volume)
- 6.4. Market Analysis, Insights and Forecast - by Export Market Analysis (Value & Volume)
- 6.5. Market Analysis, Insights and Forecast - by Price Trend Analysis
- 7. United Arab Emirates GCC Fruits and Vegetables Industry Analysis, Insights and Forecast, 2020-2032
- 7.1. Market Analysis, Insights and Forecast - by Production Analysis
- 7.2. Market Analysis, Insights and Forecast - by Consumption Analysis
- 7.3. Market Analysis, Insights and Forecast - by Import Market Analysis (Value & Volume)
- 7.4. Market Analysis, Insights and Forecast - by Export Market Analysis (Value & Volume)
- 7.5. Market Analysis, Insights and Forecast - by Price Trend Analysis
- 8. Bahrain GCC Fruits and Vegetables Industry Analysis, Insights and Forecast, 2020-2032
- 8.1. Market Analysis, Insights and Forecast - by Production Analysis
- 8.2. Market Analysis, Insights and Forecast - by Consumption Analysis
- 8.3. Market Analysis, Insights and Forecast - by Import Market Analysis (Value & Volume)
- 8.4. Market Analysis, Insights and Forecast - by Export Market Analysis (Value & Volume)
- 8.5. Market Analysis, Insights and Forecast - by Price Trend Analysis
- 9. Kuwait GCC Fruits and Vegetables Industry Analysis, Insights and Forecast, 2020-2032
- 9.1. Market Analysis, Insights and Forecast - by Production Analysis
- 9.2. Market Analysis, Insights and Forecast - by Consumption Analysis
- 9.3. Market Analysis, Insights and Forecast - by Import Market Analysis (Value & Volume)
- 9.4. Market Analysis, Insights and Forecast - by Export Market Analysis (Value & Volume)
- 9.5. Market Analysis, Insights and Forecast - by Price Trend Analysis
- 10. Oman GCC Fruits and Vegetables Industry Analysis, Insights and Forecast, 2020-2032
- 10.1. Market Analysis, Insights and Forecast - by Production Analysis
- 10.2. Market Analysis, Insights and Forecast - by Consumption Analysis
- 10.3. Market Analysis, Insights and Forecast - by Import Market Analysis (Value & Volume)
- 10.4. Market Analysis, Insights and Forecast - by Export Market Analysis (Value & Volume)
- 10.5. Market Analysis, Insights and Forecast - by Price Trend Analysis
- 11. Qatar GCC Fruits and Vegetables Industry Analysis, Insights and Forecast, 2020-2032
- 11.1. Market Analysis, Insights and Forecast - by Production Analysis
- 11.2. Market Analysis, Insights and Forecast - by Consumption Analysis
- 11.3. Market Analysis, Insights and Forecast - by Import Market Analysis (Value & Volume)
- 11.4. Market Analysis, Insights and Forecast - by Export Market Analysis (Value & Volume)
- 11.5. Market Analysis, Insights and Forecast - by Price Trend Analysis
- 12. Saudi Arabia GCC Fruits and Vegetables Industry Analysis, Insights and Forecast, 2020-2032
- 12.1. Market Analysis, Insights and Forecast - by Production Analysis
- 12.2. Market Analysis, Insights and Forecast - by Consumption Analysis
- 12.3. Market Analysis, Insights and Forecast - by Import Market Analysis (Value & Volume)
- 12.4. Market Analysis, Insights and Forecast - by Export Market Analysis (Value & Volume)
- 12.5. Market Analysis, Insights and Forecast - by Price Trend Analysis
- 13. Competitive Analysis
- 13.1. Company Profiles
- 13.1.1 Del Monte Foods UAE
- 13.1.1.1. Company Overview
- 13.1.1.2. Products
- 13.1.1.3. Company Financials
- 13.1.1.4. SWOT Analysis
- 13.1.2 Barakat Group
- 13.1.2.1. Company Overview
- 13.1.2.2. Products
- 13.1.2.3. Company Financials
- 13.1.2.4. SWOT Analysis
- 13.1.3 NRTC Group
- 13.1.3.1. Company Overview
- 13.1.3.2. Products
- 13.1.3.3. Company Financials
- 13.1.3.4. SWOT Analysis
- 13.1.4 Lulu Group
- 13.1.4.1. Company Overview
- 13.1.4.2. Products
- 13.1.4.3. Company Financials
- 13.1.4.4. SWOT Analysis
- 13.1.5 Al Raya Group
- 13.1.5.1. Company Overview
- 13.1.5.2. Products
- 13.1.5.3. Company Financials
- 13.1.5.4. SWOT Analysis
- 13.1.6 Al-Futtaim Group
- 13.1.6.1. Company Overview
- 13.1.6.2. Products
- 13.1.6.3. Company Financials
- 13.1.6.4. SWOT Analysis
- 13.1.7 Al Bakrawe Group
- 13.1.7.1. Company Overview
- 13.1.7.2. Products
- 13.1.7.3. Company Financials
- 13.1.7.4. SWOT Analysis
- 13.1.8 Fresh Fruits Company
- 13.1.8.1. Company Overview
- 13.1.8.2. Products
- 13.1.8.3. Company Financials
- 13.1.8.4. SWOT Analysis
- 13.1.9 SPAR
- 13.1.9.1. Company Overview
- 13.1.9.2. Products
- 13.1.9.3. Company Financials
- 13.1.9.4. SWOT Analysis
- 13.1.10 Carrefour
- 13.1.10.1. Company Overview
- 13.1.10.2. Products
- 13.1.10.3. Company Financials
- 13.1.10.4. SWOT Analysis
- 13.1.1 Del Monte Foods UAE
- 13.2. Market Entropy
- 13.2.1 Company's Key Areas Served
- 13.2.2 Recent Developments
- 13.3. Company Market Share Analysis 2025
- 13.3.1 Top 5 Companies Market Share Analysis
- 13.3.2 Top 3 Companies Market Share Analysis
- 13.4. List of Potential Customers
- 14. Research Methodology
List of Figures
- Figure 1: Global GCC Fruits and Vegetables Industry Revenue Breakdown (Million, %) by Region 2025 & 2033
- Figure 2: Global GCC Fruits and Vegetables Industry Volume Breakdown (Kiloton, %) by Region 2025 & 2033
- Figure 3: United Arab Emirates GCC Fruits and Vegetables Industry Revenue (Million), by Production Analysis 2025 & 2033
- Figure 4: United Arab Emirates GCC Fruits and Vegetables Industry Volume (Kiloton), by Production Analysis 2025 & 2033
- Figure 5: United Arab Emirates GCC Fruits and Vegetables Industry Revenue Share (%), by Production Analysis 2025 & 2033
- Figure 6: United Arab Emirates GCC Fruits and Vegetables Industry Volume Share (%), by Production Analysis 2025 & 2033
- Figure 7: United Arab Emirates GCC Fruits and Vegetables Industry Revenue (Million), by Consumption Analysis 2025 & 2033
- Figure 8: United Arab Emirates GCC Fruits and Vegetables Industry Volume (Kiloton), by Consumption Analysis 2025 & 2033
- Figure 9: United Arab Emirates GCC Fruits and Vegetables Industry Revenue Share (%), by Consumption Analysis 2025 & 2033
- Figure 10: United Arab Emirates GCC Fruits and Vegetables Industry Volume Share (%), by Consumption Analysis 2025 & 2033
- Figure 11: United Arab Emirates GCC Fruits and Vegetables Industry Revenue (Million), by Import Market Analysis (Value & Volume) 2025 & 2033
- Figure 12: United Arab Emirates GCC Fruits and Vegetables Industry Volume (Kiloton), by Import Market Analysis (Value & Volume) 2025 & 2033
- Figure 13: United Arab Emirates GCC Fruits and Vegetables Industry Revenue Share (%), by Import Market Analysis (Value & Volume) 2025 & 2033
- Figure 14: United Arab Emirates GCC Fruits and Vegetables Industry Volume Share (%), by Import Market Analysis (Value & Volume) 2025 & 2033
- Figure 15: United Arab Emirates GCC Fruits and Vegetables Industry Revenue (Million), by Export Market Analysis (Value & Volume) 2025 & 2033
- Figure 16: United Arab Emirates GCC Fruits and Vegetables Industry Volume (Kiloton), by Export Market Analysis (Value & Volume) 2025 & 2033
- Figure 17: United Arab Emirates GCC Fruits and Vegetables Industry Revenue Share (%), by Export Market Analysis (Value & Volume) 2025 & 2033
- Figure 18: United Arab Emirates GCC Fruits and Vegetables Industry Volume Share (%), by Export Market Analysis (Value & Volume) 2025 & 2033
- Figure 19: United Arab Emirates GCC Fruits and Vegetables Industry Revenue (Million), by Price Trend Analysis 2025 & 2033
- Figure 20: United Arab Emirates GCC Fruits and Vegetables Industry Volume (Kiloton), by Price Trend Analysis 2025 & 2033
- Figure 21: United Arab Emirates GCC Fruits and Vegetables Industry Revenue Share (%), by Price Trend Analysis 2025 & 2033
- Figure 22: United Arab Emirates GCC Fruits and Vegetables Industry Volume Share (%), by Price Trend Analysis 2025 & 2033
- Figure 23: United Arab Emirates GCC Fruits and Vegetables Industry Revenue (Million), by Country 2025 & 2033
- Figure 24: United Arab Emirates GCC Fruits and Vegetables Industry Volume (Kiloton), by Country 2025 & 2033
- Figure 25: United Arab Emirates GCC Fruits and Vegetables Industry Revenue Share (%), by Country 2025 & 2033
- Figure 26: United Arab Emirates GCC Fruits and Vegetables Industry Volume Share (%), by Country 2025 & 2033
- Figure 27: Bahrain GCC Fruits and Vegetables Industry Revenue (Million), by Production Analysis 2025 & 2033
- Figure 28: Bahrain GCC Fruits and Vegetables Industry Volume (Kiloton), by Production Analysis 2025 & 2033
- Figure 29: Bahrain GCC Fruits and Vegetables Industry Revenue Share (%), by Production Analysis 2025 & 2033
- Figure 30: Bahrain GCC Fruits and Vegetables Industry Volume Share (%), by Production Analysis 2025 & 2033
- Figure 31: Bahrain GCC Fruits and Vegetables Industry Revenue (Million), by Consumption Analysis 2025 & 2033
- Figure 32: Bahrain GCC Fruits and Vegetables Industry Volume (Kiloton), by Consumption Analysis 2025 & 2033
- Figure 33: Bahrain GCC Fruits and Vegetables Industry Revenue Share (%), by Consumption Analysis 2025 & 2033
- Figure 34: Bahrain GCC Fruits and Vegetables Industry Volume Share (%), by Consumption Analysis 2025 & 2033
- Figure 35: Bahrain GCC Fruits and Vegetables Industry Revenue (Million), by Import Market Analysis (Value & Volume) 2025 & 2033
- Figure 36: Bahrain GCC Fruits and Vegetables Industry Volume (Kiloton), by Import Market Analysis (Value & Volume) 2025 & 2033
- Figure 37: Bahrain GCC Fruits and Vegetables Industry Revenue Share (%), by Import Market Analysis (Value & Volume) 2025 & 2033
- Figure 38: Bahrain GCC Fruits and Vegetables Industry Volume Share (%), by Import Market Analysis (Value & Volume) 2025 & 2033
- Figure 39: Bahrain GCC Fruits and Vegetables Industry Revenue (Million), by Export Market Analysis (Value & Volume) 2025 & 2033
- Figure 40: Bahrain GCC Fruits and Vegetables Industry Volume (Kiloton), by Export Market Analysis (Value & Volume) 2025 & 2033
- Figure 41: Bahrain GCC Fruits and Vegetables Industry Revenue Share (%), by Export Market Analysis (Value & Volume) 2025 & 2033
- Figure 42: Bahrain GCC Fruits and Vegetables Industry Volume Share (%), by Export Market Analysis (Value & Volume) 2025 & 2033
- Figure 43: Bahrain GCC Fruits and Vegetables Industry Revenue (Million), by Price Trend Analysis 2025 & 2033
- Figure 44: Bahrain GCC Fruits and Vegetables Industry Volume (Kiloton), by Price Trend Analysis 2025 & 2033
- Figure 45: Bahrain GCC Fruits and Vegetables Industry Revenue Share (%), by Price Trend Analysis 2025 & 2033
- Figure 46: Bahrain GCC Fruits and Vegetables Industry Volume Share (%), by Price Trend Analysis 2025 & 2033
- Figure 47: Bahrain GCC Fruits and Vegetables Industry Revenue (Million), by Country 2025 & 2033
- Figure 48: Bahrain GCC Fruits and Vegetables Industry Volume (Kiloton), by Country 2025 & 2033
- Figure 49: Bahrain GCC Fruits and Vegetables Industry Revenue Share (%), by Country 2025 & 2033
- Figure 50: Bahrain GCC Fruits and Vegetables Industry Volume Share (%), by Country 2025 & 2033
- Figure 51: Kuwait GCC Fruits and Vegetables Industry Revenue (Million), by Production Analysis 2025 & 2033
- Figure 52: Kuwait GCC Fruits and Vegetables Industry Volume (Kiloton), by Production Analysis 2025 & 2033
- Figure 53: Kuwait GCC Fruits and Vegetables Industry Revenue Share (%), by Production Analysis 2025 & 2033
- Figure 54: Kuwait GCC Fruits and Vegetables Industry Volume Share (%), by Production Analysis 2025 & 2033
- Figure 55: Kuwait GCC Fruits and Vegetables Industry Revenue (Million), by Consumption Analysis 2025 & 2033
- Figure 56: Kuwait GCC Fruits and Vegetables Industry Volume (Kiloton), by Consumption Analysis 2025 & 2033
- Figure 57: Kuwait GCC Fruits and Vegetables Industry Revenue Share (%), by Consumption Analysis 2025 & 2033
- Figure 58: Kuwait GCC Fruits and Vegetables Industry Volume Share (%), by Consumption Analysis 2025 & 2033
- Figure 59: Kuwait GCC Fruits and Vegetables Industry Revenue (Million), by Import Market Analysis (Value & Volume) 2025 & 2033
- Figure 60: Kuwait GCC Fruits and Vegetables Industry Volume (Kiloton), by Import Market Analysis (Value & Volume) 2025 & 2033
- Figure 61: Kuwait GCC Fruits and Vegetables Industry Revenue Share (%), by Import Market Analysis (Value & Volume) 2025 & 2033
- Figure 62: Kuwait GCC Fruits and Vegetables Industry Volume Share (%), by Import Market Analysis (Value & Volume) 2025 & 2033
- Figure 63: Kuwait GCC Fruits and Vegetables Industry Revenue (Million), by Export Market Analysis (Value & Volume) 2025 & 2033
- Figure 64: Kuwait GCC Fruits and Vegetables Industry Volume (Kiloton), by Export Market Analysis (Value & Volume) 2025 & 2033
- Figure 65: Kuwait GCC Fruits and Vegetables Industry Revenue Share (%), by Export Market Analysis (Value & Volume) 2025 & 2033
- Figure 66: Kuwait GCC Fruits and Vegetables Industry Volume Share (%), by Export Market Analysis (Value & Volume) 2025 & 2033
- Figure 67: Kuwait GCC Fruits and Vegetables Industry Revenue (Million), by Price Trend Analysis 2025 & 2033
- Figure 68: Kuwait GCC Fruits and Vegetables Industry Volume (Kiloton), by Price Trend Analysis 2025 & 2033
- Figure 69: Kuwait GCC Fruits and Vegetables Industry Revenue Share (%), by Price Trend Analysis 2025 & 2033
- Figure 70: Kuwait GCC Fruits and Vegetables Industry Volume Share (%), by Price Trend Analysis 2025 & 2033
- Figure 71: Kuwait GCC Fruits and Vegetables Industry Revenue (Million), by Country 2025 & 2033
- Figure 72: Kuwait GCC Fruits and Vegetables Industry Volume (Kiloton), by Country 2025 & 2033
- Figure 73: Kuwait GCC Fruits and Vegetables Industry Revenue Share (%), by Country 2025 & 2033
- Figure 74: Kuwait GCC Fruits and Vegetables Industry Volume Share (%), by Country 2025 & 2033
- Figure 75: Oman GCC Fruits and Vegetables Industry Revenue (Million), by Production Analysis 2025 & 2033
- Figure 76: Oman GCC Fruits and Vegetables Industry Volume (Kiloton), by Production Analysis 2025 & 2033
- Figure 77: Oman GCC Fruits and Vegetables Industry Revenue Share (%), by Production Analysis 2025 & 2033
- Figure 78: Oman GCC Fruits and Vegetables Industry Volume Share (%), by Production Analysis 2025 & 2033
- Figure 79: Oman GCC Fruits and Vegetables Industry Revenue (Million), by Consumption Analysis 2025 & 2033
- Figure 80: Oman GCC Fruits and Vegetables Industry Volume (Kiloton), by Consumption Analysis 2025 & 2033
- Figure 81: Oman GCC Fruits and Vegetables Industry Revenue Share (%), by Consumption Analysis 2025 & 2033
- Figure 82: Oman GCC Fruits and Vegetables Industry Volume Share (%), by Consumption Analysis 2025 & 2033
- Figure 83: Oman GCC Fruits and Vegetables Industry Revenue (Million), by Import Market Analysis (Value & Volume) 2025 & 2033
- Figure 84: Oman GCC Fruits and Vegetables Industry Volume (Kiloton), by Import Market Analysis (Value & Volume) 2025 & 2033
- Figure 85: Oman GCC Fruits and Vegetables Industry Revenue Share (%), by Import Market Analysis (Value & Volume) 2025 & 2033
- Figure 86: Oman GCC Fruits and Vegetables Industry Volume Share (%), by Import Market Analysis (Value & Volume) 2025 & 2033
- Figure 87: Oman GCC Fruits and Vegetables Industry Revenue (Million), by Export Market Analysis (Value & Volume) 2025 & 2033
- Figure 88: Oman GCC Fruits and Vegetables Industry Volume (Kiloton), by Export Market Analysis (Value & Volume) 2025 & 2033
- Figure 89: Oman GCC Fruits and Vegetables Industry Revenue Share (%), by Export Market Analysis (Value & Volume) 2025 & 2033
- Figure 90: Oman GCC Fruits and Vegetables Industry Volume Share (%), by Export Market Analysis (Value & Volume) 2025 & 2033
- Figure 91: Oman GCC Fruits and Vegetables Industry Revenue (Million), by Price Trend Analysis 2025 & 2033
- Figure 92: Oman GCC Fruits and Vegetables Industry Volume (Kiloton), by Price Trend Analysis 2025 & 2033
- Figure 93: Oman GCC Fruits and Vegetables Industry Revenue Share (%), by Price Trend Analysis 2025 & 2033
- Figure 94: Oman GCC Fruits and Vegetables Industry Volume Share (%), by Price Trend Analysis 2025 & 2033
- Figure 95: Oman GCC Fruits and Vegetables Industry Revenue (Million), by Country 2025 & 2033
- Figure 96: Oman GCC Fruits and Vegetables Industry Volume (Kiloton), by Country 2025 & 2033
- Figure 97: Oman GCC Fruits and Vegetables Industry Revenue Share (%), by Country 2025 & 2033
- Figure 98: Oman GCC Fruits and Vegetables Industry Volume Share (%), by Country 2025 & 2033
- Figure 99: Qatar GCC Fruits and Vegetables Industry Revenue (Million), by Production Analysis 2025 & 2033
- Figure 100: Qatar GCC Fruits and Vegetables Industry Volume (Kiloton), by Production Analysis 2025 & 2033
- Figure 101: Qatar GCC Fruits and Vegetables Industry Revenue Share (%), by Production Analysis 2025 & 2033
- Figure 102: Qatar GCC Fruits and Vegetables Industry Volume Share (%), by Production Analysis 2025 & 2033
- Figure 103: Qatar GCC Fruits and Vegetables Industry Revenue (Million), by Consumption Analysis 2025 & 2033
- Figure 104: Qatar GCC Fruits and Vegetables Industry Volume (Kiloton), by Consumption Analysis 2025 & 2033
- Figure 105: Qatar GCC Fruits and Vegetables Industry Revenue Share (%), by Consumption Analysis 2025 & 2033
- Figure 106: Qatar GCC Fruits and Vegetables Industry Volume Share (%), by Consumption Analysis 2025 & 2033
- Figure 107: Qatar GCC Fruits and Vegetables Industry Revenue (Million), by Import Market Analysis (Value & Volume) 2025 & 2033
- Figure 108: Qatar GCC Fruits and Vegetables Industry Volume (Kiloton), by Import Market Analysis (Value & Volume) 2025 & 2033
- Figure 109: Qatar GCC Fruits and Vegetables Industry Revenue Share (%), by Import Market Analysis (Value & Volume) 2025 & 2033
- Figure 110: Qatar GCC Fruits and Vegetables Industry Volume Share (%), by Import Market Analysis (Value & Volume) 2025 & 2033
- Figure 111: Qatar GCC Fruits and Vegetables Industry Revenue (Million), by Export Market Analysis (Value & Volume) 2025 & 2033
- Figure 112: Qatar GCC Fruits and Vegetables Industry Volume (Kiloton), by Export Market Analysis (Value & Volume) 2025 & 2033
- Figure 113: Qatar GCC Fruits and Vegetables Industry Revenue Share (%), by Export Market Analysis (Value & Volume) 2025 & 2033
- Figure 114: Qatar GCC Fruits and Vegetables Industry Volume Share (%), by Export Market Analysis (Value & Volume) 2025 & 2033
- Figure 115: Qatar GCC Fruits and Vegetables Industry Revenue (Million), by Price Trend Analysis 2025 & 2033
- Figure 116: Qatar GCC Fruits and Vegetables Industry Volume (Kiloton), by Price Trend Analysis 2025 & 2033
- Figure 117: Qatar GCC Fruits and Vegetables Industry Revenue Share (%), by Price Trend Analysis 2025 & 2033
- Figure 118: Qatar GCC Fruits and Vegetables Industry Volume Share (%), by Price Trend Analysis 2025 & 2033
- Figure 119: Qatar GCC Fruits and Vegetables Industry Revenue (Million), by Country 2025 & 2033
- Figure 120: Qatar GCC Fruits and Vegetables Industry Volume (Kiloton), by Country 2025 & 2033
- Figure 121: Qatar GCC Fruits and Vegetables Industry Revenue Share (%), by Country 2025 & 2033
- Figure 122: Qatar GCC Fruits and Vegetables Industry Volume Share (%), by Country 2025 & 2033
- Figure 123: Saudi Arabia GCC Fruits and Vegetables Industry Revenue (Million), by Production Analysis 2025 & 2033
- Figure 124: Saudi Arabia GCC Fruits and Vegetables Industry Volume (Kiloton), by Production Analysis 2025 & 2033
- Figure 125: Saudi Arabia GCC Fruits and Vegetables Industry Revenue Share (%), by Production Analysis 2025 & 2033
- Figure 126: Saudi Arabia GCC Fruits and Vegetables Industry Volume Share (%), by Production Analysis 2025 & 2033
- Figure 127: Saudi Arabia GCC Fruits and Vegetables Industry Revenue (Million), by Consumption Analysis 2025 & 2033
- Figure 128: Saudi Arabia GCC Fruits and Vegetables Industry Volume (Kiloton), by Consumption Analysis 2025 & 2033
- Figure 129: Saudi Arabia GCC Fruits and Vegetables Industry Revenue Share (%), by Consumption Analysis 2025 & 2033
- Figure 130: Saudi Arabia GCC Fruits and Vegetables Industry Volume Share (%), by Consumption Analysis 2025 & 2033
- Figure 131: Saudi Arabia GCC Fruits and Vegetables Industry Revenue (Million), by Import Market Analysis (Value & Volume) 2025 & 2033
- Figure 132: Saudi Arabia GCC Fruits and Vegetables Industry Volume (Kiloton), by Import Market Analysis (Value & Volume) 2025 & 2033
- Figure 133: Saudi Arabia GCC Fruits and Vegetables Industry Revenue Share (%), by Import Market Analysis (Value & Volume) 2025 & 2033
- Figure 134: Saudi Arabia GCC Fruits and Vegetables Industry Volume Share (%), by Import Market Analysis (Value & Volume) 2025 & 2033
- Figure 135: Saudi Arabia GCC Fruits and Vegetables Industry Revenue (Million), by Export Market Analysis (Value & Volume) 2025 & 2033
- Figure 136: Saudi Arabia GCC Fruits and Vegetables Industry Volume (Kiloton), by Export Market Analysis (Value & Volume) 2025 & 2033
- Figure 137: Saudi Arabia GCC Fruits and Vegetables Industry Revenue Share (%), by Export Market Analysis (Value & Volume) 2025 & 2033
- Figure 138: Saudi Arabia GCC Fruits and Vegetables Industry Volume Share (%), by Export Market Analysis (Value & Volume) 2025 & 2033
- Figure 139: Saudi Arabia GCC Fruits and Vegetables Industry Revenue (Million), by Price Trend Analysis 2025 & 2033
- Figure 140: Saudi Arabia GCC Fruits and Vegetables Industry Volume (Kiloton), by Price Trend Analysis 2025 & 2033
- Figure 141: Saudi Arabia GCC Fruits and Vegetables Industry Revenue Share (%), by Price Trend Analysis 2025 & 2033
- Figure 142: Saudi Arabia GCC Fruits and Vegetables Industry Volume Share (%), by Price Trend Analysis 2025 & 2033
- Figure 143: Saudi Arabia GCC Fruits and Vegetables Industry Revenue (Million), by Country 2025 & 2033
- Figure 144: Saudi Arabia GCC Fruits and Vegetables Industry Volume (Kiloton), by Country 2025 & 2033
- Figure 145: Saudi Arabia GCC Fruits and Vegetables Industry Revenue Share (%), by Country 2025 & 2033
- Figure 146: Saudi Arabia GCC Fruits and Vegetables Industry Volume Share (%), by Country 2025 & 2033
List of Tables
- Table 1: Global GCC Fruits and Vegetables Industry Revenue Million Forecast, by Production Analysis 2020 & 2033
- Table 2: Global GCC Fruits and Vegetables Industry Volume Kiloton Forecast, by Production Analysis 2020 & 2033
- Table 3: Global GCC Fruits and Vegetables Industry Revenue Million Forecast, by Consumption Analysis 2020 & 2033
- Table 4: Global GCC Fruits and Vegetables Industry Volume Kiloton Forecast, by Consumption Analysis 2020 & 2033
- Table 5: Global GCC Fruits and Vegetables Industry Revenue Million Forecast, by Import Market Analysis (Value & Volume) 2020 & 2033
- Table 6: Global GCC Fruits and Vegetables Industry Volume Kiloton Forecast, by Import Market Analysis (Value & Volume) 2020 & 2033
- Table 7: Global GCC Fruits and Vegetables Industry Revenue Million Forecast, by Export Market Analysis (Value & Volume) 2020 & 2033
- Table 8: Global GCC Fruits and Vegetables Industry Volume Kiloton Forecast, by Export Market Analysis (Value & Volume) 2020 & 2033
- Table 9: Global GCC Fruits and Vegetables Industry Revenue Million Forecast, by Price Trend Analysis 2020 & 2033
- Table 10: Global GCC Fruits and Vegetables Industry Volume Kiloton Forecast, by Price Trend Analysis 2020 & 2033
- Table 11: Global GCC Fruits and Vegetables Industry Revenue Million Forecast, by Region 2020 & 2033
- Table 12: Global GCC Fruits and Vegetables Industry Volume Kiloton Forecast, by Region 2020 & 2033
- Table 13: Global GCC Fruits and Vegetables Industry Revenue Million Forecast, by Production Analysis 2020 & 2033
- Table 14: Global GCC Fruits and Vegetables Industry Volume Kiloton Forecast, by Production Analysis 2020 & 2033
- Table 15: Global GCC Fruits and Vegetables Industry Revenue Million Forecast, by Consumption Analysis 2020 & 2033
- Table 16: Global GCC Fruits and Vegetables Industry Volume Kiloton Forecast, by Consumption Analysis 2020 & 2033
- Table 17: Global GCC Fruits and Vegetables Industry Revenue Million Forecast, by Import Market Analysis (Value & Volume) 2020 & 2033
- Table 18: Global GCC Fruits and Vegetables Industry Volume Kiloton Forecast, by Import Market Analysis (Value & Volume) 2020 & 2033
- Table 19: Global GCC Fruits and Vegetables Industry Revenue Million Forecast, by Export Market Analysis (Value & Volume) 2020 & 2033
- Table 20: Global GCC Fruits and Vegetables Industry Volume Kiloton Forecast, by Export Market Analysis (Value & Volume) 2020 & 2033
- Table 21: Global GCC Fruits and Vegetables Industry Revenue Million Forecast, by Price Trend Analysis 2020 & 2033
- Table 22: Global GCC Fruits and Vegetables Industry Volume Kiloton Forecast, by Price Trend Analysis 2020 & 2033
- Table 23: Global GCC Fruits and Vegetables Industry Revenue Million Forecast, by Country 2020 & 2033
- Table 24: Global GCC Fruits and Vegetables Industry Volume Kiloton Forecast, by Country 2020 & 2033
- Table 25: Fruits GCC Fruits and Vegetables Industry Revenue (Million) Forecast, by Application 2020 & 2033
- Table 26: Fruits GCC Fruits and Vegetables Industry Volume (Kiloton) Forecast, by Application 2020 & 2033
- Table 27: Vegetables GCC Fruits and Vegetables Industry Revenue (Million) Forecast, by Application 2020 & 2033
- Table 28: Vegetables GCC Fruits and Vegetables Industry Volume (Kiloton) Forecast, by Application 2020 & 2033
- Table 29: Global GCC Fruits and Vegetables Industry Revenue Million Forecast, by Production Analysis 2020 & 2033
- Table 30: Global GCC Fruits and Vegetables Industry Volume Kiloton Forecast, by Production Analysis 2020 & 2033
- Table 31: Global GCC Fruits and Vegetables Industry Revenue Million Forecast, by Consumption Analysis 2020 & 2033
- Table 32: Global GCC Fruits and Vegetables Industry Volume Kiloton Forecast, by Consumption Analysis 2020 & 2033
- Table 33: Global GCC Fruits and Vegetables Industry Revenue Million Forecast, by Import Market Analysis (Value & Volume) 2020 & 2033
- Table 34: Global GCC Fruits and Vegetables Industry Volume Kiloton Forecast, by Import Market Analysis (Value & Volume) 2020 & 2033
- Table 35: Global GCC Fruits and Vegetables Industry Revenue Million Forecast, by Export Market Analysis (Value & Volume) 2020 & 2033
- Table 36: Global GCC Fruits and Vegetables Industry Volume Kiloton Forecast, by Export Market Analysis (Value & Volume) 2020 & 2033
- Table 37: Global GCC Fruits and Vegetables Industry Revenue Million Forecast, by Price Trend Analysis 2020 & 2033
- Table 38: Global GCC Fruits and Vegetables Industry Volume Kiloton Forecast, by Price Trend Analysis 2020 & 2033
- Table 39: Global GCC Fruits and Vegetables Industry Revenue Million Forecast, by Country 2020 & 2033
- Table 40: Global GCC Fruits and Vegetables Industry Volume Kiloton Forecast, by Country 2020 & 2033
- Table 41: Fruits GCC Fruits and Vegetables Industry Revenue (Million) Forecast, by Application 2020 & 2033
- Table 42: Fruits GCC Fruits and Vegetables Industry Volume (Kiloton) Forecast, by Application 2020 & 2033
- Table 43: Vegetables GCC Fruits and Vegetables Industry Revenue (Million) Forecast, by Application 2020 & 2033
- Table 44: Vegetables GCC Fruits and Vegetables Industry Volume (Kiloton) Forecast, by Application 2020 & 2033
- Table 45: Global GCC Fruits and Vegetables Industry Revenue Million Forecast, by Production Analysis 2020 & 2033
- Table 46: Global GCC Fruits and Vegetables Industry Volume Kiloton Forecast, by Production Analysis 2020 & 2033
- Table 47: Global GCC Fruits and Vegetables Industry Revenue Million Forecast, by Consumption Analysis 2020 & 2033
- Table 48: Global GCC Fruits and Vegetables Industry Volume Kiloton Forecast, by Consumption Analysis 2020 & 2033
- Table 49: Global GCC Fruits and Vegetables Industry Revenue Million Forecast, by Import Market Analysis (Value & Volume) 2020 & 2033
- Table 50: Global GCC Fruits and Vegetables Industry Volume Kiloton Forecast, by Import Market Analysis (Value & Volume) 2020 & 2033
- Table 51: Global GCC Fruits and Vegetables Industry Revenue Million Forecast, by Export Market Analysis (Value & Volume) 2020 & 2033
- Table 52: Global GCC Fruits and Vegetables Industry Volume Kiloton Forecast, by Export Market Analysis (Value & Volume) 2020 & 2033
- Table 53: Global GCC Fruits and Vegetables Industry Revenue Million Forecast, by Price Trend Analysis 2020 & 2033
- Table 54: Global GCC Fruits and Vegetables Industry Volume Kiloton Forecast, by Price Trend Analysis 2020 & 2033
- Table 55: Global GCC Fruits and Vegetables Industry Revenue Million Forecast, by Country 2020 & 2033
- Table 56: Global GCC Fruits and Vegetables Industry Volume Kiloton Forecast, by Country 2020 & 2033
- Table 57: Fruits GCC Fruits and Vegetables Industry Revenue (Million) Forecast, by Application 2020 & 2033
- Table 58: Fruits GCC Fruits and Vegetables Industry Volume (Kiloton) Forecast, by Application 2020 & 2033
- Table 59: Vegetables GCC Fruits and Vegetables Industry Revenue (Million) Forecast, by Application 2020 & 2033
- Table 60: Vegetables GCC Fruits and Vegetables Industry Volume (Kiloton) Forecast, by Application 2020 & 2033
- Table 61: Global GCC Fruits and Vegetables Industry Revenue Million Forecast, by Production Analysis 2020 & 2033
- Table 62: Global GCC Fruits and Vegetables Industry Volume Kiloton Forecast, by Production Analysis 2020 & 2033
- Table 63: Global GCC Fruits and Vegetables Industry Revenue Million Forecast, by Consumption Analysis 2020 & 2033
- Table 64: Global GCC Fruits and Vegetables Industry Volume Kiloton Forecast, by Consumption Analysis 2020 & 2033
- Table 65: Global GCC Fruits and Vegetables Industry Revenue Million Forecast, by Import Market Analysis (Value & Volume) 2020 & 2033
- Table 66: Global GCC Fruits and Vegetables Industry Volume Kiloton Forecast, by Import Market Analysis (Value & Volume) 2020 & 2033
- Table 67: Global GCC Fruits and Vegetables Industry Revenue Million Forecast, by Export Market Analysis (Value & Volume) 2020 & 2033
- Table 68: Global GCC Fruits and Vegetables Industry Volume Kiloton Forecast, by Export Market Analysis (Value & Volume) 2020 & 2033
- Table 69: Global GCC Fruits and Vegetables Industry Revenue Million Forecast, by Price Trend Analysis 2020 & 2033
- Table 70: Global GCC Fruits and Vegetables Industry Volume Kiloton Forecast, by Price Trend Analysis 2020 & 2033
- Table 71: Global GCC Fruits and Vegetables Industry Revenue Million Forecast, by Country 2020 & 2033
- Table 72: Global GCC Fruits and Vegetables Industry Volume Kiloton Forecast, by Country 2020 & 2033
- Table 73: Fruits GCC Fruits and Vegetables Industry Revenue (Million) Forecast, by Application 2020 & 2033
- Table 74: Fruits GCC Fruits and Vegetables Industry Volume (Kiloton) Forecast, by Application 2020 & 2033
- Table 75: Vegetables GCC Fruits and Vegetables Industry Revenue (Million) Forecast, by Application 2020 & 2033
- Table 76: Vegetables GCC Fruits and Vegetables Industry Volume (Kiloton) Forecast, by Application 2020 & 2033
- Table 77: Global GCC Fruits and Vegetables Industry Revenue Million Forecast, by Production Analysis 2020 & 2033
- Table 78: Global GCC Fruits and Vegetables Industry Volume Kiloton Forecast, by Production Analysis 2020 & 2033
- Table 79: Global GCC Fruits and Vegetables Industry Revenue Million Forecast, by Consumption Analysis 2020 & 2033
- Table 80: Global GCC Fruits and Vegetables Industry Volume Kiloton Forecast, by Consumption Analysis 2020 & 2033
- Table 81: Global GCC Fruits and Vegetables Industry Revenue Million Forecast, by Import Market Analysis (Value & Volume) 2020 & 2033
- Table 82: Global GCC Fruits and Vegetables Industry Volume Kiloton Forecast, by Import Market Analysis (Value & Volume) 2020 & 2033
- Table 83: Global GCC Fruits and Vegetables Industry Revenue Million Forecast, by Export Market Analysis (Value & Volume) 2020 & 2033
- Table 84: Global GCC Fruits and Vegetables Industry Volume Kiloton Forecast, by Export Market Analysis (Value & Volume) 2020 & 2033
- Table 85: Global GCC Fruits and Vegetables Industry Revenue Million Forecast, by Price Trend Analysis 2020 & 2033
- Table 86: Global GCC Fruits and Vegetables Industry Volume Kiloton Forecast, by Price Trend Analysis 2020 & 2033
- Table 87: Global GCC Fruits and Vegetables Industry Revenue Million Forecast, by Country 2020 & 2033
- Table 88: Global GCC Fruits and Vegetables Industry Volume Kiloton Forecast, by Country 2020 & 2033
- Table 89: Fruits GCC Fruits and Vegetables Industry Revenue (Million) Forecast, by Application 2020 & 2033
- Table 90: Fruits GCC Fruits and Vegetables Industry Volume (Kiloton) Forecast, by Application 2020 & 2033
- Table 91: Vegetables GCC Fruits and Vegetables Industry Revenue (Million) Forecast, by Application 2020 & 2033
- Table 92: Vegetables GCC Fruits and Vegetables Industry Volume (Kiloton) Forecast, by Application 2020 & 2033
- Table 93: Global GCC Fruits and Vegetables Industry Revenue Million Forecast, by Production Analysis 2020 & 2033
- Table 94: Global GCC Fruits and Vegetables Industry Volume Kiloton Forecast, by Production Analysis 2020 & 2033
- Table 95: Global GCC Fruits and Vegetables Industry Revenue Million Forecast, by Consumption Analysis 2020 & 2033
- Table 96: Global GCC Fruits and Vegetables Industry Volume Kiloton Forecast, by Consumption Analysis 2020 & 2033
- Table 97: Global GCC Fruits and Vegetables Industry Revenue Million Forecast, by Import Market Analysis (Value & Volume) 2020 & 2033
- Table 98: Global GCC Fruits and Vegetables Industry Volume Kiloton Forecast, by Import Market Analysis (Value & Volume) 2020 & 2033
- Table 99: Global GCC Fruits and Vegetables Industry Revenue Million Forecast, by Export Market Analysis (Value & Volume) 2020 & 2033
- Table 100: Global GCC Fruits and Vegetables Industry Volume Kiloton Forecast, by Export Market Analysis (Value & Volume) 2020 & 2033
- Table 101: Global GCC Fruits and Vegetables Industry Revenue Million Forecast, by Price Trend Analysis 2020 & 2033
- Table 102: Global GCC Fruits and Vegetables Industry Volume Kiloton Forecast, by Price Trend Analysis 2020 & 2033
- Table 103: Global GCC Fruits and Vegetables Industry Revenue Million Forecast, by Country 2020 & 2033
- Table 104: Global GCC Fruits and Vegetables Industry Volume Kiloton Forecast, by Country 2020 & 2033
- Table 105: Fruits GCC Fruits and Vegetables Industry Revenue (Million) Forecast, by Application 2020 & 2033
- Table 106: Fruits GCC Fruits and Vegetables Industry Volume (Kiloton) Forecast, by Application 2020 & 2033
- Table 107: Vegetables GCC Fruits and Vegetables Industry Revenue (Million) Forecast, by Application 2020 & 2033
- Table 108: Vegetables GCC Fruits and Vegetables Industry Volume (Kiloton) Forecast, by Application 2020 & 2033
Frequently Asked Questions
1. What is the projected Compound Annual Growth Rate (CAGR) of the GCC Fruits and Vegetables Industry?
The projected CAGR is approximately 4.80%.
2. Which companies are prominent players in the GCC Fruits and Vegetables Industry?
Key companies in the market include Del Monte Foods UAE , Barakat Group , NRTC Group, Lulu Group , Al Raya Group , Al-Futtaim Group , Al Bakrawe Group , Fresh Fruits Company, SPAR , Carrefour .
3. What are the main segments of the GCC Fruits and Vegetables Industry?
The market segments include Production Analysis, Consumption Analysis, Import Market Analysis (Value & Volume), Export Market Analysis (Value & Volume), Price Trend Analysis.
4. Can you provide details about the market size?
The market size is estimated to be USD 15.98 Million as of 2022.
5. What are some drivers contributing to market growth?
Increasing Adoption of Technology in Horticulture; Government Initiatives for Self-reliance in Vegetable and Fruit Farming.
6. What are the notable trends driving market growth?
Increasing Adoption of Technology in Horticulture.
7. Are there any restraints impacting market growth?
Limited Resource Availability and Unfavourable Climatic Condition; Increasing Reliance on Imports for Domestic Supply.
8. Can you provide examples of recent developments in the market?
February 2024: Lulu Group opened its 23rd hypermarket in the new Doha Mall, Qatar. The hypermarket is a two-floor space of 80,000 square feet that features a modern design aligned with the latest shopping trends. The new hypermarket introduces an extensive range of fresh produce worldwide. Also, to help shoppers save more and get loyalty rewards, Lulu launched its innovative loyalty reward program, Lulu Happiness. By joining this program, shoppers get exclusive offers, additional discounts, and redeemable points whenever they shop at any Lulu Hypermarket.
9. What pricing options are available for accessing the report?
Pricing options include single-user, multi-user, and enterprise licenses priced at USD 4750, USD 5250, and USD 8750 respectively.
10. Is the market size provided in terms of value or volume?
The market size is provided in terms of value, measured in Million and volume, measured in Kiloton.
11. Are there any specific market keywords associated with the report?
Yes, the market keyword associated with the report is "GCC Fruits and Vegetables Industry," which aids in identifying and referencing the specific market segment covered.
12. How do I determine which pricing option suits my needs best?
The pricing options vary based on user requirements and access needs. Individual users may opt for single-user licenses, while businesses requiring broader access may choose multi-user or enterprise licenses for cost-effective access to the report.
13. Are there any additional resources or data provided in the GCC Fruits and Vegetables Industry report?
While the report offers comprehensive insights, it's advisable to review the specific contents or supplementary materials provided to ascertain if additional resources or data are available.
14. How can I stay updated on further developments or reports in the GCC Fruits and Vegetables Industry?
To stay informed about further developments, trends, and reports in the GCC Fruits and Vegetables Industry, consider subscribing to industry newsletters, following relevant companies and organizations, or regularly checking reputable industry news sources and publications.
Methodology
Step 1 - Identification of Relevant Samples Size from Population Database


Step 2 - Approaches for Defining Global Market Size (Value, Volume* & Price*)

Note*: In applicable scenarios
Step 3 - Data Sources
Primary Research
- Web Analytics
- Survey Reports
- Research Institute
- Latest Research Reports
- Opinion Leaders
Secondary Research
- Annual Reports
- White Paper
- Latest Press Release
- Industry Association
- Paid Database
- Investor Presentations

Step 4 - Data Triangulation
Involves using different sources of information in order to increase the validity of a study
These sources are likely to be stakeholders in a program - participants, other researchers, program staff, other community members, and so on.
Then we put all data in single framework & apply various statistical tools to find out the dynamic on the market.
During the analysis stage, feedback from the stakeholder groups would be compared to determine areas of agreement as well as areas of divergence