

Key Insights
The global food supplement market is poised for significant expansion, projected to reach $68.74 billion by 2025, with a Compound Annual Growth Rate (CAGR) of 8.5%. This growth is driven by escalating consumer health consciousness, rising disposable incomes, and an increasing elderly demographic. Demand for specialized supplements targeting immunity, gut health, and cognitive function is surging as consumers adopt a proactive approach to well-being. Developed regions like North America and Europe lead in preventative healthcare awareness, while emerging markets show robust growth due to improved incomes and health information accessibility. The market is characterized by intense competition between established multinational corporations and agile niche players, with innovation, brand reputation, and distribution networks being key differentiators. Regulatory frameworks and stringent quality standards emphasize product safety and efficacy. Challenges include maintaining consistent product quality and addressing concerns surrounding unregulated supplements. Pricing, marketing, and consumer trust remain critical success factors. Continued investment in research and development for functional foods and personalized nutrition will further propel market growth.
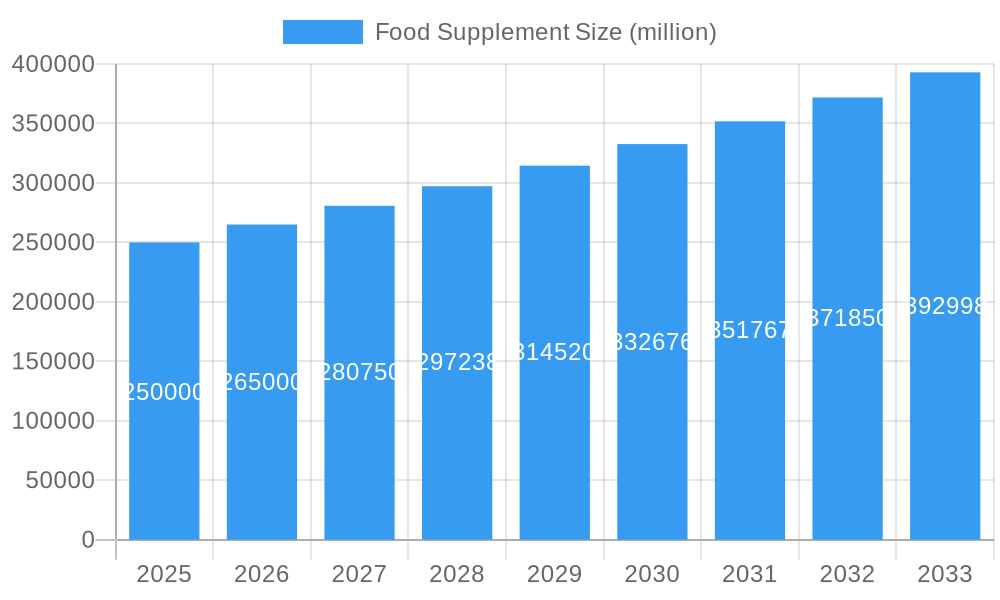
Food Supplement Market Size (In Billion)
Key market participants include major corporations such as Bayer, BASF, and Pfizer, alongside specialized companies like Puritan's Pride and Nature's Plus. This diverse landscape underscores the market's competitiveness and the potential for niche specialization. While growth is expected to persist, a moderating trend may emerge with market maturity and increased regulation. Sustainability, ethical sourcing of ingredients, and eco-friendly packaging will gain prominence in consumer purchasing decisions. Companies prioritizing quality control, transparency, and consumer education will secure trust and market share. Technological advancements in personalized nutrition and e-commerce will also significantly shape the future market.
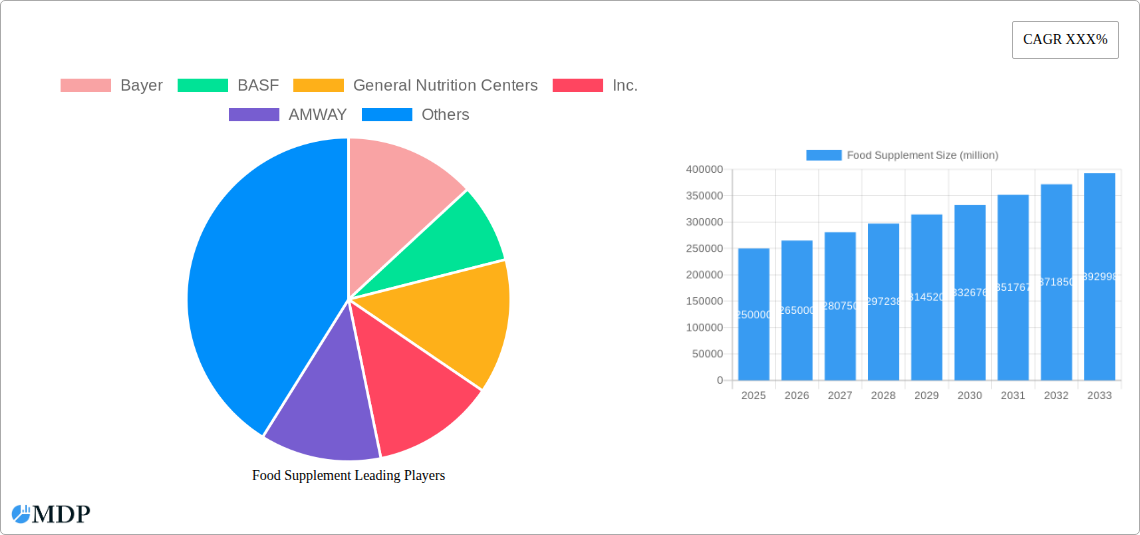
Food Supplement Company Market Share
Food Supplement Market Report: A Comprehensive Analysis (2019-2033)
This comprehensive report provides a detailed analysis of the global food supplement market, offering invaluable insights for industry stakeholders, investors, and strategic decision-makers. The study period covers 2019-2033, with 2025 serving as the base and estimated year. The report projects a market valuation exceeding $XX million by 2033, showcasing significant growth potential. This report leverages a robust methodology incorporating extensive primary and secondary research to deliver actionable intelligence. Download now to gain a competitive edge.
Food Supplement Market Dynamics & Concentration
The global food supplement market exhibits a moderately concentrated landscape, with a few major players holding significant market share. In 2024, the top five companies—Bayer, BASF, AMWAY, Pfizer Inc., and DSM—collectively controlled an estimated 25% of the market. This concentration is influenced by factors including robust R&D capabilities, extensive distribution networks, and established brand recognition. The market is witnessing continuous innovation, driven by the rising demand for specialized supplements catering to various health needs and lifestyles. Stringent regulatory frameworks, particularly concerning labeling and safety standards, govern market operations. The presence of alternative health products, such as functional foods and herbal remedies, poses a degree of substitution. End-user trends indicate a growing preference for personalized nutrition and convenient consumption formats. The period 2019-2024 witnessed approximately xx M&A deals, underscoring the strategic importance of market consolidation. Furthermore, the industry demonstrates a high degree of reliance on contract manufacturing and outsourcing, especially in the production of raw materials.
- Market Concentration: Top 5 players control approximately 25% of the market (2024).
- Innovation Drivers: Growing demand for specialized supplements; focus on personalized nutrition.
- Regulatory Frameworks: Stringent labeling and safety standards.
- Product Substitutes: Functional foods, herbal remedies.
- End-User Trends: Increased demand for personalized nutrition and convenient formats.
- M&A Activity: Approximately xx M&A deals between 2019 and 2024.
Food Supplement Industry Trends & Analysis
The global food supplement market is experiencing robust growth, projected to reach $XX million by 2033, with a CAGR of xx% during the forecast period (2025-2033). This growth is primarily fueled by escalating health consciousness among consumers, an aging global population, rising disposable incomes, particularly in emerging economies, and the increased prevalence of chronic diseases. Technological disruptions, including advancements in delivery systems (e.g., nano-encapsulation), personalized nutrition, and digital marketing strategies, are reshaping market dynamics. Consumer preferences lean towards natural ingredients, transparency in labeling, and scientifically-backed efficacy claims. Competitive dynamics are characterized by intense competition based on product innovation, brand building, and pricing strategies. Market penetration of food supplements remains relatively high in developed regions, with significant growth opportunities in developing markets.
Leading Markets & Segments in Food Supplement
The North American region holds the dominant position in the global food supplement market, accounting for approximately xx% of the total market revenue in 2024. This dominance stems from various factors:
- Strong consumer awareness of health and wellness: High prevalence of chronic diseases drives demand.
- Well-established distribution networks: Extensive retail channels cater to diverse consumer needs.
- Robust regulatory framework: Provides a stable and predictable market environment.
- High disposable incomes: Enables higher spending on health-related products.
Within the segments, the vitamins and minerals category commands the largest market share, driven by their widespread use and established consumer base. The probiotics and sports nutrition segments are exhibiting the fastest growth rates, reflecting increasing consumer awareness of gut health and the expanding fitness and wellness industries.
Food Supplement Product Developments
Recent product developments in the food supplement sector emphasize functional foods, personalized supplements, improved bioavailability through novel delivery systems, and increased use of plant-based ingredients. These advancements cater to evolving consumer preferences and address specific health needs. Competitive advantages are achieved through superior formulation, targeted marketing campaigns, and strong brand reputation.
Key Drivers of Food Supplement Growth
Several key factors are driving the growth of the food supplement market:
- Rising health consciousness: Increased awareness of preventive health measures.
- Aging global population: Growing demand for supplements addressing age-related health issues.
- Technological advancements: Improved delivery systems and personalized nutrition solutions.
- Increased disposable incomes: Higher spending power, particularly in emerging markets.
- Supportive regulatory environment: Facilitates market growth through clear guidelines and standards.
Challenges in the Food Supplement Market
The food supplement market faces several challenges:
- Stringent regulatory hurdles: Compliance costs and navigating complex regulations.
- Supply chain complexities: Maintaining quality and consistency of raw materials.
- Intense competition: Price wars and the need for constant product innovation.
- Counterfeit products: Threatens consumer safety and brand reputation.
Emerging Opportunities in Food Supplement
Significant opportunities exist for growth in the food supplement sector, fueled by technological breakthroughs in personalized nutrition, the expanding applications of probiotics and prebiotics, the growing adoption of functional foods, and expansion into underserved markets. Strategic partnerships between supplement manufacturers and healthcare providers can open new avenues for market penetration and establish credibility.
Leading Players in the Food Supplement Sector
- Bayer
- BASF
- General Nutrition Centers, Inc.
- AMWAY
- Puritan's Pride
- Pharmavite (Otsuka Pharmaceutical)
- Jamieson
- WN Pharmaceuticals Ltd
- Pfizer Inc.
- Daiichi Sankyo
- Eisai
- DSM
- Hainan Yangshengtang
- CSPC Pharmaceutical Group
- Sanofi
- Bluestar Adisseo
- Natures Plus
- Glanbia Nutritionals
- Salus-Haus
- BioGaia
- Probi AB
- I-Health
- Winclove
- Probiotics International Ltd (Protexin)
- UAS Labs
Key Milestones in Food Supplement Industry
- 2020: Increased demand for immunity-boosting supplements due to the COVID-19 pandemic.
- 2021: Launch of several personalized nutrition platforms.
- 2022: Growing adoption of sustainable sourcing practices by major players.
- 2023: Several mergers and acquisitions to expand product portfolios and market reach.
- 2024: Increased focus on scientific research to validate efficacy claims.
Strategic Outlook for Food Supplement Market
The food supplement market is poised for sustained growth, driven by continuous innovation, evolving consumer preferences, and expanding market applications. Strategic opportunities abound in developing personalized nutrition solutions, expanding into new geographical markets, forging strategic alliances, and developing sustainable and ethically sourced products. The focus on preventative health and wellness positions the industry for long-term success.
Food Supplement Segmentation
-
1. Application
- 1.1. Men
- 1.2. Women
- 1.3. Children
-
2. Type
- 2.1. Vitamin
- 2.2. Mineral
- 2.3. Probiotics
- 2.4. Essential Fatty Acids
- 2.5. Proteins and Amino Acids
- 2.6. Others
Food Supplement Segmentation By Geography
-
1. North America
- 1.1. United States
- 1.2. Canada
- 1.3. Mexico
-
2. South America
- 2.1. Brazil
- 2.2. Argentina
- 2.3. Rest of South America
-
3. Europe
- 3.1. United Kingdom
- 3.2. Germany
- 3.3. France
- 3.4. Italy
- 3.5. Spain
- 3.6. Russia
- 3.7. Benelux
- 3.8. Nordics
- 3.9. Rest of Europe
-
4. Middle East & Africa
- 4.1. Turkey
- 4.2. Israel
- 4.3. GCC
- 4.4. North Africa
- 4.5. South Africa
- 4.6. Rest of Middle East & Africa
-
5. Asia Pacific
- 5.1. China
- 5.2. India
- 5.3. Japan
- 5.4. South Korea
- 5.5. ASEAN
- 5.6. Oceania
- 5.7. Rest of Asia Pacific
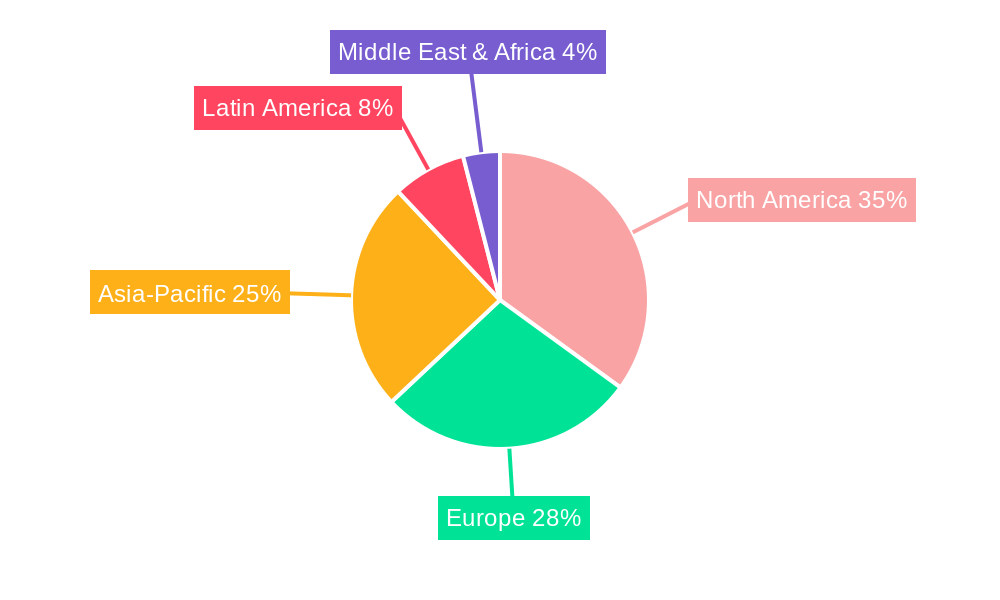
Food Supplement Regional Market Share
Geographic Coverage of Food Supplement
Food Supplement REPORT HIGHLIGHTS
| Aspects | Details |
|---|---|
| Study Period | 2020-2034 |
| Base Year | 2025 |
| Estimated Year | 2026 |
| Forecast Period | 2026-2034 |
| Historical Period | 2020-2025 |
| Growth Rate | CAGR of 8.5% from 2020-2034 |
| Segmentation |
|
Table of Contents
- 1. Introduction
- 1.1. Research Scope
- 1.2. Market Segmentation
- 1.3. Research Methodology
- 1.4. Definitions and Assumptions
- 2. Executive Summary
- 2.1. Introduction
- 3. Market Dynamics
- 3.1. Introduction
- 3.2. Market Drivers
- 3.3. Market Restrains
- 3.4. Market Trends
- 4. Market Factor Analysis
- 4.1. Porters Five Forces
- 4.2. Supply/Value Chain
- 4.3. PESTEL analysis
- 4.4. Market Entropy
- 4.5. Patent/Trademark Analysis
- 5. Global Food Supplement Analysis, Insights and Forecast, 2020-2032
- 5.1. Market Analysis, Insights and Forecast - by Application
- 5.1.1. Men
- 5.1.2. Women
- 5.1.3. Children
- 5.2. Market Analysis, Insights and Forecast - by Type
- 5.2.1. Vitamin
- 5.2.2. Mineral
- 5.2.3. Probiotics
- 5.2.4. Essential Fatty Acids
- 5.2.5. Proteins and Amino Acids
- 5.2.6. Others
- 5.3. Market Analysis, Insights and Forecast - by Region
- 5.3.1. North America
- 5.3.2. South America
- 5.3.3. Europe
- 5.3.4. Middle East & Africa
- 5.3.5. Asia Pacific
- 5.1. Market Analysis, Insights and Forecast - by Application
- 6. North America Food Supplement Analysis, Insights and Forecast, 2020-2032
- 6.1. Market Analysis, Insights and Forecast - by Application
- 6.1.1. Men
- 6.1.2. Women
- 6.1.3. Children
- 6.2. Market Analysis, Insights and Forecast - by Type
- 6.2.1. Vitamin
- 6.2.2. Mineral
- 6.2.3. Probiotics
- 6.2.4. Essential Fatty Acids
- 6.2.5. Proteins and Amino Acids
- 6.2.6. Others
- 6.1. Market Analysis, Insights and Forecast - by Application
- 7. South America Food Supplement Analysis, Insights and Forecast, 2020-2032
- 7.1. Market Analysis, Insights and Forecast - by Application
- 7.1.1. Men
- 7.1.2. Women
- 7.1.3. Children
- 7.2. Market Analysis, Insights and Forecast - by Type
- 7.2.1. Vitamin
- 7.2.2. Mineral
- 7.2.3. Probiotics
- 7.2.4. Essential Fatty Acids
- 7.2.5. Proteins and Amino Acids
- 7.2.6. Others
- 7.1. Market Analysis, Insights and Forecast - by Application
- 8. Europe Food Supplement Analysis, Insights and Forecast, 2020-2032
- 8.1. Market Analysis, Insights and Forecast - by Application
- 8.1.1. Men
- 8.1.2. Women
- 8.1.3. Children
- 8.2. Market Analysis, Insights and Forecast - by Type
- 8.2.1. Vitamin
- 8.2.2. Mineral
- 8.2.3. Probiotics
- 8.2.4. Essential Fatty Acids
- 8.2.5. Proteins and Amino Acids
- 8.2.6. Others
- 8.1. Market Analysis, Insights and Forecast - by Application
- 9. Middle East & Africa Food Supplement Analysis, Insights and Forecast, 2020-2032
- 9.1. Market Analysis, Insights and Forecast - by Application
- 9.1.1. Men
- 9.1.2. Women
- 9.1.3. Children
- 9.2. Market Analysis, Insights and Forecast - by Type
- 9.2.1. Vitamin
- 9.2.2. Mineral
- 9.2.3. Probiotics
- 9.2.4. Essential Fatty Acids
- 9.2.5. Proteins and Amino Acids
- 9.2.6. Others
- 9.1. Market Analysis, Insights and Forecast - by Application
- 10. Asia Pacific Food Supplement Analysis, Insights and Forecast, 2020-2032
- 10.1. Market Analysis, Insights and Forecast - by Application
- 10.1.1. Men
- 10.1.2. Women
- 10.1.3. Children
- 10.2. Market Analysis, Insights and Forecast - by Type
- 10.2.1. Vitamin
- 10.2.2. Mineral
- 10.2.3. Probiotics
- 10.2.4. Essential Fatty Acids
- 10.2.5. Proteins and Amino Acids
- 10.2.6. Others
- 10.1. Market Analysis, Insights and Forecast - by Application
- 11. Competitive Analysis
- 11.1. Global Market Share Analysis 2025
- 11.2. Company Profiles
- 11.2.1 Bayer
- 11.2.1.1. Overview
- 11.2.1.2. Products
- 11.2.1.3. SWOT Analysis
- 11.2.1.4. Recent Developments
- 11.2.1.5. Financials (Based on Availability)
- 11.2.2 BASF
- 11.2.2.1. Overview
- 11.2.2.2. Products
- 11.2.2.3. SWOT Analysis
- 11.2.2.4. Recent Developments
- 11.2.2.5. Financials (Based on Availability)
- 11.2.3 General Nutrition Centers
- 11.2.3.1. Overview
- 11.2.3.2. Products
- 11.2.3.3. SWOT Analysis
- 11.2.3.4. Recent Developments
- 11.2.3.5. Financials (Based on Availability)
- 11.2.4 Inc.
- 11.2.4.1. Overview
- 11.2.4.2. Products
- 11.2.4.3. SWOT Analysis
- 11.2.4.4. Recent Developments
- 11.2.4.5. Financials (Based on Availability)
- 11.2.5 AMWAY
- 11.2.5.1. Overview
- 11.2.5.2. Products
- 11.2.5.3. SWOT Analysis
- 11.2.5.4. Recent Developments
- 11.2.5.5. Financials (Based on Availability)
- 11.2.6 Puritan’ s Pride
- 11.2.6.1. Overview
- 11.2.6.2. Products
- 11.2.6.3. SWOT Analysis
- 11.2.6.4. Recent Developments
- 11.2.6.5. Financials (Based on Availability)
- 11.2.7 Pharmavite (Otsuka Pharmaceutical)
- 11.2.7.1. Overview
- 11.2.7.2. Products
- 11.2.7.3. SWOT Analysis
- 11.2.7.4. Recent Developments
- 11.2.7.5. Financials (Based on Availability)
- 11.2.8 Jamieson
- 11.2.8.1. Overview
- 11.2.8.2. Products
- 11.2.8.3. SWOT Analysis
- 11.2.8.4. Recent Developments
- 11.2.8.5. Financials (Based on Availability)
- 11.2.9 WN Pharmaceuticals Ltd
- 11.2.9.1. Overview
- 11.2.9.2. Products
- 11.2.9.3. SWOT Analysis
- 11.2.9.4. Recent Developments
- 11.2.9.5. Financials (Based on Availability)
- 11.2.10 Pfizer Inc.
- 11.2.10.1. Overview
- 11.2.10.2. Products
- 11.2.10.3. SWOT Analysis
- 11.2.10.4. Recent Developments
- 11.2.10.5. Financials (Based on Availability)
- 11.2.11 Daiichi Sankyo
- 11.2.11.1. Overview
- 11.2.11.2. Products
- 11.2.11.3. SWOT Analysis
- 11.2.11.4. Recent Developments
- 11.2.11.5. Financials (Based on Availability)
- 11.2.12 Eisai
- 11.2.12.1. Overview
- 11.2.12.2. Products
- 11.2.12.3. SWOT Analysis
- 11.2.12.4. Recent Developments
- 11.2.12.5. Financials (Based on Availability)
- 11.2.13 DSM
- 11.2.13.1. Overview
- 11.2.13.2. Products
- 11.2.13.3. SWOT Analysis
- 11.2.13.4. Recent Developments
- 11.2.13.5. Financials (Based on Availability)
- 11.2.14 Hainan Yangshengtang
- 11.2.14.1. Overview
- 11.2.14.2. Products
- 11.2.14.3. SWOT Analysis
- 11.2.14.4. Recent Developments
- 11.2.14.5. Financials (Based on Availability)
- 11.2.15 CSPC Pharmaceutical Group
- 11.2.15.1. Overview
- 11.2.15.2. Products
- 11.2.15.3. SWOT Analysis
- 11.2.15.4. Recent Developments
- 11.2.15.5. Financials (Based on Availability)
- 11.2.16 Sanofi
- 11.2.16.1. Overview
- 11.2.16.2. Products
- 11.2.16.3. SWOT Analysis
- 11.2.16.4. Recent Developments
- 11.2.16.5. Financials (Based on Availability)
- 11.2.17 Bluestar Adisseo
- 11.2.17.1. Overview
- 11.2.17.2. Products
- 11.2.17.3. SWOT Analysis
- 11.2.17.4. Recent Developments
- 11.2.17.5. Financials (Based on Availability)
- 11.2.18 Natures Plus
- 11.2.18.1. Overview
- 11.2.18.2. Products
- 11.2.18.3. SWOT Analysis
- 11.2.18.4. Recent Developments
- 11.2.18.5. Financials (Based on Availability)
- 11.2.19 Glanbia Nutritionals
- 11.2.19.1. Overview
- 11.2.19.2. Products
- 11.2.19.3. SWOT Analysis
- 11.2.19.4. Recent Developments
- 11.2.19.5. Financials (Based on Availability)
- 11.2.20 Salus-Haus
- 11.2.20.1. Overview
- 11.2.20.2. Products
- 11.2.20.3. SWOT Analysis
- 11.2.20.4. Recent Developments
- 11.2.20.5. Financials (Based on Availability)
- 11.2.21 BioGaia
- 11.2.21.1. Overview
- 11.2.21.2. Products
- 11.2.21.3. SWOT Analysis
- 11.2.21.4. Recent Developments
- 11.2.21.5. Financials (Based on Availability)
- 11.2.22 Probi AB
- 11.2.22.1. Overview
- 11.2.22.2. Products
- 11.2.22.3. SWOT Analysis
- 11.2.22.4. Recent Developments
- 11.2.22.5. Financials (Based on Availability)
- 11.2.23 I-Health
- 11.2.23.1. Overview
- 11.2.23.2. Products
- 11.2.23.3. SWOT Analysis
- 11.2.23.4. Recent Developments
- 11.2.23.5. Financials (Based on Availability)
- 11.2.24 Winclove
- 11.2.24.1. Overview
- 11.2.24.2. Products
- 11.2.24.3. SWOT Analysis
- 11.2.24.4. Recent Developments
- 11.2.24.5. Financials (Based on Availability)
- 11.2.25 Probiotics International Ltd (Protexin)
- 11.2.25.1. Overview
- 11.2.25.2. Products
- 11.2.25.3. SWOT Analysis
- 11.2.25.4. Recent Developments
- 11.2.25.5. Financials (Based on Availability)
- 11.2.26 UAS Labs
- 11.2.26.1. Overview
- 11.2.26.2. Products
- 11.2.26.3. SWOT Analysis
- 11.2.26.4. Recent Developments
- 11.2.26.5. Financials (Based on Availability)
- 11.2.1 Bayer
List of Figures
- Figure 1: Global Food Supplement Revenue Breakdown (billion, %) by Region 2025 & 2033
- Figure 2: North America Food Supplement Revenue (billion), by Application 2025 & 2033
- Figure 3: North America Food Supplement Revenue Share (%), by Application 2025 & 2033
- Figure 4: North America Food Supplement Revenue (billion), by Type 2025 & 2033
- Figure 5: North America Food Supplement Revenue Share (%), by Type 2025 & 2033
- Figure 6: North America Food Supplement Revenue (billion), by Country 2025 & 2033
- Figure 7: North America Food Supplement Revenue Share (%), by Country 2025 & 2033
- Figure 8: South America Food Supplement Revenue (billion), by Application 2025 & 2033
- Figure 9: South America Food Supplement Revenue Share (%), by Application 2025 & 2033
- Figure 10: South America Food Supplement Revenue (billion), by Type 2025 & 2033
- Figure 11: South America Food Supplement Revenue Share (%), by Type 2025 & 2033
- Figure 12: South America Food Supplement Revenue (billion), by Country 2025 & 2033
- Figure 13: South America Food Supplement Revenue Share (%), by Country 2025 & 2033
- Figure 14: Europe Food Supplement Revenue (billion), by Application 2025 & 2033
- Figure 15: Europe Food Supplement Revenue Share (%), by Application 2025 & 2033
- Figure 16: Europe Food Supplement Revenue (billion), by Type 2025 & 2033
- Figure 17: Europe Food Supplement Revenue Share (%), by Type 2025 & 2033
- Figure 18: Europe Food Supplement Revenue (billion), by Country 2025 & 2033
- Figure 19: Europe Food Supplement Revenue Share (%), by Country 2025 & 2033
- Figure 20: Middle East & Africa Food Supplement Revenue (billion), by Application 2025 & 2033
- Figure 21: Middle East & Africa Food Supplement Revenue Share (%), by Application 2025 & 2033
- Figure 22: Middle East & Africa Food Supplement Revenue (billion), by Type 2025 & 2033
- Figure 23: Middle East & Africa Food Supplement Revenue Share (%), by Type 2025 & 2033
- Figure 24: Middle East & Africa Food Supplement Revenue (billion), by Country 2025 & 2033
- Figure 25: Middle East & Africa Food Supplement Revenue Share (%), by Country 2025 & 2033
- Figure 26: Asia Pacific Food Supplement Revenue (billion), by Application 2025 & 2033
- Figure 27: Asia Pacific Food Supplement Revenue Share (%), by Application 2025 & 2033
- Figure 28: Asia Pacific Food Supplement Revenue (billion), by Type 2025 & 2033
- Figure 29: Asia Pacific Food Supplement Revenue Share (%), by Type 2025 & 2033
- Figure 30: Asia Pacific Food Supplement Revenue (billion), by Country 2025 & 2033
- Figure 31: Asia Pacific Food Supplement Revenue Share (%), by Country 2025 & 2033
List of Tables
- Table 1: Global Food Supplement Revenue billion Forecast, by Application 2020 & 2033
- Table 2: Global Food Supplement Revenue billion Forecast, by Type 2020 & 2033
- Table 3: Global Food Supplement Revenue billion Forecast, by Region 2020 & 2033
- Table 4: Global Food Supplement Revenue billion Forecast, by Application 2020 & 2033
- Table 5: Global Food Supplement Revenue billion Forecast, by Type 2020 & 2033
- Table 6: Global Food Supplement Revenue billion Forecast, by Country 2020 & 2033
- Table 7: United States Food Supplement Revenue (billion) Forecast, by Application 2020 & 2033
- Table 8: Canada Food Supplement Revenue (billion) Forecast, by Application 2020 & 2033
- Table 9: Mexico Food Supplement Revenue (billion) Forecast, by Application 2020 & 2033
- Table 10: Global Food Supplement Revenue billion Forecast, by Application 2020 & 2033
- Table 11: Global Food Supplement Revenue billion Forecast, by Type 2020 & 2033
- Table 12: Global Food Supplement Revenue billion Forecast, by Country 2020 & 2033
- Table 13: Brazil Food Supplement Revenue (billion) Forecast, by Application 2020 & 2033
- Table 14: Argentina Food Supplement Revenue (billion) Forecast, by Application 2020 & 2033
- Table 15: Rest of South America Food Supplement Revenue (billion) Forecast, by Application 2020 & 2033
- Table 16: Global Food Supplement Revenue billion Forecast, by Application 2020 & 2033
- Table 17: Global Food Supplement Revenue billion Forecast, by Type 2020 & 2033
- Table 18: Global Food Supplement Revenue billion Forecast, by Country 2020 & 2033
- Table 19: United Kingdom Food Supplement Revenue (billion) Forecast, by Application 2020 & 2033
- Table 20: Germany Food Supplement Revenue (billion) Forecast, by Application 2020 & 2033
- Table 21: France Food Supplement Revenue (billion) Forecast, by Application 2020 & 2033
- Table 22: Italy Food Supplement Revenue (billion) Forecast, by Application 2020 & 2033
- Table 23: Spain Food Supplement Revenue (billion) Forecast, by Application 2020 & 2033
- Table 24: Russia Food Supplement Revenue (billion) Forecast, by Application 2020 & 2033
- Table 25: Benelux Food Supplement Revenue (billion) Forecast, by Application 2020 & 2033
- Table 26: Nordics Food Supplement Revenue (billion) Forecast, by Application 2020 & 2033
- Table 27: Rest of Europe Food Supplement Revenue (billion) Forecast, by Application 2020 & 2033
- Table 28: Global Food Supplement Revenue billion Forecast, by Application 2020 & 2033
- Table 29: Global Food Supplement Revenue billion Forecast, by Type 2020 & 2033
- Table 30: Global Food Supplement Revenue billion Forecast, by Country 2020 & 2033
- Table 31: Turkey Food Supplement Revenue (billion) Forecast, by Application 2020 & 2033
- Table 32: Israel Food Supplement Revenue (billion) Forecast, by Application 2020 & 2033
- Table 33: GCC Food Supplement Revenue (billion) Forecast, by Application 2020 & 2033
- Table 34: North Africa Food Supplement Revenue (billion) Forecast, by Application 2020 & 2033
- Table 35: South Africa Food Supplement Revenue (billion) Forecast, by Application 2020 & 2033
- Table 36: Rest of Middle East & Africa Food Supplement Revenue (billion) Forecast, by Application 2020 & 2033
- Table 37: Global Food Supplement Revenue billion Forecast, by Application 2020 & 2033
- Table 38: Global Food Supplement Revenue billion Forecast, by Type 2020 & 2033
- Table 39: Global Food Supplement Revenue billion Forecast, by Country 2020 & 2033
- Table 40: China Food Supplement Revenue (billion) Forecast, by Application 2020 & 2033
- Table 41: India Food Supplement Revenue (billion) Forecast, by Application 2020 & 2033
- Table 42: Japan Food Supplement Revenue (billion) Forecast, by Application 2020 & 2033
- Table 43: South Korea Food Supplement Revenue (billion) Forecast, by Application 2020 & 2033
- Table 44: ASEAN Food Supplement Revenue (billion) Forecast, by Application 2020 & 2033
- Table 45: Oceania Food Supplement Revenue (billion) Forecast, by Application 2020 & 2033
- Table 46: Rest of Asia Pacific Food Supplement Revenue (billion) Forecast, by Application 2020 & 2033
Frequently Asked Questions
1. What is the projected Compound Annual Growth Rate (CAGR) of the Food Supplement?
The projected CAGR is approximately 8.5%.
2. Which companies are prominent players in the Food Supplement?
Key companies in the market include Bayer, BASF, General Nutrition Centers, Inc., AMWAY, Puritan’ s Pride, Pharmavite (Otsuka Pharmaceutical), Jamieson, WN Pharmaceuticals Ltd, Pfizer Inc., Daiichi Sankyo, Eisai, DSM, Hainan Yangshengtang, CSPC Pharmaceutical Group, Sanofi, Bluestar Adisseo, Natures Plus, Glanbia Nutritionals, Salus-Haus, BioGaia, Probi AB, I-Health, Winclove, Probiotics International Ltd (Protexin), UAS Labs.
3. What are the main segments of the Food Supplement?
The market segments include Application, Type.
4. Can you provide details about the market size?
The market size is estimated to be USD 68.74 billion as of 2022.
5. What are some drivers contributing to market growth?
N/A
6. What are the notable trends driving market growth?
N/A
7. Are there any restraints impacting market growth?
N/A
8. Can you provide examples of recent developments in the market?
N/A
9. What pricing options are available for accessing the report?
Pricing options include single-user, multi-user, and enterprise licenses priced at USD 2900.00, USD 4350.00, and USD 5800.00 respectively.
10. Is the market size provided in terms of value or volume?
The market size is provided in terms of value, measured in billion.
11. Are there any specific market keywords associated with the report?
Yes, the market keyword associated with the report is "Food Supplement," which aids in identifying and referencing the specific market segment covered.
12. How do I determine which pricing option suits my needs best?
The pricing options vary based on user requirements and access needs. Individual users may opt for single-user licenses, while businesses requiring broader access may choose multi-user or enterprise licenses for cost-effective access to the report.
13. Are there any additional resources or data provided in the Food Supplement report?
While the report offers comprehensive insights, it's advisable to review the specific contents or supplementary materials provided to ascertain if additional resources or data are available.
14. How can I stay updated on further developments or reports in the Food Supplement?
To stay informed about further developments, trends, and reports in the Food Supplement, consider subscribing to industry newsletters, following relevant companies and organizations, or regularly checking reputable industry news sources and publications.
Methodology
Step 1 - Identification of Relevant Samples Size from Population Database


Step 2 - Approaches for Defining Global Market Size (Value, Volume* & Price*)

Note*: In applicable scenarios
Step 3 - Data Sources
Primary Research
- Web Analytics
- Survey Reports
- Research Institute
- Latest Research Reports
- Opinion Leaders
Secondary Research
- Annual Reports
- White Paper
- Latest Press Release
- Industry Association
- Paid Database
- Investor Presentations

Step 4 - Data Triangulation
Involves using different sources of information in order to increase the validity of a study
These sources are likely to be stakeholders in a program - participants, other researchers, program staff, other community members, and so on.
Then we put all data in single framework & apply various statistical tools to find out the dynamic on the market.
During the analysis stage, feedback from the stakeholder groups would be compared to determine areas of agreement as well as areas of divergence