

Key Insights
The global food and non-food retail market is a dynamic and expansive sector, exhibiting robust growth driven by several key factors. E-commerce penetration continues to surge, fueled by increasing internet access and consumer preference for online shopping convenience. This shift is particularly pronounced in the non-food retail segment, where categories like electronics, apparel, and home goods benefit from the efficient logistics and broad reach of online platforms. Simultaneously, the food retail sector is adapting, integrating online ordering and delivery services to meet evolving consumer demands. Changing consumer lifestyles, including increased urbanization and busier schedules, drive demand for ready-to-eat meals, convenience stores, and quick-commerce options. Furthermore, the rise of omnichannel retailing, combining online and offline experiences, is reshaping the competitive landscape. Major players like Walmart, Amazon, and Target are strategically investing in both online and physical store networks, creating seamless shopping journeys for consumers. While the market shows strong growth potential, challenges exist. Supply chain disruptions, inflationary pressures, and fluctuating commodity prices present significant headwinds. Maintaining efficient supply chains and effectively managing pricing strategies will be crucial for continued success.
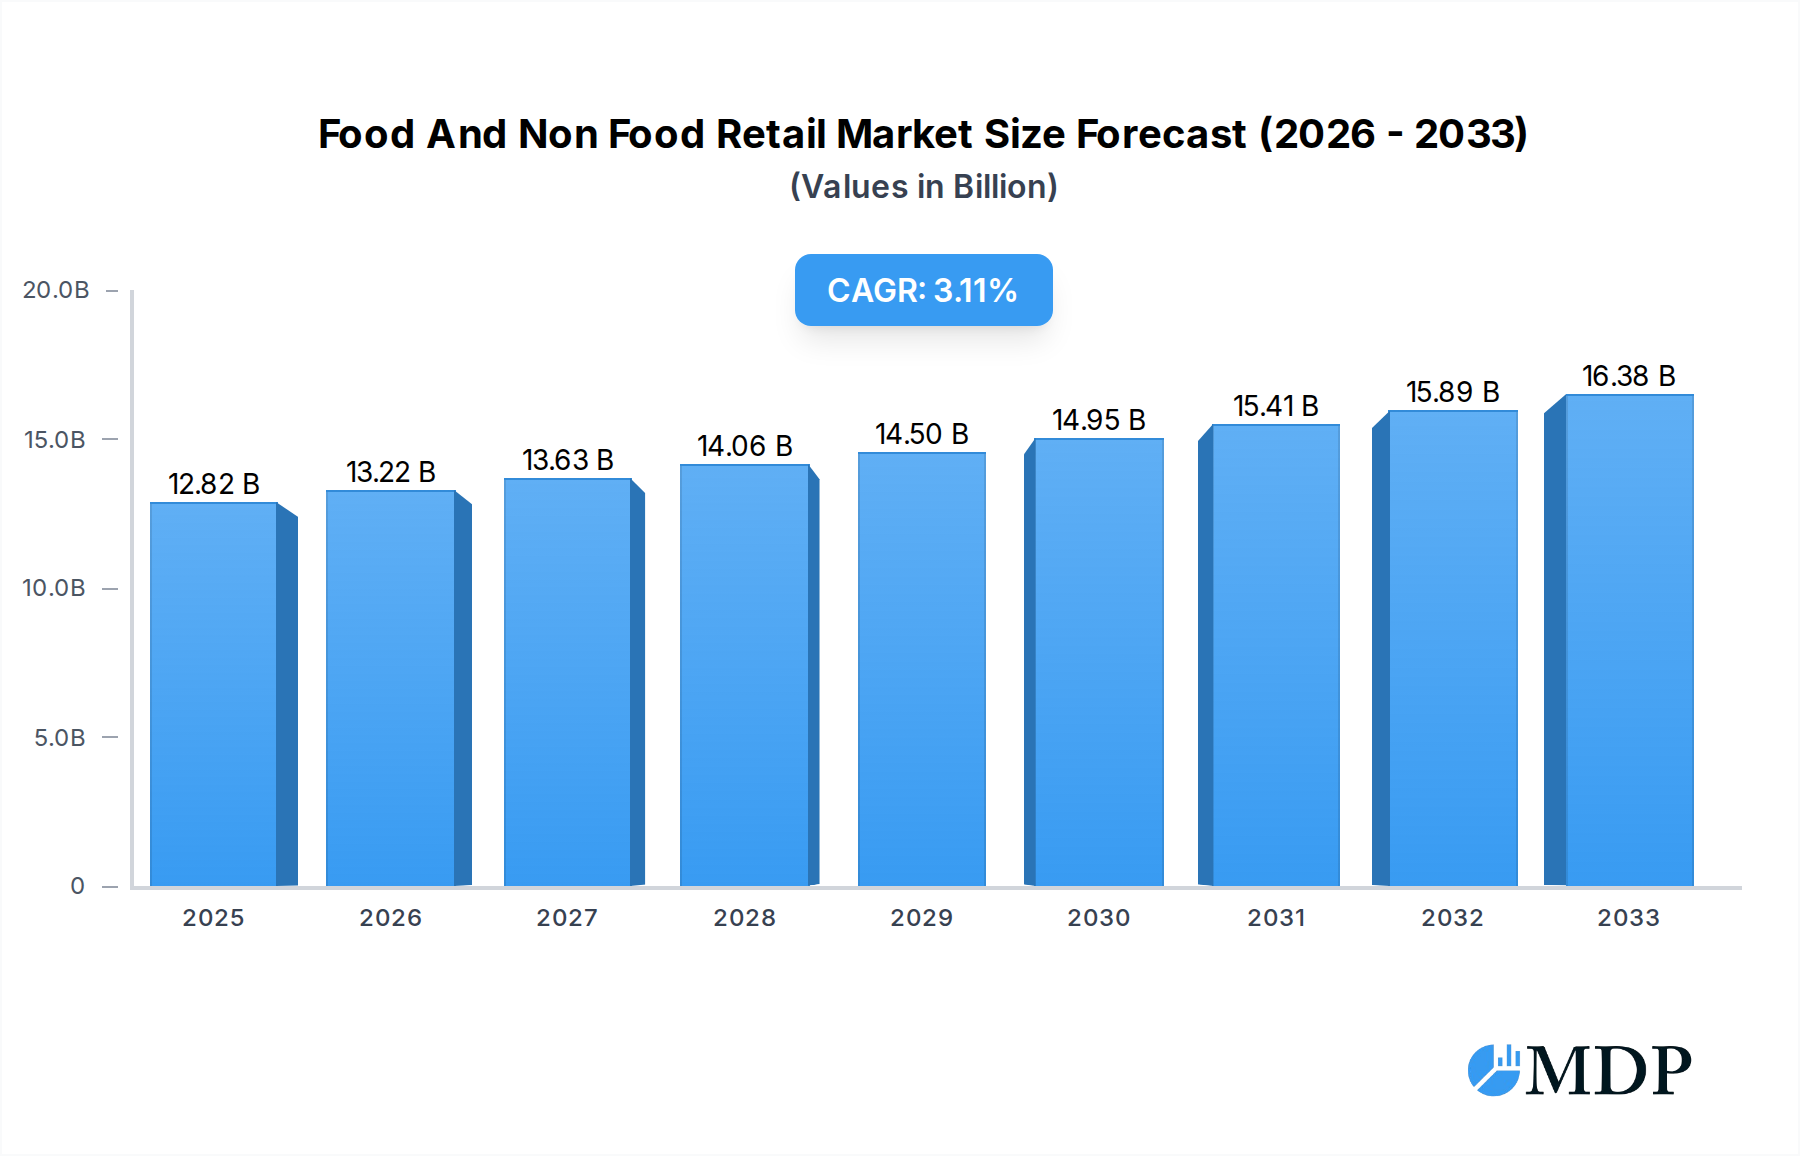
Food And Non Food Retail Market Size (In Million)
The competitive landscape is intensely competitive, with established giants like Walmart and Amazon vying for market share alongside specialty retailers and emerging e-commerce players. Differentiation is key; retailers are focusing on personalized experiences, loyalty programs, and innovative shopping formats. The segmentations within the market—food and non-food—show distinct growth trajectories, with the non-food segment possibly experiencing slightly higher growth due to its adaptability to e-commerce. Regional variations are also significant; developed markets like North America and Europe might show maturity and steady growth while emerging economies show considerable expansion potential. A deeper analysis into specific regions and sub-segments will reveal more granular insights and opportunities. Long-term growth is predicated on adapting to changing consumer behavior, embracing technology, and efficiently managing operational challenges within a volatile global economy.

Food And Non Food Retail Company Market Share
Unlock the Secrets to Food and Non-Food Retail Success: A Comprehensive Market Report (2019-2033)
This in-depth report provides a comprehensive analysis of the global Food and Non-Food Retail market, offering invaluable insights for stakeholders seeking to navigate the dynamic landscape and capitalize on emerging opportunities. Covering the period from 2019 to 2033, with a base year of 2025 and a forecast period spanning 2025-2033, this report unveils crucial market trends, competitive dynamics, and future growth projections. The study analyzes key players like Walmart, Apple, CVS Health, Amazon, Express, Best Buy, TJX, Coop, Inditex, H&M, and Dollar General, providing actionable intelligence to inform strategic decision-making. Millions are used for all value references.
Food And Non Food Retail Market Dynamics & Concentration
This section delves into the intricacies of market concentration, analyzing the competitive landscape and identifying key drivers shaping industry evolution. We examine innovation trends, regulatory frameworks, the impact of product substitutes, evolving end-user preferences, and the significant role of mergers and acquisitions (M&A) activities.
- Market Concentration: The market exhibits a moderately concentrated structure, with the top five players holding approximately xx% of the market share in 2024. This concentration is expected to xx% by 2033.
- Innovation Drivers: Technological advancements such as AI-powered inventory management, personalized shopping experiences, and omnichannel integration are driving significant innovation.
- Regulatory Frameworks: Government regulations concerning data privacy, food safety, and e-commerce are shaping market practices and influencing competitive strategies.
- Product Substitutes: The rise of online marketplaces and subscription services presents notable challenges, forcing traditional retailers to adapt.
- End-User Trends: Growing consumer demand for convenience, sustainability, and personalized experiences are reshaping retail strategies.
- M&A Activities: The past five years have witnessed xx M&A deals in the Food and Non-Food Retail sector, indicating a consolidation trend with larger players seeking expansion and market dominance.
Food And Non Food Retail Industry Trends & Analysis
This section provides a detailed analysis of the market's growth trajectory, exploring key drivers, disruptive technologies, evolving consumer preferences, and the competitive dynamics at play. We present a comprehensive overview, including quantitative metrics such as CAGR and market penetration rates.
The global Food and Non-Food Retail market experienced a CAGR of xx% during the historical period (2019-2024). This growth is primarily attributed to factors such as rising disposable incomes, increasing urbanization, and the proliferation of e-commerce. Technological disruptions like the rise of mobile commerce and the adoption of big data analytics are transforming the industry landscape. Shifting consumer preferences towards healthier food options and sustainable practices are also shaping product development and marketing strategies. Intense competition among established players and the emergence of new entrants create a dynamic and rapidly evolving market. Market penetration of online grocery shopping reached xx% in 2024 and is projected to reach xx% by 2033.
Leading Markets & Segments in Food And Non Food Retail
This section identifies the dominant regions, countries, and segments within the Food and Non-Food Retail market. We highlight key drivers responsible for their dominance, providing a granular analysis supported by qualitative and quantitative data.
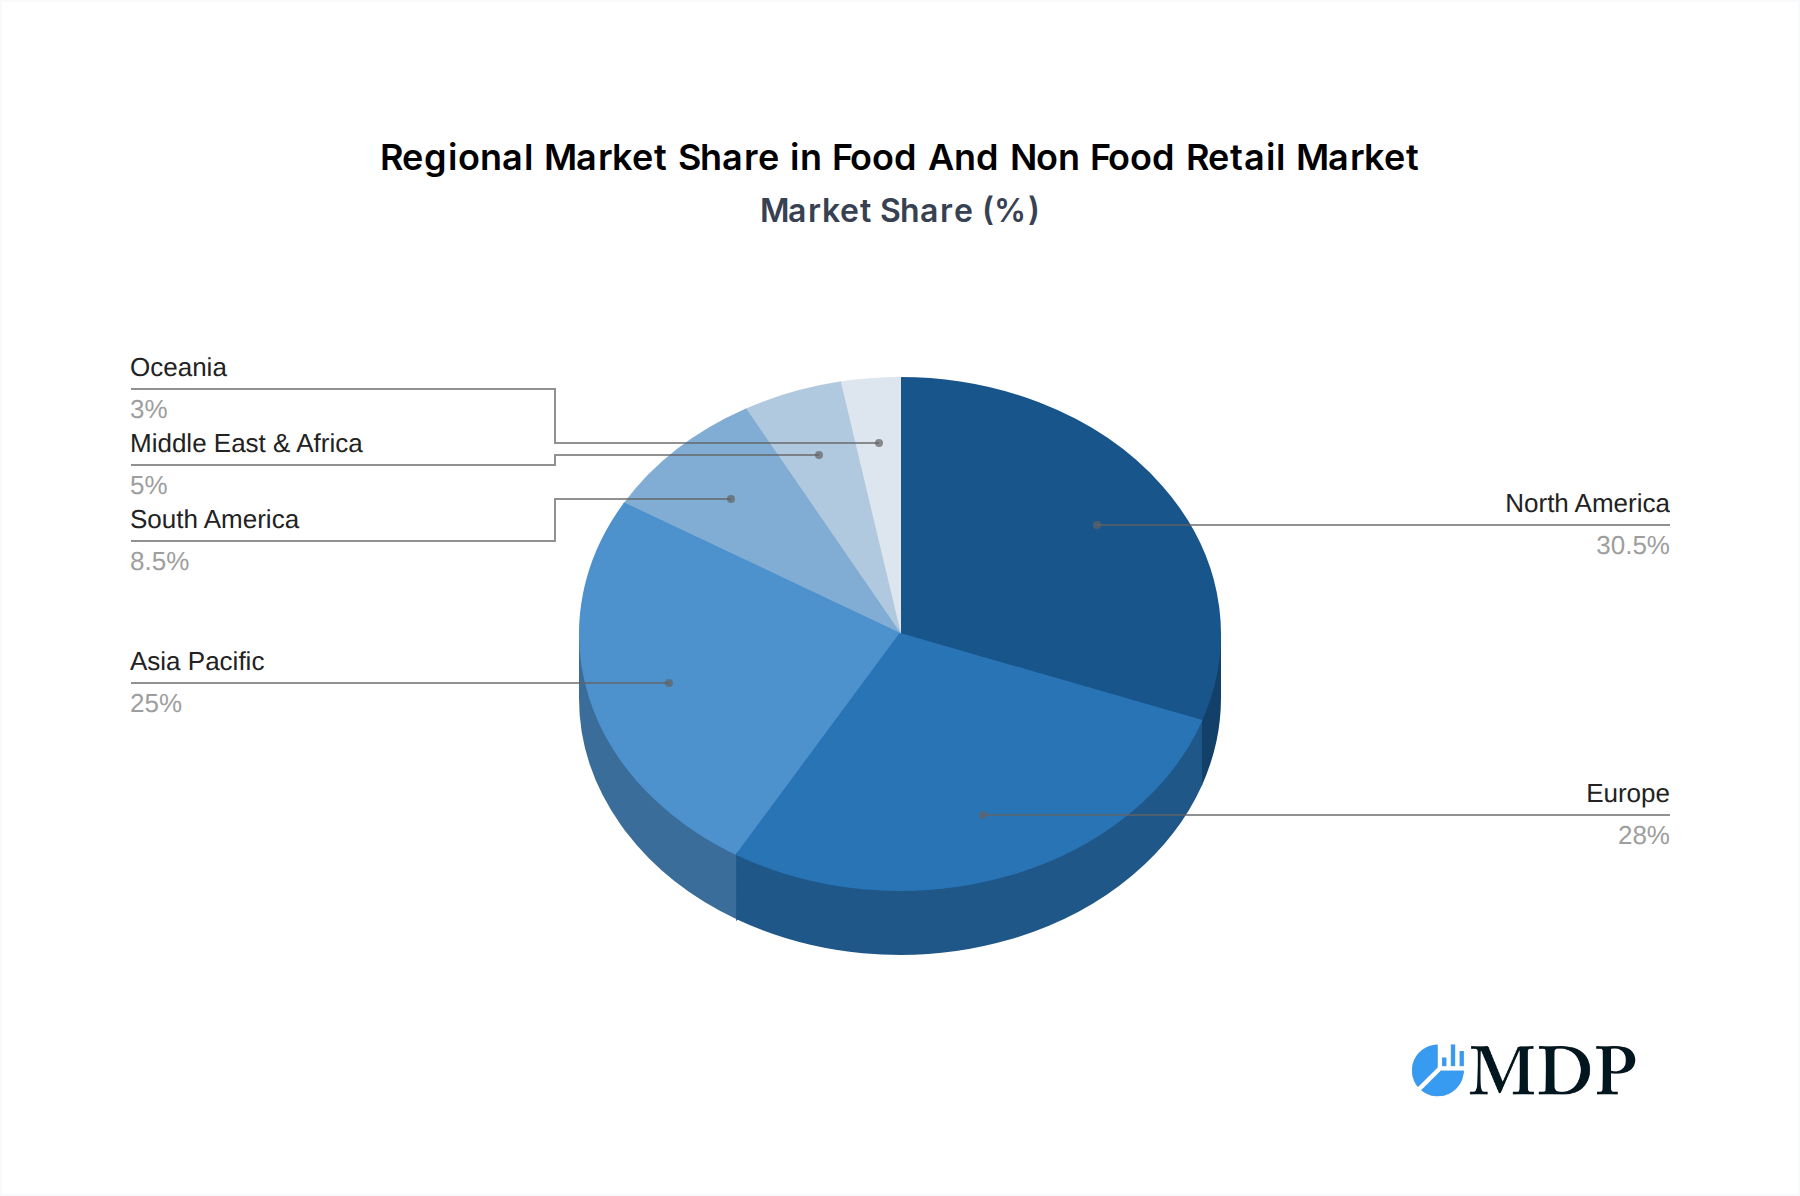
- Dominant Region: North America currently holds the largest market share, driven by factors such as robust economic growth, high consumer spending, and well-developed retail infrastructure.
- Key Drivers:
- North America: High disposable incomes, advanced technological infrastructure, and a strong preference for online shopping.
- Europe: Growing demand for organic and sustainable products, coupled with government initiatives promoting e-commerce.
- Asia-Pacific: Rapid economic growth, expanding middle class, and increasing urbanization driving market expansion.
The dominance of North America is expected to continue throughout the forecast period, although the Asia-Pacific region is poised for significant growth, driven by rapid economic development and changing consumer behavior.
Food And Non Food Retail Product Developments
Recent product innovations have focused on enhancing customer experience through personalized recommendations, improved supply chain management, and integration of various technological advancements. This includes the development of loyalty programs, mobile payment systems, and AI-powered chatbots that enhance customer interaction and purchase efficiency. The success of these innovations depends on a strong alignment between technological advancements and consumer demand for convenience and efficiency, which continues to drive adoption rates.
Key Drivers of Food And Non Food Retail Growth
The growth of the Food and Non-Food Retail market is propelled by several key factors. Firstly, the expansion of e-commerce and the rising adoption of online shopping platforms are driving considerable market growth. Secondly, the increasing availability of credit and consumer financing options contribute to higher spending levels. Finally, government initiatives aimed at boosting infrastructure and promoting economic development create an encouraging environment for industry growth.
Challenges in the Food And Non Food Retail Market
The Food and Non-Food Retail sector faces numerous challenges. Stringent regulatory compliance requirements, increasing labor costs, supply chain disruptions resulting in stock-outs, and intense competition from both established players and new market entrants present significant hurdles. These challenges have a measurable impact on profitability and market share, necessitating strategic adaptation by industry players. For example, supply chain disruptions in 2022 led to a xx% increase in retail prices.
Emerging Opportunities in Food And Non Food Retail
The Food and Non-Food Retail market presents several promising opportunities. The rising adoption of big data analytics and AI-powered solutions offers enhanced personalization and optimization of operations. Strategic partnerships between retailers and technology providers create new avenues for growth. Expansion into new and emerging markets with untapped potential provides further opportunities for expansion and diversification.
Key Milestones in Food And Non Food Retail Industry
- 2020: Increased adoption of contactless payments due to the COVID-19 pandemic.
- 2021: Significant investment in warehouse automation and supply chain optimization.
- 2022: The launch of several omnichannel initiatives, combining physical and online shopping experiences.
- 2023: Increased focus on sustainability and ethical sourcing of products.
- 2024: Expansion of grocery delivery services and online grocery shopping.
Strategic Outlook for Food And Non Food Retail Market
The future of the Food and Non-Food Retail market appears promising, driven by continuous technological advancements and changing consumer preferences. Strategic investments in digital infrastructure, personalized shopping experiences, and supply chain optimization will be crucial for success. Expanding into new markets and leveraging strategic partnerships will further enhance market penetration and growth. The focus on sustainability and ethical practices will play an increasingly important role in shaping the industry's future trajectory.
Food And Non Food Retail Segmentation
-
1. Application
- 1.1. To Ending Consumers
- 1.2. Ad
- 1.3. Others
-
2. Type
- 2.1. Internet Sales
- 2.2. Store Sales
Food And Non Food Retail Segmentation By Geography
-
1. North America
- 1.1. United States
- 1.2. Canada
- 1.3. Mexico
-
2. South America
- 2.1. Brazil
- 2.2. Argentina
- 2.3. Rest of South America
-
3. Europe
- 3.1. United Kingdom
- 3.2. Germany
- 3.3. France
- 3.4. Italy
- 3.5. Spain
- 3.6. Russia
- 3.7. Benelux
- 3.8. Nordics
- 3.9. Rest of Europe
-
4. Middle East & Africa
- 4.1. Turkey
- 4.2. Israel
- 4.3. GCC
- 4.4. North Africa
- 4.5. South Africa
- 4.6. Rest of Middle East & Africa
-
5. Asia Pacific
- 5.1. China
- 5.2. India
- 5.3. Japan
- 5.4. South Korea
- 5.5. ASEAN
- 5.6. Oceania
- 5.7. Rest of Asia Pacific
Food And Non Food Retail Regional Market Share
Geographic Coverage of Food And Non Food Retail
Food And Non Food Retail REPORT HIGHLIGHTS
| Aspects | Details |
|---|---|
| Study Period | 2020-2034 |
| Base Year | 2025 |
| Estimated Year | 2026 |
| Forecast Period | 2026-2034 |
| Historical Period | 2020-2025 |
| Growth Rate | CAGR of 3.2% from 2020-2034 |
| Segmentation |
|
Table of Contents
- 1. Introduction
- 1.1. Research Scope
- 1.2. Market Segmentation
- 1.3. Research Methodology
- 1.4. Definitions and Assumptions
- 2. Executive Summary
- 2.1. Introduction
- 3. Market Dynamics
- 3.1. Introduction
- 3.2. Market Drivers
- 3.3. Market Restrains
- 3.4. Market Trends
- 4. Market Factor Analysis
- 4.1. Porters Five Forces
- 4.2. Supply/Value Chain
- 4.3. PESTEL analysis
- 4.4. Market Entropy
- 4.5. Patent/Trademark Analysis
- 5. Global Food And Non Food Retail Analysis, Insights and Forecast, 2020-2032
- 5.1. Market Analysis, Insights and Forecast - by Application
- 5.1.1. To Ending Consumers
- 5.1.2. Ad
- 5.1.3. Others
- 5.2. Market Analysis, Insights and Forecast - by Type
- 5.2.1. Internet Sales
- 5.2.2. Store Sales
- 5.3. Market Analysis, Insights and Forecast - by Region
- 5.3.1. North America
- 5.3.2. South America
- 5.3.3. Europe
- 5.3.4. Middle East & Africa
- 5.3.5. Asia Pacific
- 5.1. Market Analysis, Insights and Forecast - by Application
- 6. North America Food And Non Food Retail Analysis, Insights and Forecast, 2020-2032
- 6.1. Market Analysis, Insights and Forecast - by Application
- 6.1.1. To Ending Consumers
- 6.1.2. Ad
- 6.1.3. Others
- 6.2. Market Analysis, Insights and Forecast - by Type
- 6.2.1. Internet Sales
- 6.2.2. Store Sales
- 6.1. Market Analysis, Insights and Forecast - by Application
- 7. South America Food And Non Food Retail Analysis, Insights and Forecast, 2020-2032
- 7.1. Market Analysis, Insights and Forecast - by Application
- 7.1.1. To Ending Consumers
- 7.1.2. Ad
- 7.1.3. Others
- 7.2. Market Analysis, Insights and Forecast - by Type
- 7.2.1. Internet Sales
- 7.2.2. Store Sales
- 7.1. Market Analysis, Insights and Forecast - by Application
- 8. Europe Food And Non Food Retail Analysis, Insights and Forecast, 2020-2032
- 8.1. Market Analysis, Insights and Forecast - by Application
- 8.1.1. To Ending Consumers
- 8.1.2. Ad
- 8.1.3. Others
- 8.2. Market Analysis, Insights and Forecast - by Type
- 8.2.1. Internet Sales
- 8.2.2. Store Sales
- 8.1. Market Analysis, Insights and Forecast - by Application
- 9. Middle East & Africa Food And Non Food Retail Analysis, Insights and Forecast, 2020-2032
- 9.1. Market Analysis, Insights and Forecast - by Application
- 9.1.1. To Ending Consumers
- 9.1.2. Ad
- 9.1.3. Others
- 9.2. Market Analysis, Insights and Forecast - by Type
- 9.2.1. Internet Sales
- 9.2.2. Store Sales
- 9.1. Market Analysis, Insights and Forecast - by Application
- 10. Asia Pacific Food And Non Food Retail Analysis, Insights and Forecast, 2020-2032
- 10.1. Market Analysis, Insights and Forecast - by Application
- 10.1.1. To Ending Consumers
- 10.1.2. Ad
- 10.1.3. Others
- 10.2. Market Analysis, Insights and Forecast - by Type
- 10.2.1. Internet Sales
- 10.2.2. Store Sales
- 10.1. Market Analysis, Insights and Forecast - by Application
- 11. Competitive Analysis
- 11.1. Global Market Share Analysis 2025
- 11.2. Company Profiles
- 11.2.1 Walmat
- 11.2.1.1. Overview
- 11.2.1.2. Products
- 11.2.1.3. SWOT Analysis
- 11.2.1.4. Recent Developments
- 11.2.1.5. Financials (Based on Availability)
- 11.2.2 Apple
- 11.2.2.1. Overview
- 11.2.2.2. Products
- 11.2.2.3. SWOT Analysis
- 11.2.2.4. Recent Developments
- 11.2.2.5. Financials (Based on Availability)
- 11.2.3 CVS Health
- 11.2.3.1. Overview
- 11.2.3.2. Products
- 11.2.3.3. SWOT Analysis
- 11.2.3.4. Recent Developments
- 11.2.3.5. Financials (Based on Availability)
- 11.2.4 Amazon
- 11.2.4.1. Overview
- 11.2.4.2. Products
- 11.2.4.3. SWOT Analysis
- 11.2.4.4. Recent Developments
- 11.2.4.5. Financials (Based on Availability)
- 11.2.5 Express
- 11.2.5.1. Overview
- 11.2.5.2. Products
- 11.2.5.3. SWOT Analysis
- 11.2.5.4. Recent Developments
- 11.2.5.5. Financials (Based on Availability)
- 11.2.6 Bestbuy
- 11.2.6.1. Overview
- 11.2.6.2. Products
- 11.2.6.3. SWOT Analysis
- 11.2.6.4. Recent Developments
- 11.2.6.5. Financials (Based on Availability)
- 11.2.7 Tjx
- 11.2.7.1. Overview
- 11.2.7.2. Products
- 11.2.7.3. SWOT Analysis
- 11.2.7.4. Recent Developments
- 11.2.7.5. Financials (Based on Availability)
- 11.2.8 Coop
- 11.2.8.1. Overview
- 11.2.8.2. Products
- 11.2.8.3. SWOT Analysis
- 11.2.8.4. Recent Developments
- 11.2.8.5. Financials (Based on Availability)
- 11.2.9 Inditex
- 11.2.9.1. Overview
- 11.2.9.2. Products
- 11.2.9.3. SWOT Analysis
- 11.2.9.4. Recent Developments
- 11.2.9.5. Financials (Based on Availability)
- 11.2.10 H&M
- 11.2.10.1. Overview
- 11.2.10.2. Products
- 11.2.10.3. SWOT Analysis
- 11.2.10.4. Recent Developments
- 11.2.10.5. Financials (Based on Availability)
- 11.2.11 Dollar General
- 11.2.11.1. Overview
- 11.2.11.2. Products
- 11.2.11.3. SWOT Analysis
- 11.2.11.4. Recent Developments
- 11.2.11.5. Financials (Based on Availability)
- 11.2.1 Walmat
List of Figures
- Figure 1: Global Food And Non Food Retail Revenue Breakdown (undefined, %) by Region 2025 & 2033
- Figure 2: Global Food And Non Food Retail Volume Breakdown (K, %) by Region 2025 & 2033
- Figure 3: North America Food And Non Food Retail Revenue (undefined), by Application 2025 & 2033
- Figure 4: North America Food And Non Food Retail Volume (K), by Application 2025 & 2033
- Figure 5: North America Food And Non Food Retail Revenue Share (%), by Application 2025 & 2033
- Figure 6: North America Food And Non Food Retail Volume Share (%), by Application 2025 & 2033
- Figure 7: North America Food And Non Food Retail Revenue (undefined), by Type 2025 & 2033
- Figure 8: North America Food And Non Food Retail Volume (K), by Type 2025 & 2033
- Figure 9: North America Food And Non Food Retail Revenue Share (%), by Type 2025 & 2033
- Figure 10: North America Food And Non Food Retail Volume Share (%), by Type 2025 & 2033
- Figure 11: North America Food And Non Food Retail Revenue (undefined), by Country 2025 & 2033
- Figure 12: North America Food And Non Food Retail Volume (K), by Country 2025 & 2033
- Figure 13: North America Food And Non Food Retail Revenue Share (%), by Country 2025 & 2033
- Figure 14: North America Food And Non Food Retail Volume Share (%), by Country 2025 & 2033
- Figure 15: South America Food And Non Food Retail Revenue (undefined), by Application 2025 & 2033
- Figure 16: South America Food And Non Food Retail Volume (K), by Application 2025 & 2033
- Figure 17: South America Food And Non Food Retail Revenue Share (%), by Application 2025 & 2033
- Figure 18: South America Food And Non Food Retail Volume Share (%), by Application 2025 & 2033
- Figure 19: South America Food And Non Food Retail Revenue (undefined), by Type 2025 & 2033
- Figure 20: South America Food And Non Food Retail Volume (K), by Type 2025 & 2033
- Figure 21: South America Food And Non Food Retail Revenue Share (%), by Type 2025 & 2033
- Figure 22: South America Food And Non Food Retail Volume Share (%), by Type 2025 & 2033
- Figure 23: South America Food And Non Food Retail Revenue (undefined), by Country 2025 & 2033
- Figure 24: South America Food And Non Food Retail Volume (K), by Country 2025 & 2033
- Figure 25: South America Food And Non Food Retail Revenue Share (%), by Country 2025 & 2033
- Figure 26: South America Food And Non Food Retail Volume Share (%), by Country 2025 & 2033
- Figure 27: Europe Food And Non Food Retail Revenue (undefined), by Application 2025 & 2033
- Figure 28: Europe Food And Non Food Retail Volume (K), by Application 2025 & 2033
- Figure 29: Europe Food And Non Food Retail Revenue Share (%), by Application 2025 & 2033
- Figure 30: Europe Food And Non Food Retail Volume Share (%), by Application 2025 & 2033
- Figure 31: Europe Food And Non Food Retail Revenue (undefined), by Type 2025 & 2033
- Figure 32: Europe Food And Non Food Retail Volume (K), by Type 2025 & 2033
- Figure 33: Europe Food And Non Food Retail Revenue Share (%), by Type 2025 & 2033
- Figure 34: Europe Food And Non Food Retail Volume Share (%), by Type 2025 & 2033
- Figure 35: Europe Food And Non Food Retail Revenue (undefined), by Country 2025 & 2033
- Figure 36: Europe Food And Non Food Retail Volume (K), by Country 2025 & 2033
- Figure 37: Europe Food And Non Food Retail Revenue Share (%), by Country 2025 & 2033
- Figure 38: Europe Food And Non Food Retail Volume Share (%), by Country 2025 & 2033
- Figure 39: Middle East & Africa Food And Non Food Retail Revenue (undefined), by Application 2025 & 2033
- Figure 40: Middle East & Africa Food And Non Food Retail Volume (K), by Application 2025 & 2033
- Figure 41: Middle East & Africa Food And Non Food Retail Revenue Share (%), by Application 2025 & 2033
- Figure 42: Middle East & Africa Food And Non Food Retail Volume Share (%), by Application 2025 & 2033
- Figure 43: Middle East & Africa Food And Non Food Retail Revenue (undefined), by Type 2025 & 2033
- Figure 44: Middle East & Africa Food And Non Food Retail Volume (K), by Type 2025 & 2033
- Figure 45: Middle East & Africa Food And Non Food Retail Revenue Share (%), by Type 2025 & 2033
- Figure 46: Middle East & Africa Food And Non Food Retail Volume Share (%), by Type 2025 & 2033
- Figure 47: Middle East & Africa Food And Non Food Retail Revenue (undefined), by Country 2025 & 2033
- Figure 48: Middle East & Africa Food And Non Food Retail Volume (K), by Country 2025 & 2033
- Figure 49: Middle East & Africa Food And Non Food Retail Revenue Share (%), by Country 2025 & 2033
- Figure 50: Middle East & Africa Food And Non Food Retail Volume Share (%), by Country 2025 & 2033
- Figure 51: Asia Pacific Food And Non Food Retail Revenue (undefined), by Application 2025 & 2033
- Figure 52: Asia Pacific Food And Non Food Retail Volume (K), by Application 2025 & 2033
- Figure 53: Asia Pacific Food And Non Food Retail Revenue Share (%), by Application 2025 & 2033
- Figure 54: Asia Pacific Food And Non Food Retail Volume Share (%), by Application 2025 & 2033
- Figure 55: Asia Pacific Food And Non Food Retail Revenue (undefined), by Type 2025 & 2033
- Figure 56: Asia Pacific Food And Non Food Retail Volume (K), by Type 2025 & 2033
- Figure 57: Asia Pacific Food And Non Food Retail Revenue Share (%), by Type 2025 & 2033
- Figure 58: Asia Pacific Food And Non Food Retail Volume Share (%), by Type 2025 & 2033
- Figure 59: Asia Pacific Food And Non Food Retail Revenue (undefined), by Country 2025 & 2033
- Figure 60: Asia Pacific Food And Non Food Retail Volume (K), by Country 2025 & 2033
- Figure 61: Asia Pacific Food And Non Food Retail Revenue Share (%), by Country 2025 & 2033
- Figure 62: Asia Pacific Food And Non Food Retail Volume Share (%), by Country 2025 & 2033
List of Tables
- Table 1: Global Food And Non Food Retail Revenue undefined Forecast, by Application 2020 & 2033
- Table 2: Global Food And Non Food Retail Volume K Forecast, by Application 2020 & 2033
- Table 3: Global Food And Non Food Retail Revenue undefined Forecast, by Type 2020 & 2033
- Table 4: Global Food And Non Food Retail Volume K Forecast, by Type 2020 & 2033
- Table 5: Global Food And Non Food Retail Revenue undefined Forecast, by Region 2020 & 2033
- Table 6: Global Food And Non Food Retail Volume K Forecast, by Region 2020 & 2033
- Table 7: Global Food And Non Food Retail Revenue undefined Forecast, by Application 2020 & 2033
- Table 8: Global Food And Non Food Retail Volume K Forecast, by Application 2020 & 2033
- Table 9: Global Food And Non Food Retail Revenue undefined Forecast, by Type 2020 & 2033
- Table 10: Global Food And Non Food Retail Volume K Forecast, by Type 2020 & 2033
- Table 11: Global Food And Non Food Retail Revenue undefined Forecast, by Country 2020 & 2033
- Table 12: Global Food And Non Food Retail Volume K Forecast, by Country 2020 & 2033
- Table 13: United States Food And Non Food Retail Revenue (undefined) Forecast, by Application 2020 & 2033
- Table 14: United States Food And Non Food Retail Volume (K) Forecast, by Application 2020 & 2033
- Table 15: Canada Food And Non Food Retail Revenue (undefined) Forecast, by Application 2020 & 2033
- Table 16: Canada Food And Non Food Retail Volume (K) Forecast, by Application 2020 & 2033
- Table 17: Mexico Food And Non Food Retail Revenue (undefined) Forecast, by Application 2020 & 2033
- Table 18: Mexico Food And Non Food Retail Volume (K) Forecast, by Application 2020 & 2033
- Table 19: Global Food And Non Food Retail Revenue undefined Forecast, by Application 2020 & 2033
- Table 20: Global Food And Non Food Retail Volume K Forecast, by Application 2020 & 2033
- Table 21: Global Food And Non Food Retail Revenue undefined Forecast, by Type 2020 & 2033
- Table 22: Global Food And Non Food Retail Volume K Forecast, by Type 2020 & 2033
- Table 23: Global Food And Non Food Retail Revenue undefined Forecast, by Country 2020 & 2033
- Table 24: Global Food And Non Food Retail Volume K Forecast, by Country 2020 & 2033
- Table 25: Brazil Food And Non Food Retail Revenue (undefined) Forecast, by Application 2020 & 2033
- Table 26: Brazil Food And Non Food Retail Volume (K) Forecast, by Application 2020 & 2033
- Table 27: Argentina Food And Non Food Retail Revenue (undefined) Forecast, by Application 2020 & 2033
- Table 28: Argentina Food And Non Food Retail Volume (K) Forecast, by Application 2020 & 2033
- Table 29: Rest of South America Food And Non Food Retail Revenue (undefined) Forecast, by Application 2020 & 2033
- Table 30: Rest of South America Food And Non Food Retail Volume (K) Forecast, by Application 2020 & 2033
- Table 31: Global Food And Non Food Retail Revenue undefined Forecast, by Application 2020 & 2033
- Table 32: Global Food And Non Food Retail Volume K Forecast, by Application 2020 & 2033
- Table 33: Global Food And Non Food Retail Revenue undefined Forecast, by Type 2020 & 2033
- Table 34: Global Food And Non Food Retail Volume K Forecast, by Type 2020 & 2033
- Table 35: Global Food And Non Food Retail Revenue undefined Forecast, by Country 2020 & 2033
- Table 36: Global Food And Non Food Retail Volume K Forecast, by Country 2020 & 2033
- Table 37: United Kingdom Food And Non Food Retail Revenue (undefined) Forecast, by Application 2020 & 2033
- Table 38: United Kingdom Food And Non Food Retail Volume (K) Forecast, by Application 2020 & 2033
- Table 39: Germany Food And Non Food Retail Revenue (undefined) Forecast, by Application 2020 & 2033
- Table 40: Germany Food And Non Food Retail Volume (K) Forecast, by Application 2020 & 2033
- Table 41: France Food And Non Food Retail Revenue (undefined) Forecast, by Application 2020 & 2033
- Table 42: France Food And Non Food Retail Volume (K) Forecast, by Application 2020 & 2033
- Table 43: Italy Food And Non Food Retail Revenue (undefined) Forecast, by Application 2020 & 2033
- Table 44: Italy Food And Non Food Retail Volume (K) Forecast, by Application 2020 & 2033
- Table 45: Spain Food And Non Food Retail Revenue (undefined) Forecast, by Application 2020 & 2033
- Table 46: Spain Food And Non Food Retail Volume (K) Forecast, by Application 2020 & 2033
- Table 47: Russia Food And Non Food Retail Revenue (undefined) Forecast, by Application 2020 & 2033
- Table 48: Russia Food And Non Food Retail Volume (K) Forecast, by Application 2020 & 2033
- Table 49: Benelux Food And Non Food Retail Revenue (undefined) Forecast, by Application 2020 & 2033
- Table 50: Benelux Food And Non Food Retail Volume (K) Forecast, by Application 2020 & 2033
- Table 51: Nordics Food And Non Food Retail Revenue (undefined) Forecast, by Application 2020 & 2033
- Table 52: Nordics Food And Non Food Retail Volume (K) Forecast, by Application 2020 & 2033
- Table 53: Rest of Europe Food And Non Food Retail Revenue (undefined) Forecast, by Application 2020 & 2033
- Table 54: Rest of Europe Food And Non Food Retail Volume (K) Forecast, by Application 2020 & 2033
- Table 55: Global Food And Non Food Retail Revenue undefined Forecast, by Application 2020 & 2033
- Table 56: Global Food And Non Food Retail Volume K Forecast, by Application 2020 & 2033
- Table 57: Global Food And Non Food Retail Revenue undefined Forecast, by Type 2020 & 2033
- Table 58: Global Food And Non Food Retail Volume K Forecast, by Type 2020 & 2033
- Table 59: Global Food And Non Food Retail Revenue undefined Forecast, by Country 2020 & 2033
- Table 60: Global Food And Non Food Retail Volume K Forecast, by Country 2020 & 2033
- Table 61: Turkey Food And Non Food Retail Revenue (undefined) Forecast, by Application 2020 & 2033
- Table 62: Turkey Food And Non Food Retail Volume (K) Forecast, by Application 2020 & 2033
- Table 63: Israel Food And Non Food Retail Revenue (undefined) Forecast, by Application 2020 & 2033
- Table 64: Israel Food And Non Food Retail Volume (K) Forecast, by Application 2020 & 2033
- Table 65: GCC Food And Non Food Retail Revenue (undefined) Forecast, by Application 2020 & 2033
- Table 66: GCC Food And Non Food Retail Volume (K) Forecast, by Application 2020 & 2033
- Table 67: North Africa Food And Non Food Retail Revenue (undefined) Forecast, by Application 2020 & 2033
- Table 68: North Africa Food And Non Food Retail Volume (K) Forecast, by Application 2020 & 2033
- Table 69: South Africa Food And Non Food Retail Revenue (undefined) Forecast, by Application 2020 & 2033
- Table 70: South Africa Food And Non Food Retail Volume (K) Forecast, by Application 2020 & 2033
- Table 71: Rest of Middle East & Africa Food And Non Food Retail Revenue (undefined) Forecast, by Application 2020 & 2033
- Table 72: Rest of Middle East & Africa Food And Non Food Retail Volume (K) Forecast, by Application 2020 & 2033
- Table 73: Global Food And Non Food Retail Revenue undefined Forecast, by Application 2020 & 2033
- Table 74: Global Food And Non Food Retail Volume K Forecast, by Application 2020 & 2033
- Table 75: Global Food And Non Food Retail Revenue undefined Forecast, by Type 2020 & 2033
- Table 76: Global Food And Non Food Retail Volume K Forecast, by Type 2020 & 2033
- Table 77: Global Food And Non Food Retail Revenue undefined Forecast, by Country 2020 & 2033
- Table 78: Global Food And Non Food Retail Volume K Forecast, by Country 2020 & 2033
- Table 79: China Food And Non Food Retail Revenue (undefined) Forecast, by Application 2020 & 2033
- Table 80: China Food And Non Food Retail Volume (K) Forecast, by Application 2020 & 2033
- Table 81: India Food And Non Food Retail Revenue (undefined) Forecast, by Application 2020 & 2033
- Table 82: India Food And Non Food Retail Volume (K) Forecast, by Application 2020 & 2033
- Table 83: Japan Food And Non Food Retail Revenue (undefined) Forecast, by Application 2020 & 2033
- Table 84: Japan Food And Non Food Retail Volume (K) Forecast, by Application 2020 & 2033
- Table 85: South Korea Food And Non Food Retail Revenue (undefined) Forecast, by Application 2020 & 2033
- Table 86: South Korea Food And Non Food Retail Volume (K) Forecast, by Application 2020 & 2033
- Table 87: ASEAN Food And Non Food Retail Revenue (undefined) Forecast, by Application 2020 & 2033
- Table 88: ASEAN Food And Non Food Retail Volume (K) Forecast, by Application 2020 & 2033
- Table 89: Oceania Food And Non Food Retail Revenue (undefined) Forecast, by Application 2020 & 2033
- Table 90: Oceania Food And Non Food Retail Volume (K) Forecast, by Application 2020 & 2033
- Table 91: Rest of Asia Pacific Food And Non Food Retail Revenue (undefined) Forecast, by Application 2020 & 2033
- Table 92: Rest of Asia Pacific Food And Non Food Retail Volume (K) Forecast, by Application 2020 & 2033
Frequently Asked Questions
1. What is the projected Compound Annual Growth Rate (CAGR) of the Food And Non Food Retail?
The projected CAGR is approximately 3.2%.
2. Which companies are prominent players in the Food And Non Food Retail?
Key companies in the market include Walmat, Apple, CVS Health, Amazon, Express, Bestbuy, Tjx, Coop, Inditex, H&M, Dollar General.
3. What are the main segments of the Food And Non Food Retail?
The market segments include Application, Type.
4. Can you provide details about the market size?
The market size is estimated to be USD XXX N/A as of 2022.
5. What are some drivers contributing to market growth?
N/A
6. What are the notable trends driving market growth?
N/A
7. Are there any restraints impacting market growth?
N/A
8. Can you provide examples of recent developments in the market?
N/A
9. What pricing options are available for accessing the report?
Pricing options include single-user, multi-user, and enterprise licenses priced at USD 3950.00, USD 5925.00, and USD 7900.00 respectively.
10. Is the market size provided in terms of value or volume?
The market size is provided in terms of value, measured in N/A and volume, measured in K.
11. Are there any specific market keywords associated with the report?
Yes, the market keyword associated with the report is "Food And Non Food Retail," which aids in identifying and referencing the specific market segment covered.
12. How do I determine which pricing option suits my needs best?
The pricing options vary based on user requirements and access needs. Individual users may opt for single-user licenses, while businesses requiring broader access may choose multi-user or enterprise licenses for cost-effective access to the report.
13. Are there any additional resources or data provided in the Food And Non Food Retail report?
While the report offers comprehensive insights, it's advisable to review the specific contents or supplementary materials provided to ascertain if additional resources or data are available.
14. How can I stay updated on further developments or reports in the Food And Non Food Retail?
To stay informed about further developments, trends, and reports in the Food And Non Food Retail, consider subscribing to industry newsletters, following relevant companies and organizations, or regularly checking reputable industry news sources and publications.
Methodology
Step 1 - Identification of Relevant Samples Size from Population Database


Step 2 - Approaches for Defining Global Market Size (Value, Volume* & Price*)

Note*: In applicable scenarios
Step 3 - Data Sources
Primary Research
- Web Analytics
- Survey Reports
- Research Institute
- Latest Research Reports
- Opinion Leaders
Secondary Research
- Annual Reports
- White Paper
- Latest Press Release
- Industry Association
- Paid Database
- Investor Presentations

Step 4 - Data Triangulation
Involves using different sources of information in order to increase the validity of a study
These sources are likely to be stakeholders in a program - participants, other researchers, program staff, other community members, and so on.
Then we put all data in single framework & apply various statistical tools to find out the dynamic on the market.
During the analysis stage, feedback from the stakeholder groups would be compared to determine areas of agreement as well as areas of divergence