

Key Insights
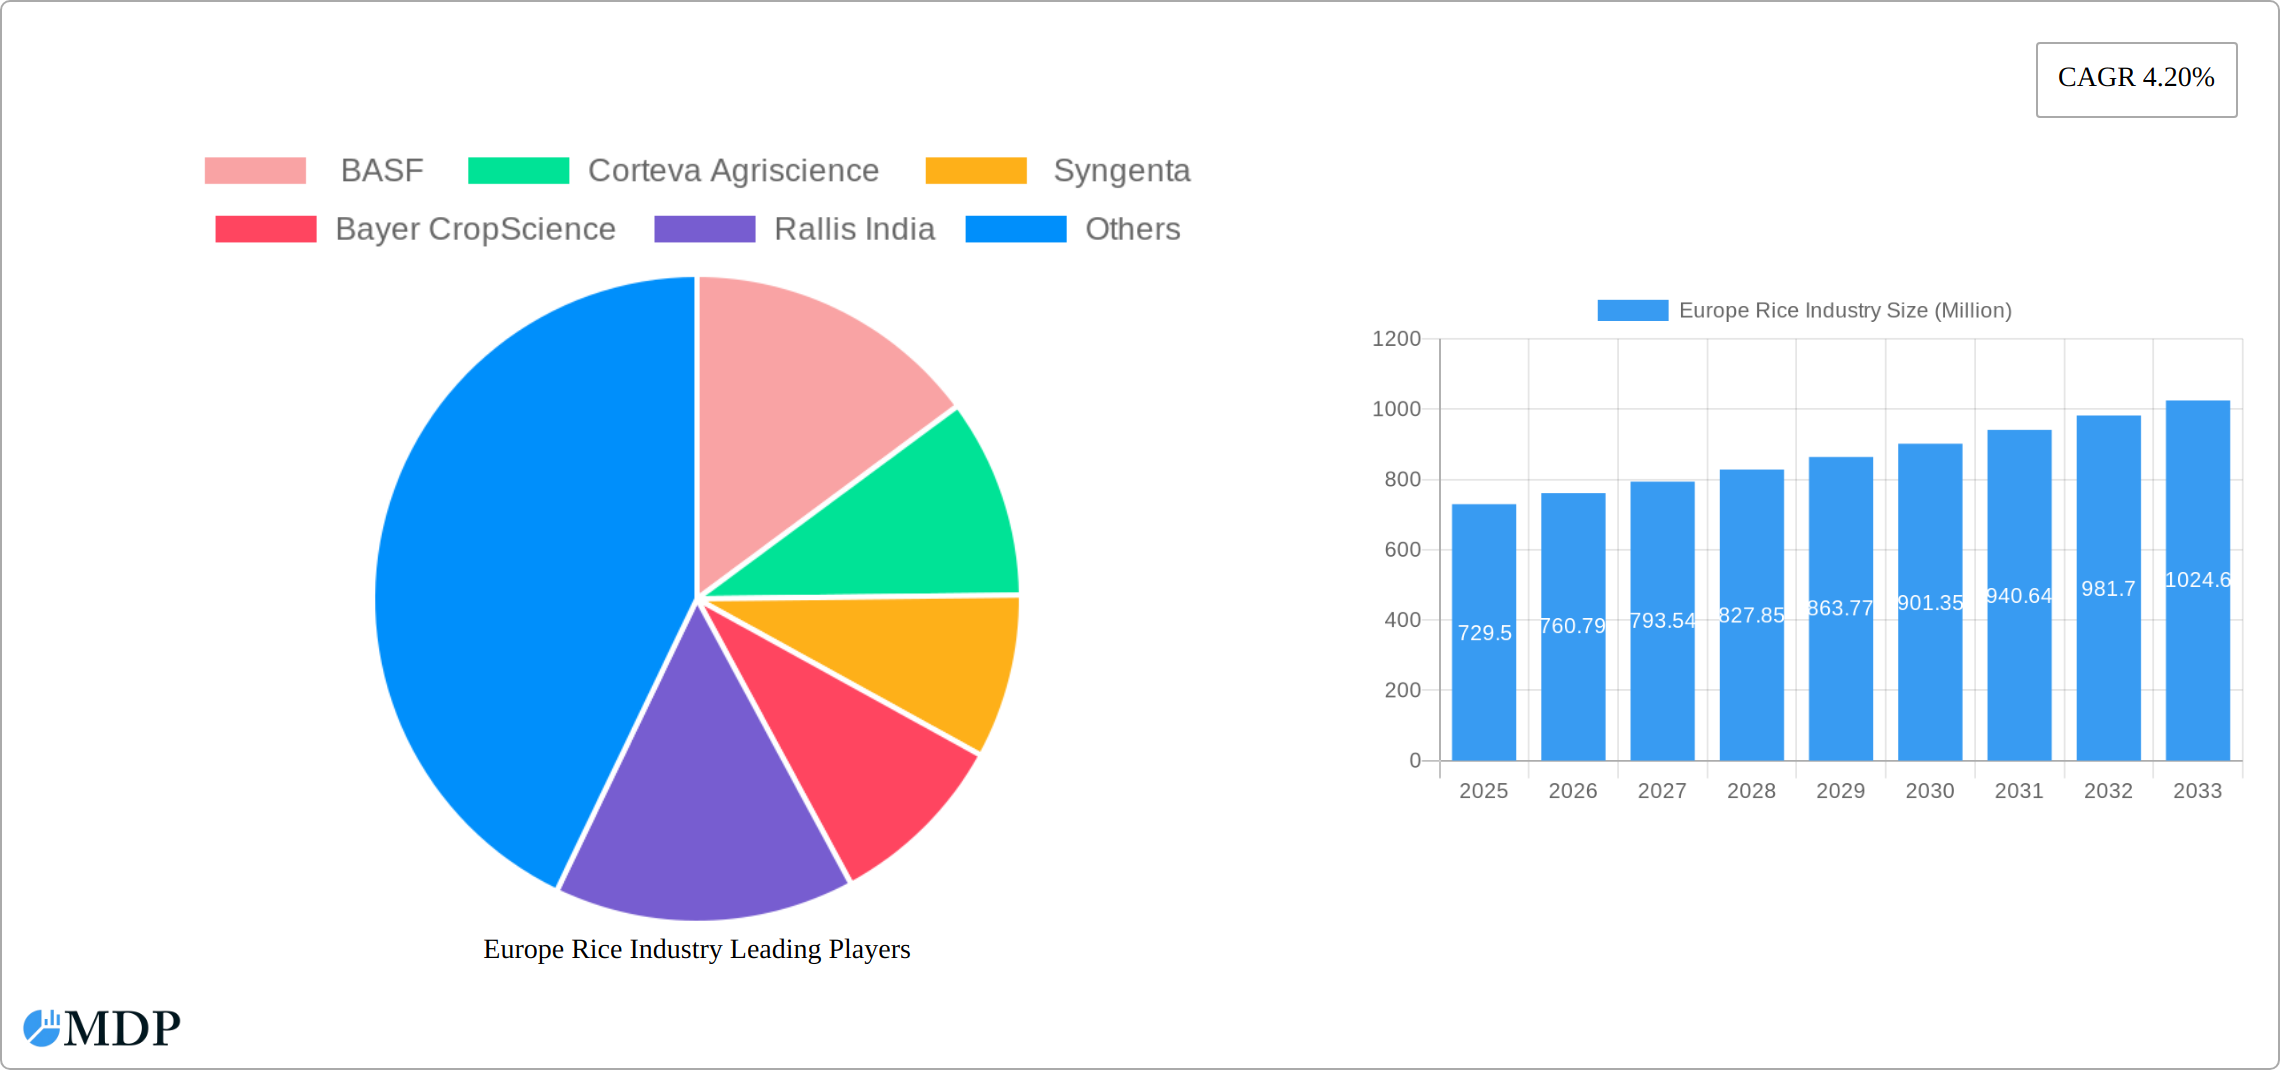
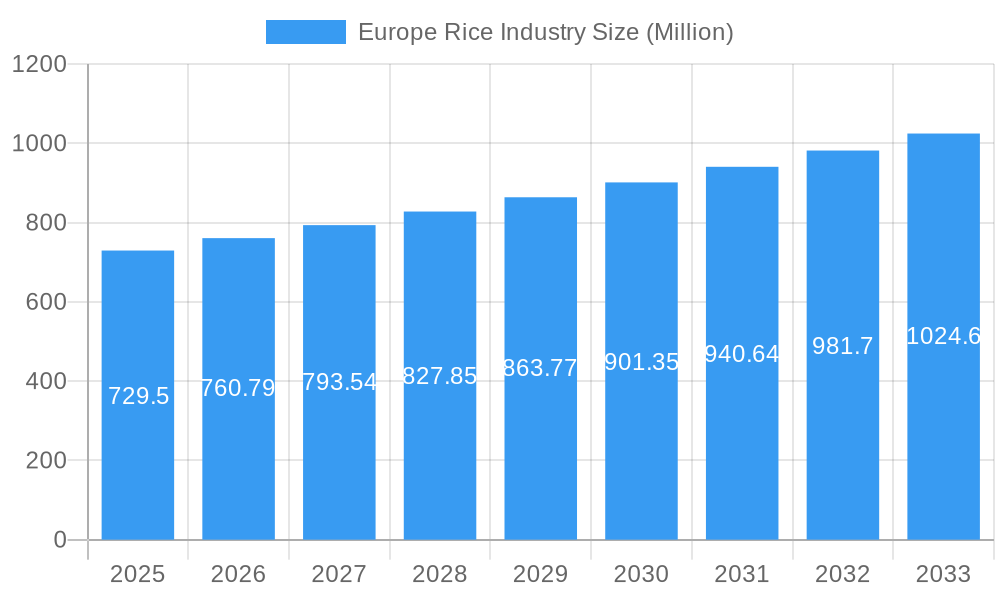
The European rice market, valued at €729.50 million in 2025, is projected to experience steady growth, driven by increasing demand for convenient and healthy food options, a growing population, and rising disposable incomes across several key European nations. The 4.20% CAGR signifies a consistent expansion, particularly within the segments of parboiled and organic rice. The food and beverage industry constitutes the largest application segment, fueled by the versatility of rice in culinary applications and its increasing use in processed foods. While conventional rice maintains a significant market share, the organic rice segment shows particularly robust growth, reflecting consumer preferences for sustainable and ethically sourced products. Germany, France, and Italy represent the largest national markets within Europe, exhibiting strong purchasing power and established rice consumption patterns. However, the market faces some restraints, including potential price volatility associated with global rice production and competition from alternative grains. The presence of significant agricultural chemical companies like BASF, Corteva Agriscience, and Syngenta indicates a robust supply chain and ongoing investment in research and development to improve rice yields and quality.
Europe Rice Industry Market Size (In Million)
Growth will be further propelled by innovative product development, including fortified and functional rice varieties catering to specific health needs. The rise of e-commerce and online grocery shopping also presents opportunities for market expansion. However, challenges such as potential climate change impacts on rice production and evolving consumer preferences regarding food sourcing and sustainability must be addressed for sustained growth. The projected growth indicates continued success, with the market expected to show strong performance throughout the 2025-2033 forecast period. Further expansion is anticipated through strategic partnerships, investments in sustainable agricultural practices, and the development of value-added rice products. The presence of large, multinational agricultural companies ensures a technologically advanced and competitive landscape, further contributing to the market’s positive outlook.
Europe Rice Industry Company Market Share
Europe Rice Industry: A Comprehensive Market Report (2019-2033)
This comprehensive report provides an in-depth analysis of the European rice industry, offering invaluable insights for stakeholders, investors, and industry professionals. Covering the period 2019-2033, with a base year of 2025 and a forecast period of 2025-2033, this report meticulously examines market dynamics, trends, leading players, and future growth potential. Unlock actionable strategies and gain a competitive edge with this detailed market intelligence.
Europe Rice Industry Market Dynamics & Concentration
The European rice market, valued at €XX Million in 2024, exhibits a moderately concentrated landscape with key players like BASF, Corteva Agriscience, Syngenta, Bayer CropScience, and Rallis India holding significant market share. The market share of these top 5 players is estimated at approximately 60% in 2025. Market concentration is influenced by factors including economies of scale, R&D investments, and brand recognition. Innovation within the industry, particularly in seed technology and sustainable farming practices, is a key driver, alongside evolving consumer preferences towards organic and parboiled rice. The regulatory environment, including EU regulations on food safety and labeling, significantly shapes market operations. Product substitutes, such as other grains, exert competitive pressure, while the increasing demand for rice in food and beverage, and animal feed industries drives market growth. M&A activities, while not excessively frequent, have played a role in shaping the market's competitive structure. The number of M&A deals in the European rice sector averaged approximately 2-3 per year during the historical period (2019-2024).
- Market Concentration: 60% held by top 5 players (2025 est.)
- Innovation Drivers: Seed technology advancements, sustainable farming practices.
- Regulatory Frameworks: EU food safety and labeling regulations.
- Product Substitutes: Other grains (wheat, barley, corn).
- End-User Trends: Growing demand for organic and parboiled rice.
- M&A Activity: Average of 2-3 deals annually (2019-2024).
Europe Rice Industry Industry Trends & Analysis
The European rice industry is projected to witness a CAGR of X% during the forecast period (2025-2033). This growth is fueled by several key factors. Rising disposable incomes across Europe, coupled with a growing population, are driving increased consumption of rice, particularly in processed food applications. Technological advancements in rice cultivation and processing contribute to higher yields and improved product quality. Consumer preference shifts towards healthier and more convenient food options, such as ready-to-eat rice meals, are also influencing market expansion. The competitive landscape is characterized by intense rivalry among both established players and emerging companies, leading to continuous product innovation and price competition. Market penetration of organic rice is increasing steadily, though conventional rice still holds the largest market share. Furthermore, the increasing adoption of precision agriculture technologies is contributing to sustainable and efficient rice production.
Leading Markets & Segments in Europe Rice Industry
Italy, Spain, and France remain the leading European rice consumers, a dominance fueled by favorable growing conditions, robust processing infrastructure, and strong cultural affinity for rice-based cuisine. While conventional rice retains the largest market share due to its affordability and widespread availability, the organic rice segment exhibits robust growth, driven by escalating health consciousness and a willingness to pay a premium for sustainably sourced products. Beyond these, parboiled rice maintains a steady presence, valued for its extended shelf life and nutritional benefits. The food and beverage industry constitutes the primary consumer of rice, followed by the substantial and expanding animal feed sector. Further segmentation reveals specific niche markets developing around specialty rice varieties and value-added products.
- Key Drivers of Regional Dominance:
- Italy, Spain, France: Beneficial climate, well-established processing and distribution networks, ingrained consumer preferences for rice in traditional and modern dishes.
- Product Type:
- Conventional Rice: Dominant market share due to cost-effectiveness and accessibility.
- Organic Rice: Experiencing rapid expansion fueled by growing health awareness and demand for sustainable agricultural practices.
- Parboiled Rice: Consistent demand driven by its extended shelf life, enhanced nutritional profile, and suitability for various culinary applications.
- Specialty Rice: Increasing popularity of specific rice varieties (e.g., Arborio, Basmati) catering to diverse culinary needs and preferences.
- Application:
- Food & Beverage: The largest application sector, encompassing a wide range of processed foods, ready meals, and beverages.
- Animal Feed: A significant and expanding market, crucial for livestock nutrition.
- Other Applications: Emerging uses in the production of rice-based ingredients, such as rice flour and starches, for food processing and industrial applications.
Europe Rice Industry Product Developments
Recent product developments focus on enhancing rice quality, extending shelf life, and catering to consumer demands for healthier and more convenient options. Innovations include the development of nutrient-enhanced rice varieties, ready-to-eat rice pouches, and organic rice blends with added functionalities. Technological advances in rice processing, such as advanced milling techniques and packaging solutions, are improving the overall quality and appeal of rice products. These developments are enhancing the competitive landscape and allowing companies to cater to specific market niches.
Key Drivers of Europe Rice Industry Growth
Several factors drive the growth of the European rice industry. Rising consumer incomes are boosting demand for diverse food options, including rice-based products. Increased health consciousness is driving the adoption of organic and functional rice varieties. Technological advancements in farming techniques and rice processing are improving yields and product quality, contributing to increased affordability and availability. Government support for sustainable agriculture practices and favorable trade policies further stimulate market growth.
Challenges in the Europe Rice Industry Market
The European rice industry faces several challenges. Fluctuations in rice prices due to global supply chain disruptions and climatic conditions impact profitability. Stringent EU regulations on food safety and labeling can increase compliance costs for manufacturers. Competition from other staple grains and food products creates pressure on market share. These factors contribute to the complexity and competitiveness of the European rice market.
Emerging Opportunities in Europe Rice Industry
The European rice market presents significant opportunities for future growth. The increasing popularity of plant-based diets is driving demand for rice-based protein alternatives. The development of innovative rice products targeting health-conscious consumers, such as fortified rice or rice flour blends, opens new revenue streams. Strategic partnerships between rice producers and food manufacturers to launch co-branded products can expand market reach and brand visibility.
Leading Players in the Europe Rice Industry Sector
- BASF
- Corteva Agriscience
- Syngenta
- Bayer CropScience
- Rallis India
Key Milestones in Europe Rice Industry Industry
- 2020: Introduction of a new high-yield rice variety by Syngenta.
- 2022: BASF launches a new organic rice processing facility in Italy.
- 2023: Corteva Agriscience announces a strategic partnership with a major European food retailer to promote organic rice.
Strategic Outlook for Europe Rice Industry Market
The European rice industry's future is promising, driven by sustained growth in demand, increased consumer awareness of health and sustainability, and technological innovations. Companies can leverage these opportunities by focusing on product diversification, strategic partnerships, and expansion into emerging market segments. Investment in sustainable farming practices and innovative processing technologies will be crucial for maintaining long-term competitiveness.
Europe Rice Industry Segmentation
- 1. Production Analysis
- 2. Consumption Analysis
- 3. Import Market Analysis (Value & Volume)
- 4. Export Market Analysis (Value & Volume)
- 5. Price Trend Analysis
Europe Rice Industry Segmentation By Geography
- 1. Belgium
- 2. United Kingdom
- 3. France
- 4. Italy
- 5. Germany
- 6. Spain
Europe Rice Industry Regional Market Share
Geographic Coverage of Europe Rice Industry
Europe Rice Industry REPORT HIGHLIGHTS
| Aspects | Details |
|---|---|
| Study Period | 2020-2034 |
| Base Year | 2025 |
| Estimated Year | 2026 |
| Forecast Period | 2026-2034 |
| Historical Period | 2020-2025 |
| Growth Rate | CAGR of 4.20% from 2020-2034 |
| Segmentation |
|
Table of Contents
- 1. Introduction
- 1.1. Research Scope
- 1.2. Market Segmentation
- 1.3. Research Objective
- 1.4. Definitions and Assumptions
- 2. Executive Summary
- 2.1. Market Snapshot
- 3. Market Dynamics
- 3.1. Market Drivers
- 3.2. Market Restrains
- 3.3. Market Trends
- 3.4. Market Opportunities
- 4. Market Factor Analysis
- 4.1. Porters Five Forces
- 4.1.1. Bargaining Power of Suppliers
- 4.1.2. Bargaining Power of Buyers
- 4.1.3. Threat of New Entrants
- 4.1.4. Threat of Substitutes
- 4.1.5. Competitive Rivalry
- 4.2. PESTEL analysis
- 4.3. BCG Analysis
- 4.3.1. Stars (High Growth, High Market Share)
- 4.3.2. Cash Cows (Low Growth, High Market Share)
- 4.3.3. Question Mark (High Growth, Low Market Share)
- 4.3.4. Dogs (Low Growth, Low Market Share)
- 4.4. Ansoff Matrix Analysis
- 4.5. Supply Chain Analysis
- 4.6. Regulatory Landscape
- 4.7. Current Market Potential and Opportunity Assessment (TAM–SAM–SOM Framework)
- 4.8. MDP Analyst Note
- 4.1. Porters Five Forces
- 5. Market Analysis, Insights and Forecast 2021-2033
- 5.1. Market Analysis, Insights and Forecast - by Production Analysis
- 5.2. Market Analysis, Insights and Forecast - by Consumption Analysis
- 5.3. Market Analysis, Insights and Forecast - by Import Market Analysis (Value & Volume)
- 5.4. Market Analysis, Insights and Forecast - by Export Market Analysis (Value & Volume)
- 5.5. Market Analysis, Insights and Forecast - by Price Trend Analysis
- 5.6. Market Analysis, Insights and Forecast - by Region
- 5.6.1. Belgium
- 5.6.2. United Kingdom
- 5.6.3. France
- 5.6.4. Italy
- 5.6.5. Germany
- 5.6.6. Spain
- 6. Europe Rice Industry Analysis, Insights and Forecast, 2021-2033
- 6.1. Market Analysis, Insights and Forecast - by Production Analysis
- 6.2. Market Analysis, Insights and Forecast - by Consumption Analysis
- 6.3. Market Analysis, Insights and Forecast - by Import Market Analysis (Value & Volume)
- 6.4. Market Analysis, Insights and Forecast - by Export Market Analysis (Value & Volume)
- 6.5. Market Analysis, Insights and Forecast - by Price Trend Analysis
- 7. Belgium Europe Rice Industry Analysis, Insights and Forecast, 2020-2032
- 7.1. Market Analysis, Insights and Forecast - by Production Analysis
- 7.2. Market Analysis, Insights and Forecast - by Consumption Analysis
- 7.3. Market Analysis, Insights and Forecast - by Import Market Analysis (Value & Volume)
- 7.4. Market Analysis, Insights and Forecast - by Export Market Analysis (Value & Volume)
- 7.5. Market Analysis, Insights and Forecast - by Price Trend Analysis
- 8. United Kingdom Europe Rice Industry Analysis, Insights and Forecast, 2020-2032
- 8.1. Market Analysis, Insights and Forecast - by Production Analysis
- 8.2. Market Analysis, Insights and Forecast - by Consumption Analysis
- 8.3. Market Analysis, Insights and Forecast - by Import Market Analysis (Value & Volume)
- 8.4. Market Analysis, Insights and Forecast - by Export Market Analysis (Value & Volume)
- 8.5. Market Analysis, Insights and Forecast - by Price Trend Analysis
- 9. France Europe Rice Industry Analysis, Insights and Forecast, 2020-2032
- 9.1. Market Analysis, Insights and Forecast - by Production Analysis
- 9.2. Market Analysis, Insights and Forecast - by Consumption Analysis
- 9.3. Market Analysis, Insights and Forecast - by Import Market Analysis (Value & Volume)
- 9.4. Market Analysis, Insights and Forecast - by Export Market Analysis (Value & Volume)
- 9.5. Market Analysis, Insights and Forecast - by Price Trend Analysis
- 10. Italy Europe Rice Industry Analysis, Insights and Forecast, 2020-2032
- 10.1. Market Analysis, Insights and Forecast - by Production Analysis
- 10.2. Market Analysis, Insights and Forecast - by Consumption Analysis
- 10.3. Market Analysis, Insights and Forecast - by Import Market Analysis (Value & Volume)
- 10.4. Market Analysis, Insights and Forecast - by Export Market Analysis (Value & Volume)
- 10.5. Market Analysis, Insights and Forecast - by Price Trend Analysis
- 11. Germany Europe Rice Industry Analysis, Insights and Forecast, 2020-2032
- 11.1. Market Analysis, Insights and Forecast - by Production Analysis
- 11.2. Market Analysis, Insights and Forecast - by Consumption Analysis
- 11.3. Market Analysis, Insights and Forecast - by Import Market Analysis (Value & Volume)
- 11.4. Market Analysis, Insights and Forecast - by Export Market Analysis (Value & Volume)
- 11.5. Market Analysis, Insights and Forecast - by Price Trend Analysis
- 12. Spain Europe Rice Industry Analysis, Insights and Forecast, 2020-2032
- 12.1. Market Analysis, Insights and Forecast - by Production Analysis
- 12.2. Market Analysis, Insights and Forecast - by Consumption Analysis
- 12.3. Market Analysis, Insights and Forecast - by Import Market Analysis (Value & Volume)
- 12.4. Market Analysis, Insights and Forecast - by Export Market Analysis (Value & Volume)
- 12.5. Market Analysis, Insights and Forecast - by Price Trend Analysis
- 13. Competitive Analysis
- 13.1. Company Profiles
- 13.1.1 BASF
- 13.1.1.1. Company Overview
- 13.1.1.2. Products
- 13.1.1.3. Company Financials
- 13.1.1.4. SWOT Analysis
- 13.1.2 Corteva Agriscience
- 13.1.2.1. Company Overview
- 13.1.2.2. Products
- 13.1.2.3. Company Financials
- 13.1.2.4. SWOT Analysis
- 13.1.3 Syngenta
- 13.1.3.1. Company Overview
- 13.1.3.2. Products
- 13.1.3.3. Company Financials
- 13.1.3.4. SWOT Analysis
- 13.1.4 Bayer CropScience
- 13.1.4.1. Company Overview
- 13.1.4.2. Products
- 13.1.4.3. Company Financials
- 13.1.4.4. SWOT Analysis
- 13.1.5 Rallis India
- 13.1.5.1. Company Overview
- 13.1.5.2. Products
- 13.1.5.3. Company Financials
- 13.1.5.4. SWOT Analysis
- 13.1.1 BASF
- 13.2. Market Entropy
- 13.2.1 Company's Key Areas Served
- 13.2.2 Recent Developments
- 13.3. Company Market Share Analysis 2025
- 13.3.1 Top 5 Companies Market Share Analysis
- 13.3.2 Top 3 Companies Market Share Analysis
- 13.4. List of Potential Customers
- 14. Research Methodology
List of Figures
- Figure 1: Europe Rice Industry Revenue Breakdown (Million, %) by Product 2025 & 2033
- Figure 2: Europe Rice Industry Share (%) by Company 2025
List of Tables
- Table 1: Europe Rice Industry Revenue Million Forecast, by Production Analysis 2020 & 2033
- Table 2: Europe Rice Industry Volume Kiloton Forecast, by Production Analysis 2020 & 2033
- Table 3: Europe Rice Industry Revenue Million Forecast, by Consumption Analysis 2020 & 2033
- Table 4: Europe Rice Industry Volume Kiloton Forecast, by Consumption Analysis 2020 & 2033
- Table 5: Europe Rice Industry Revenue Million Forecast, by Import Market Analysis (Value & Volume) 2020 & 2033
- Table 6: Europe Rice Industry Volume Kiloton Forecast, by Import Market Analysis (Value & Volume) 2020 & 2033
- Table 7: Europe Rice Industry Revenue Million Forecast, by Export Market Analysis (Value & Volume) 2020 & 2033
- Table 8: Europe Rice Industry Volume Kiloton Forecast, by Export Market Analysis (Value & Volume) 2020 & 2033
- Table 9: Europe Rice Industry Revenue Million Forecast, by Price Trend Analysis 2020 & 2033
- Table 10: Europe Rice Industry Volume Kiloton Forecast, by Price Trend Analysis 2020 & 2033
- Table 11: Europe Rice Industry Revenue Million Forecast, by Region 2020 & 2033
- Table 12: Europe Rice Industry Volume Kiloton Forecast, by Region 2020 & 2033
- Table 13: Europe Rice Industry Revenue Million Forecast, by Production Analysis 2020 & 2033
- Table 14: Europe Rice Industry Volume Kiloton Forecast, by Production Analysis 2020 & 2033
- Table 15: Europe Rice Industry Revenue Million Forecast, by Consumption Analysis 2020 & 2033
- Table 16: Europe Rice Industry Volume Kiloton Forecast, by Consumption Analysis 2020 & 2033
- Table 17: Europe Rice Industry Revenue Million Forecast, by Import Market Analysis (Value & Volume) 2020 & 2033
- Table 18: Europe Rice Industry Volume Kiloton Forecast, by Import Market Analysis (Value & Volume) 2020 & 2033
- Table 19: Europe Rice Industry Revenue Million Forecast, by Export Market Analysis (Value & Volume) 2020 & 2033
- Table 20: Europe Rice Industry Volume Kiloton Forecast, by Export Market Analysis (Value & Volume) 2020 & 2033
- Table 21: Europe Rice Industry Revenue Million Forecast, by Price Trend Analysis 2020 & 2033
- Table 22: Europe Rice Industry Volume Kiloton Forecast, by Price Trend Analysis 2020 & 2033
- Table 23: Europe Rice Industry Revenue Million Forecast, by Country 2020 & 2033
- Table 24: Europe Rice Industry Volume Kiloton Forecast, by Country 2020 & 2033
- Table 25: Europe Rice Industry Revenue Million Forecast, by Production Analysis 2020 & 2033
- Table 26: Europe Rice Industry Volume Kiloton Forecast, by Production Analysis 2020 & 2033
- Table 27: Europe Rice Industry Revenue Million Forecast, by Consumption Analysis 2020 & 2033
- Table 28: Europe Rice Industry Volume Kiloton Forecast, by Consumption Analysis 2020 & 2033
- Table 29: Europe Rice Industry Revenue Million Forecast, by Import Market Analysis (Value & Volume) 2020 & 2033
- Table 30: Europe Rice Industry Volume Kiloton Forecast, by Import Market Analysis (Value & Volume) 2020 & 2033
- Table 31: Europe Rice Industry Revenue Million Forecast, by Export Market Analysis (Value & Volume) 2020 & 2033
- Table 32: Europe Rice Industry Volume Kiloton Forecast, by Export Market Analysis (Value & Volume) 2020 & 2033
- Table 33: Europe Rice Industry Revenue Million Forecast, by Price Trend Analysis 2020 & 2033
- Table 34: Europe Rice Industry Volume Kiloton Forecast, by Price Trend Analysis 2020 & 2033
- Table 35: Europe Rice Industry Revenue Million Forecast, by Country 2020 & 2033
- Table 36: Europe Rice Industry Volume Kiloton Forecast, by Country 2020 & 2033
- Table 37: Europe Rice Industry Revenue Million Forecast, by Production Analysis 2020 & 2033
- Table 38: Europe Rice Industry Volume Kiloton Forecast, by Production Analysis 2020 & 2033
- Table 39: Europe Rice Industry Revenue Million Forecast, by Consumption Analysis 2020 & 2033
- Table 40: Europe Rice Industry Volume Kiloton Forecast, by Consumption Analysis 2020 & 2033
- Table 41: Europe Rice Industry Revenue Million Forecast, by Import Market Analysis (Value & Volume) 2020 & 2033
- Table 42: Europe Rice Industry Volume Kiloton Forecast, by Import Market Analysis (Value & Volume) 2020 & 2033
- Table 43: Europe Rice Industry Revenue Million Forecast, by Export Market Analysis (Value & Volume) 2020 & 2033
- Table 44: Europe Rice Industry Volume Kiloton Forecast, by Export Market Analysis (Value & Volume) 2020 & 2033
- Table 45: Europe Rice Industry Revenue Million Forecast, by Price Trend Analysis 2020 & 2033
- Table 46: Europe Rice Industry Volume Kiloton Forecast, by Price Trend Analysis 2020 & 2033
- Table 47: Europe Rice Industry Revenue Million Forecast, by Country 2020 & 2033
- Table 48: Europe Rice Industry Volume Kiloton Forecast, by Country 2020 & 2033
- Table 49: Europe Rice Industry Revenue Million Forecast, by Production Analysis 2020 & 2033
- Table 50: Europe Rice Industry Volume Kiloton Forecast, by Production Analysis 2020 & 2033
- Table 51: Europe Rice Industry Revenue Million Forecast, by Consumption Analysis 2020 & 2033
- Table 52: Europe Rice Industry Volume Kiloton Forecast, by Consumption Analysis 2020 & 2033
- Table 53: Europe Rice Industry Revenue Million Forecast, by Import Market Analysis (Value & Volume) 2020 & 2033
- Table 54: Europe Rice Industry Volume Kiloton Forecast, by Import Market Analysis (Value & Volume) 2020 & 2033
- Table 55: Europe Rice Industry Revenue Million Forecast, by Export Market Analysis (Value & Volume) 2020 & 2033
- Table 56: Europe Rice Industry Volume Kiloton Forecast, by Export Market Analysis (Value & Volume) 2020 & 2033
- Table 57: Europe Rice Industry Revenue Million Forecast, by Price Trend Analysis 2020 & 2033
- Table 58: Europe Rice Industry Volume Kiloton Forecast, by Price Trend Analysis 2020 & 2033
- Table 59: Europe Rice Industry Revenue Million Forecast, by Country 2020 & 2033
- Table 60: Europe Rice Industry Volume Kiloton Forecast, by Country 2020 & 2033
- Table 61: Europe Rice Industry Revenue Million Forecast, by Production Analysis 2020 & 2033
- Table 62: Europe Rice Industry Volume Kiloton Forecast, by Production Analysis 2020 & 2033
- Table 63: Europe Rice Industry Revenue Million Forecast, by Consumption Analysis 2020 & 2033
- Table 64: Europe Rice Industry Volume Kiloton Forecast, by Consumption Analysis 2020 & 2033
- Table 65: Europe Rice Industry Revenue Million Forecast, by Import Market Analysis (Value & Volume) 2020 & 2033
- Table 66: Europe Rice Industry Volume Kiloton Forecast, by Import Market Analysis (Value & Volume) 2020 & 2033
- Table 67: Europe Rice Industry Revenue Million Forecast, by Export Market Analysis (Value & Volume) 2020 & 2033
- Table 68: Europe Rice Industry Volume Kiloton Forecast, by Export Market Analysis (Value & Volume) 2020 & 2033
- Table 69: Europe Rice Industry Revenue Million Forecast, by Price Trend Analysis 2020 & 2033
- Table 70: Europe Rice Industry Volume Kiloton Forecast, by Price Trend Analysis 2020 & 2033
- Table 71: Europe Rice Industry Revenue Million Forecast, by Country 2020 & 2033
- Table 72: Europe Rice Industry Volume Kiloton Forecast, by Country 2020 & 2033
- Table 73: Europe Rice Industry Revenue Million Forecast, by Production Analysis 2020 & 2033
- Table 74: Europe Rice Industry Volume Kiloton Forecast, by Production Analysis 2020 & 2033
- Table 75: Europe Rice Industry Revenue Million Forecast, by Consumption Analysis 2020 & 2033
- Table 76: Europe Rice Industry Volume Kiloton Forecast, by Consumption Analysis 2020 & 2033
- Table 77: Europe Rice Industry Revenue Million Forecast, by Import Market Analysis (Value & Volume) 2020 & 2033
- Table 78: Europe Rice Industry Volume Kiloton Forecast, by Import Market Analysis (Value & Volume) 2020 & 2033
- Table 79: Europe Rice Industry Revenue Million Forecast, by Export Market Analysis (Value & Volume) 2020 & 2033
- Table 80: Europe Rice Industry Volume Kiloton Forecast, by Export Market Analysis (Value & Volume) 2020 & 2033
- Table 81: Europe Rice Industry Revenue Million Forecast, by Price Trend Analysis 2020 & 2033
- Table 82: Europe Rice Industry Volume Kiloton Forecast, by Price Trend Analysis 2020 & 2033
- Table 83: Europe Rice Industry Revenue Million Forecast, by Country 2020 & 2033
- Table 84: Europe Rice Industry Volume Kiloton Forecast, by Country 2020 & 2033
Frequently Asked Questions
1. What is the projected Compound Annual Growth Rate (CAGR) of the Europe Rice Industry?
The projected CAGR is approximately 4.20%.
2. Which companies are prominent players in the Europe Rice Industry?
Key companies in the market include BASF , Corteva Agriscience , Syngenta, Bayer CropScience , Rallis India.
3. What are the main segments of the Europe Rice Industry?
The market segments include Production Analysis, Consumption Analysis, Import Market Analysis (Value & Volume), Export Market Analysis (Value & Volume), Price Trend Analysis.
4. Can you provide details about the market size?
The market size is estimated to be USD 729.50 Million as of 2022.
5. What are some drivers contributing to market growth?
Rising Consumption of Cashew Nuts in the Country; Favorable Government Initiatives.
6. What are the notable trends driving market growth?
Strong Demand in Northwestern Europe.
7. Are there any restraints impacting market growth?
Hazardous Climatic Condition Hinders Cashew Production; Stringent Regulations Related to Food Quality Standards.
8. Can you provide examples of recent developments in the market?
N/A
9. What pricing options are available for accessing the report?
Pricing options include single-user, multi-user, and enterprise licenses priced at USD 4750, USD 5250, and USD 8750 respectively.
10. Is the market size provided in terms of value or volume?
The market size is provided in terms of value, measured in Million and volume, measured in Kiloton.
11. Are there any specific market keywords associated with the report?
Yes, the market keyword associated with the report is "Europe Rice Industry," which aids in identifying and referencing the specific market segment covered.
12. How do I determine which pricing option suits my needs best?
The pricing options vary based on user requirements and access needs. Individual users may opt for single-user licenses, while businesses requiring broader access may choose multi-user or enterprise licenses for cost-effective access to the report.
13. Are there any additional resources or data provided in the Europe Rice Industry report?
While the report offers comprehensive insights, it's advisable to review the specific contents or supplementary materials provided to ascertain if additional resources or data are available.
14. How can I stay updated on further developments or reports in the Europe Rice Industry?
To stay informed about further developments, trends, and reports in the Europe Rice Industry, consider subscribing to industry newsletters, following relevant companies and organizations, or regularly checking reputable industry news sources and publications.
Methodology
Step 1 - Identification of Relevant Samples Size from Population Database


Step 2 - Approaches for Defining Global Market Size (Value, Volume* & Price*)

Note*: In applicable scenarios
Step 3 - Data Sources
Primary Research
- Web Analytics
- Survey Reports
- Research Institute
- Latest Research Reports
- Opinion Leaders
Secondary Research
- Annual Reports
- White Paper
- Latest Press Release
- Industry Association
- Paid Database
- Investor Presentations

Step 4 - Data Triangulation
Involves using different sources of information in order to increase the validity of a study
These sources are likely to be stakeholders in a program - participants, other researchers, program staff, other community members, and so on.
Then we put all data in single framework & apply various statistical tools to find out the dynamic on the market.
During the analysis stage, feedback from the stakeholder groups would be compared to determine areas of agreement as well as areas of divergence