

Key Insights
The E-Learning Gamification market is poised for remarkable expansion, projected to reach an estimated $93.4 million by 2025. This robust growth is fueled by a compelling compound annual growth rate (CAGR) of 26.06% over the forecast period of 2025-2033. The integration of game mechanics into educational platforms is revolutionizing learning experiences, making them more engaging, interactive, and effective. Key drivers include the increasing adoption of digital learning solutions across educational institutions and corporate training programs, a growing recognition of gamification's efficacy in improving knowledge retention and skill development, and the rising demand for personalized and adaptive learning pathways. The market is further propelled by advancements in educational technology and the widespread availability of cloud-based platforms, which facilitate seamless implementation and scalability of gamified learning modules.
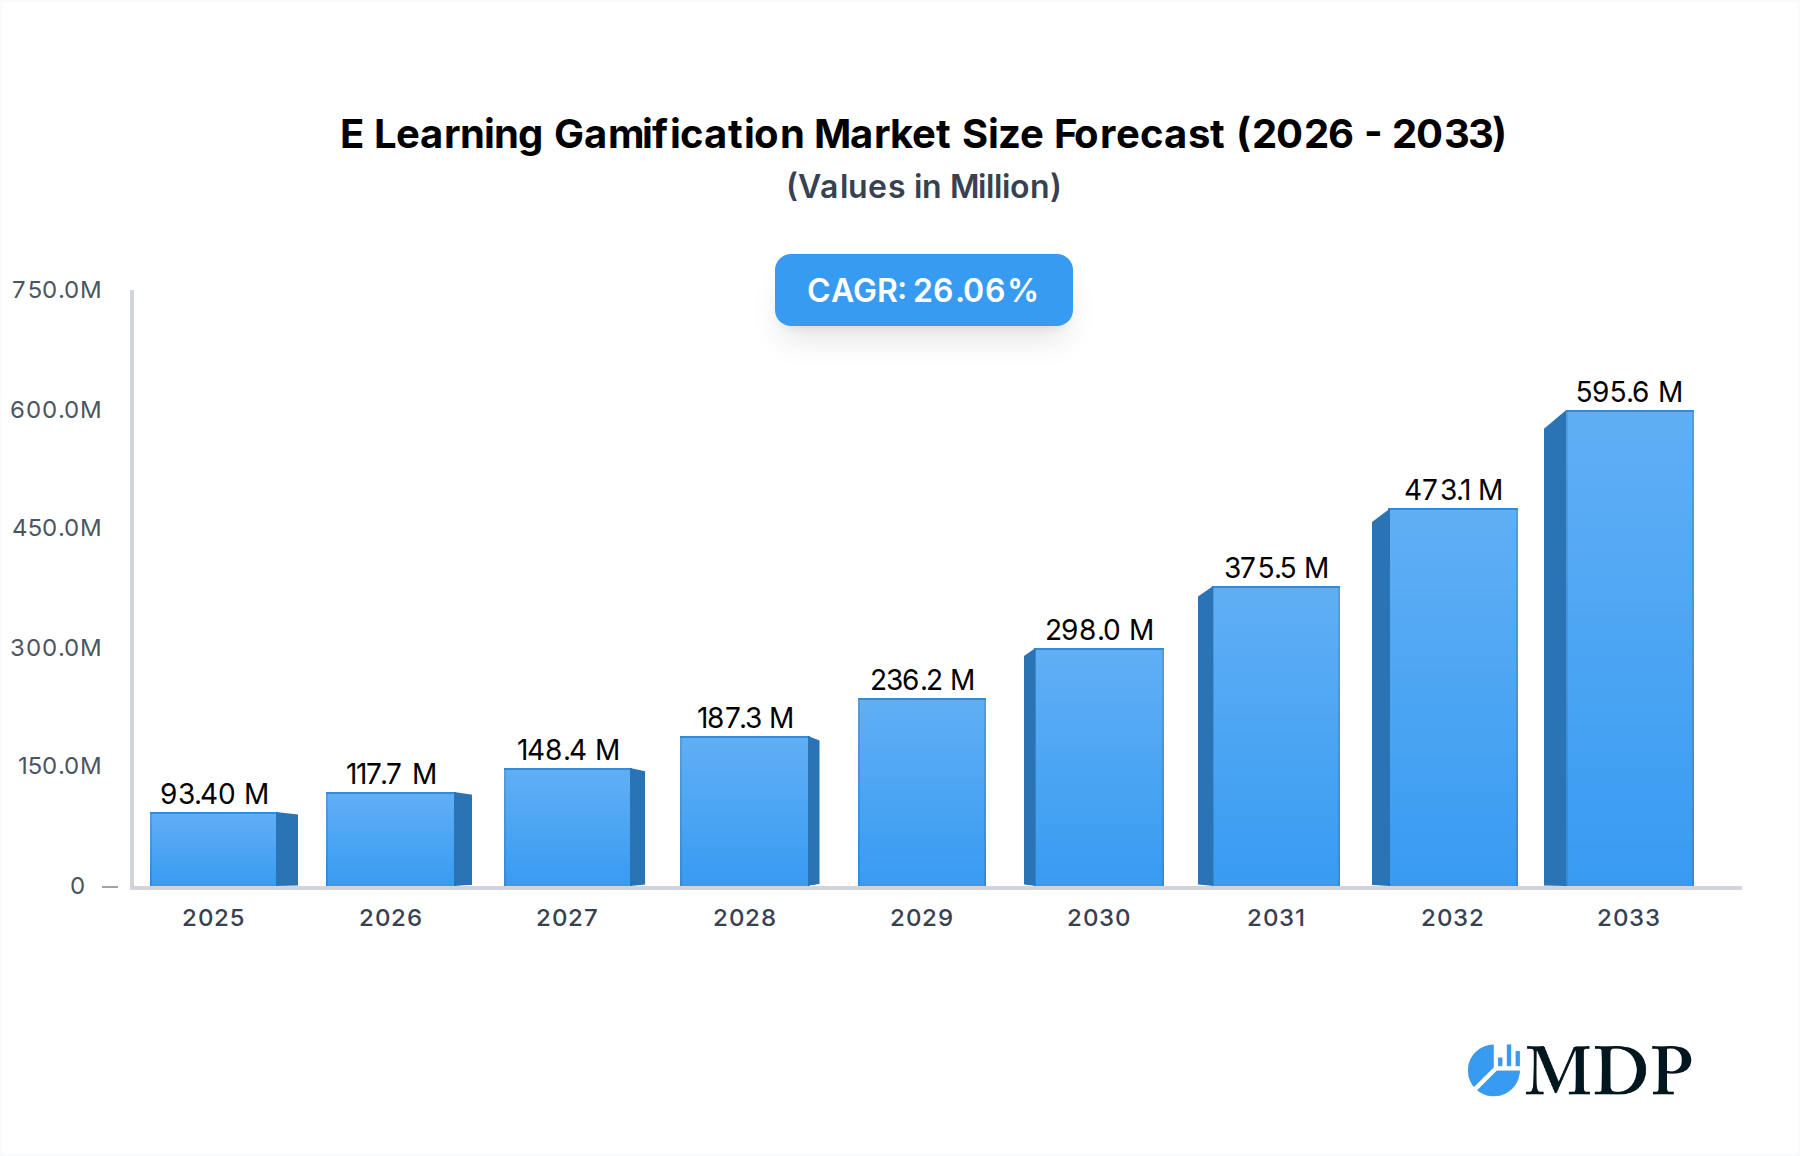
E Learning Gamification Market Size (In Million)
The E-Learning Gamification landscape is characterized by a dynamic interplay of innovation and evolving user expectations. The market segments include K-12 education and higher education, with a growing emphasis on cloud-based solutions due to their flexibility, accessibility, and cost-effectiveness. While on-premise solutions continue to cater to specific organizational needs, the shift towards cloud deployment is a dominant trend. Emerging trends like the incorporation of augmented reality (AR) and virtual reality (VR) in gamified learning, along with the development of sophisticated analytics to track learner progress and provide tailored feedback, are shaping the future of this market. The competitive environment features a diverse range of players, from established technology giants to specialized EdTech startups, all vying to capture market share by offering innovative and feature-rich gamification solutions. This intense competition, coupled with the rapid pace of technological evolution, ensures continuous innovation and a dynamic market trajectory.

E Learning Gamification Company Market Share
This comprehensive report dives deep into the electrifying world of E Learning Gamification, a sector rapidly transforming educational and corporate training landscapes. Discover the market dynamics, innovation drivers, and future trajectory of this burgeoning industry, crucial for edtech providers, educational institutions, and HR professionals seeking to boost engagement and learning outcomes. Our analysis spans from 2019 to 2033, with a base year of 2025 and a detailed forecast period from 2025 to 2033, building upon historical data from 2019-2024. We leverage high-traffic keywords like "e-learning gamification," "gamified learning," "educational technology," "corporate training gamification," "K-12 gamification," and "higher education gamification" to ensure maximum search visibility.
E Learning Gamification Market Dynamics & Concentration
The E Learning Gamification market exhibits a dynamic and evolving concentration, with a significant presence of both established technology giants and specialized edtech innovators. Innovation drivers are primarily fueled by the escalating demand for more engaging and effective learning experiences, the proliferation of digital learning platforms, and advancements in AI and adaptive learning technologies. Regulatory frameworks, while still developing, are increasingly supportive of digital education initiatives. Product substitutes, such as traditional e-learning modules and in-person training, are gradually being displaced by the superior engagement offered by gamified solutions. End-user trends highlight a strong preference for personalized, interactive, and results-oriented learning, with a particular emphasis on measurable progress and skill development. Mergers and acquisitions (M&A) activities are on the rise as larger players seek to acquire innovative startups and expand their gamification portfolios. We anticipate over 50 strategic M&A deals within the forecast period, with market share consolidation becoming a key theme, particularly in the cloud-based segment.
E Learning Gamification Industry Trends & Analysis
The E Learning Gamification industry is experiencing robust growth, projected to witness a Compound Annual Growth Rate (CAGR) of approximately 15% over the forecast period. This expansion is driven by a confluence of factors. The insatiable demand for more effective and engaging learning solutions in both academic and professional settings is a primary catalyst. Businesses are increasingly recognizing gamification as a powerful tool to enhance employee training, onboarding, and skill development, leading to higher retention rates and improved productivity. In education, gamified learning platforms are revolutionizing how students interact with content, fostering greater motivation, participation, and knowledge retention, especially in K-12 and higher education segments.
Technological disruptions are playing a pivotal role, with the integration of AI, virtual reality (VR), and augmented reality (AR) creating immersive and interactive learning experiences. These technologies allow for personalized learning paths, real-time feedback, and adaptive challenges that cater to individual learning styles and paces. Mobile learning and the ubiquity of smart devices have further democratized access to gamified educational content, enabling learning anytime, anywhere.
Consumer preferences are shifting significantly towards interactive, game-like learning environments. Learners of all ages are accustomed to digital engagement and expect their educational experiences to be equally stimulating and rewarding. This has led to a greater adoption of gamified elements such as points, badges, leaderboards, challenges, and reward systems. The competitive dynamics within the market are intensifying, with a growing number of players vying for market share. Companies are differentiating themselves through innovative features, tailored solutions for specific industries and educational levels, and robust analytics to track learner progress and engagement. Market penetration for e-learning gamification is estimated to reach over 40% by 2033, indicating its widespread acceptance and integration into mainstream learning strategies.
Leading Markets & Segments in E Learning Gamification
The E Learning Gamification market is characterized by distinct regional dominance and segment penetration. North America currently holds the leading position, driven by significant investment in edtech infrastructure, a highly competitive corporate training landscape, and early adoption of innovative learning technologies. The United States, in particular, spearheads this growth, fueled by robust economic policies that support educational advancements and a strong emphasis on continuous professional development.
Within the application segments, K-12 education is emerging as a particularly strong growth area. Key drivers include the increasing recognition of the need for engaging learning methods to combat student disinterest, the integration of digital tools into classroom curricula, and government initiatives promoting technology adoption in schools. The desire to foster critical thinking, problem-solving, and collaboration skills through interactive gameplay is a major catalyst.
Higher education is also a significant market, with universities and colleges leveraging gamification to enhance student engagement in large lectures, improve retention rates, and support remote learning initiatives. The demand for personalized learning experiences and the need to prepare students for a digitally driven workforce are propelling the adoption of gamified solutions in this segment.
In terms of deployment type, Cloud-Based solutions are dominating the market. Key drivers for this preference include scalability, cost-effectiveness, ease of deployment and maintenance, and accessibility from any device with an internet connection. The ability to quickly update content and features without complex installations makes cloud-based platforms highly attractive to educational institutions and businesses alike. While On-Premise solutions still hold a niche, particularly for organizations with strict data security requirements, the trend is firmly towards cloud-based deployments due to their flexibility and rapid innovation cycles. The global market is projected to see a sustained growth of over 20% for cloud-based solutions throughout the forecast period.
E Learning Gamification Product Developments
Product development in E Learning Gamification is characterized by a relentless pursuit of immersive and personalized learning experiences. Innovations are centered around AI-powered adaptive learning engines that tailor challenges and rewards to individual learner progress, ensuring optimal engagement and knowledge acquisition. The integration of gamified elements with VR and AR technologies is creating highly interactive simulations for skill-based training, from complex surgical procedures to intricate engineering tasks. Companies are focusing on developing robust analytics dashboards that provide actionable insights into learner behavior, performance, and engagement levels, allowing for continuous improvement of learning content and strategies. The competitive advantage lies in creating intuitive, engaging, and demonstrably effective gamified solutions that align with diverse educational and corporate objectives, driving higher completion rates and improved learning outcomes.
Key Drivers of E Learning Gamification Growth
The growth of the E Learning Gamification market is propelled by several interconnected factors. Technologically, the widespread availability of high-speed internet, mobile devices, and advancements in AI and game design are making sophisticated gamified experiences accessible and affordable. Economically, organizations are increasingly recognizing the ROI of gamification through improved employee productivity, reduced training costs, and enhanced customer loyalty. Regulatory frameworks are becoming more conducive to digital learning initiatives, with governments investing in edtech infrastructure and promoting digital literacy. The inherent appeal of game mechanics—competition, rewards, and challenges—resonates with learners of all ages, driving demand for more engaging educational content.
Challenges in the E Learning Gamification Market
Despite its promising growth, the E Learning Gamification market faces several challenges. Regulatory hurdles, particularly concerning data privacy and accessibility in certain regions, can slow down adoption. Supply chain issues for hardware components related to VR/AR integration, though less prominent now, can still pose a minor concern for specific advanced deployments. Competitive pressures are intense, leading to a crowded market where differentiation is key. The cost of developing high-quality gamified content can be substantial, posing a barrier for smaller institutions or businesses. Furthermore, ensuring that gamification effectively enhances learning outcomes rather than merely providing superficial engagement requires careful design and continuous evaluation, a challenge that requires expertise and significant investment.
Emerging Opportunities in E Learning Gamification
The E Learning Gamification market is ripe with emerging opportunities. Technological breakthroughs in personalized learning through AI and machine learning algorithms offer immense potential for hyper-tailored educational experiences. Strategic partnerships between edtech providers, content creators, and industry leaders are creating innovative blended learning solutions that combine the best of gamification and traditional learning methods. Market expansion into underserved regions and the development of gamified solutions for niche industries like healthcare, finance, and skilled trades represent significant untapped potential. The growing acceptance of microlearning and just-in-time learning further fuels the demand for engaging, bite-sized gamified modules that can be accessed on demand.
Leading Players in the E Learning Gamification Sector
- Badgeville
- BI WORLDWIDE
- Classcraft Studios
- Microsoft
- SAP
- MPS Interactive Systems
- D2L Corporation
- Top Hat
- Cognizant
- Recurrence Inc.
- Fundamentor
- Gametize
- GradeCraft
- Kuato Studios
- Kungfu-Math
Key Milestones in E Learning Gamification Industry
- 2019: Increased adoption of gamified elements in corporate training programs focused on soft skills development.
- 2020: Surge in demand for gamified remote learning solutions due to the global pandemic, particularly for K-12 education.
- 2021: Emergence of advanced AI-powered adaptive gamification platforms offering personalized learning paths.
- 2022: Significant investments in VR/AR integration for immersive gamified training simulations.
- 2023: Growing focus on gamified solutions for employee onboarding and compliance training.
- 2024: Expansion of gamified learning analytics to provide deeper insights into learner engagement and performance.
Strategic Outlook for E Learning Gamification Market
The strategic outlook for the E Learning Gamification market is exceptionally bright, driven by its proven ability to enhance learning engagement and outcomes. Future growth accelerators include the continued integration of advanced AI for hyper-personalization, the expansion of gamified learning into emerging markets, and the development of more sophisticated analytics for measuring pedagogical effectiveness. Strategic opportunities lie in creating industry-specific gamified solutions, fostering robust partnerships to expand reach and innovation, and focusing on accessibility and affordability to democratize gamified learning. The market is poised for sustained innovation, with a clear trajectory towards more immersive, personalized, and impactful learning experiences.
E Learning Gamification Segmentation
-
1. Application
- 1.1. K-12 education
- 1.2. Higher education
-
2. Type
- 2.1. Cloud Based
- 2.2. On-Premise
E Learning Gamification Segmentation By Geography
-
1. North America
- 1.1. United States
- 1.2. Canada
- 1.3. Mexico
-
2. South America
- 2.1. Brazil
- 2.2. Argentina
- 2.3. Rest of South America
-
3. Europe
- 3.1. United Kingdom
- 3.2. Germany
- 3.3. France
- 3.4. Italy
- 3.5. Spain
- 3.6. Russia
- 3.7. Benelux
- 3.8. Nordics
- 3.9. Rest of Europe
-
4. Middle East & Africa
- 4.1. Turkey
- 4.2. Israel
- 4.3. GCC
- 4.4. North Africa
- 4.5. South Africa
- 4.6. Rest of Middle East & Africa
-
5. Asia Pacific
- 5.1. China
- 5.2. India
- 5.3. Japan
- 5.4. South Korea
- 5.5. ASEAN
- 5.6. Oceania
- 5.7. Rest of Asia Pacific
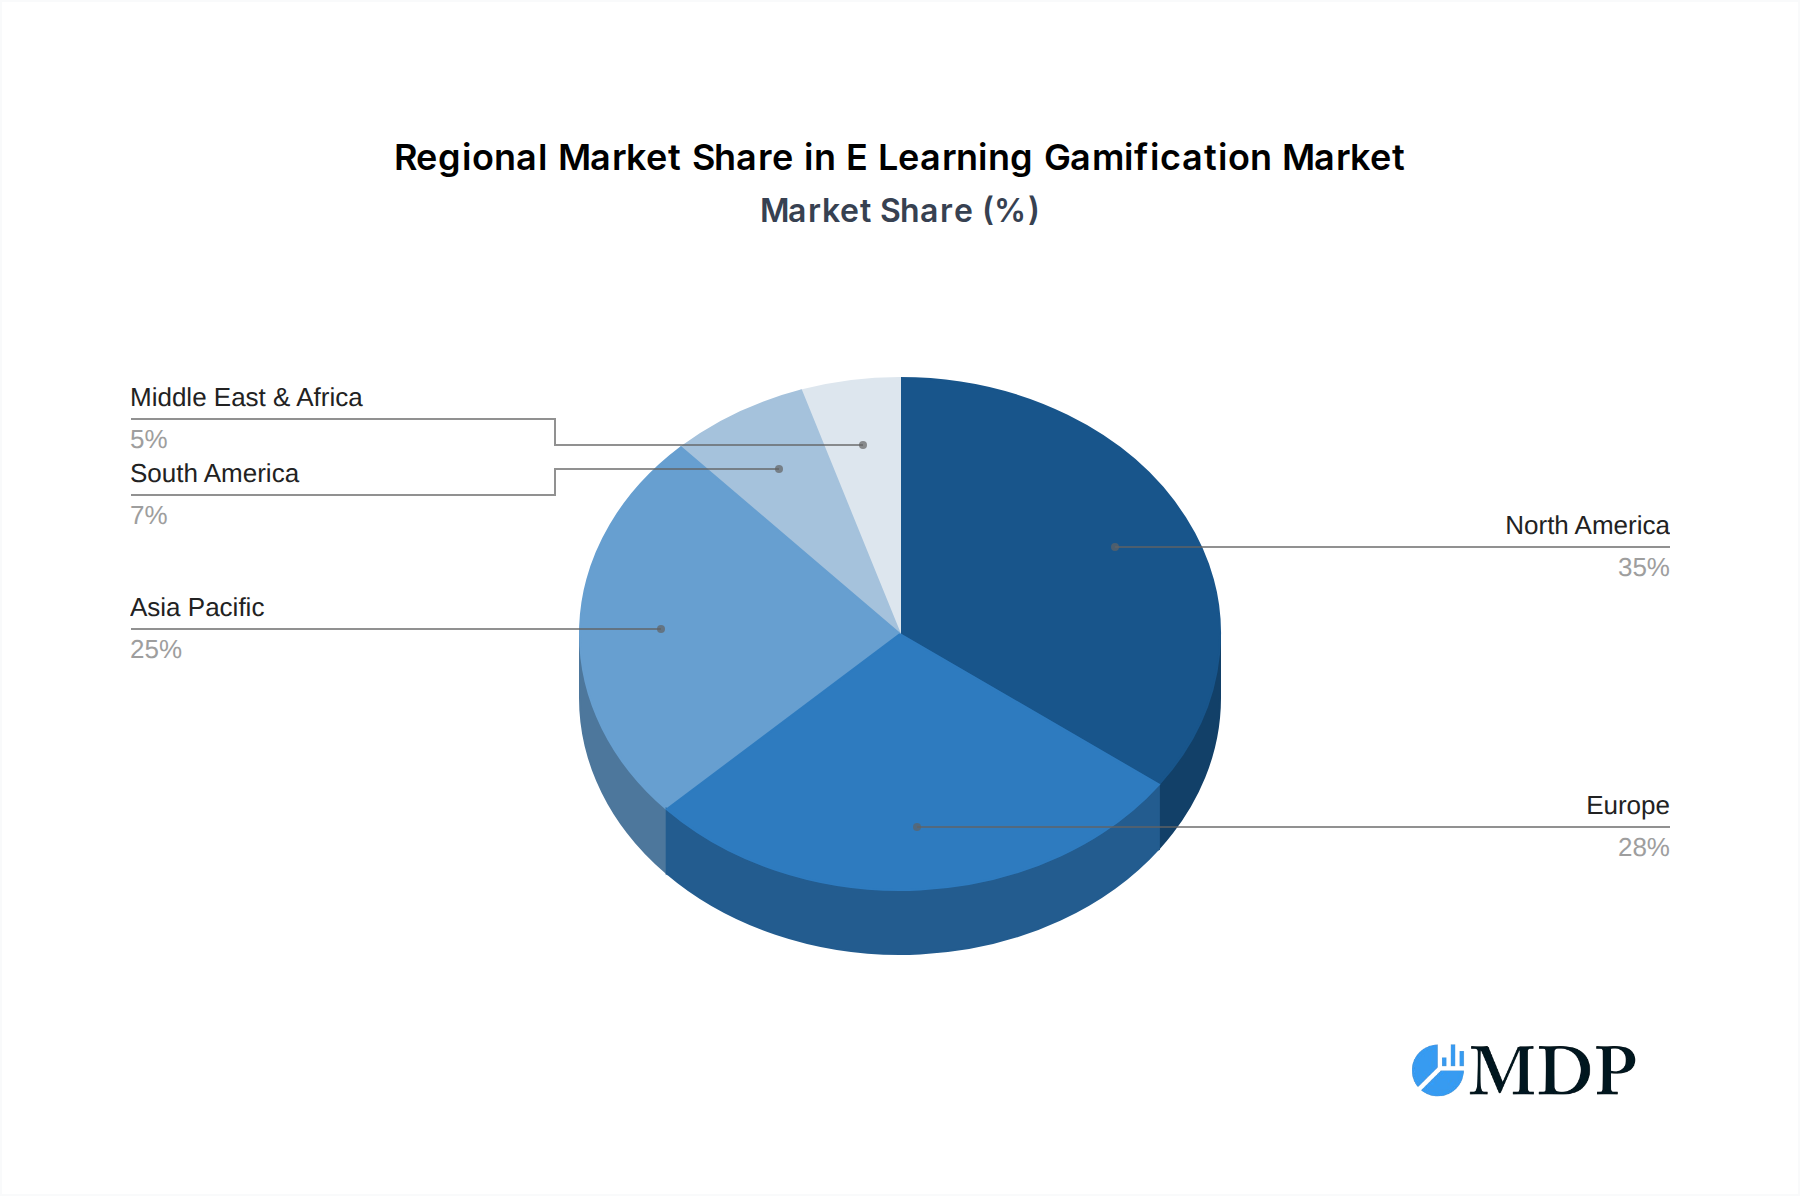
E Learning Gamification Regional Market Share
Geographic Coverage of E Learning Gamification
E Learning Gamification REPORT HIGHLIGHTS
| Aspects | Details |
|---|---|
| Study Period | 2020-2034 |
| Base Year | 2025 |
| Estimated Year | 2026 |
| Forecast Period | 2026-2034 |
| Historical Period | 2020-2025 |
| Growth Rate | CAGR of 26.06% from 2020-2034 |
| Segmentation |
|
Table of Contents
- 1. Introduction
- 1.1. Research Scope
- 1.2. Market Segmentation
- 1.3. Research Methodology
- 1.4. Definitions and Assumptions
- 2. Executive Summary
- 2.1. Introduction
- 3. Market Dynamics
- 3.1. Introduction
- 3.2. Market Drivers
- 3.3. Market Restrains
- 3.4. Market Trends
- 4. Market Factor Analysis
- 4.1. Porters Five Forces
- 4.2. Supply/Value Chain
- 4.3. PESTEL analysis
- 4.4. Market Entropy
- 4.5. Patent/Trademark Analysis
- 5. Global E Learning Gamification Analysis, Insights and Forecast, 2020-2032
- 5.1. Market Analysis, Insights and Forecast - by Application
- 5.1.1. K-12 education
- 5.1.2. Higher education
- 5.2. Market Analysis, Insights and Forecast - by Type
- 5.2.1. Cloud Based
- 5.2.2. On-Premise
- 5.3. Market Analysis, Insights and Forecast - by Region
- 5.3.1. North America
- 5.3.2. South America
- 5.3.3. Europe
- 5.3.4. Middle East & Africa
- 5.3.5. Asia Pacific
- 5.1. Market Analysis, Insights and Forecast - by Application
- 6. North America E Learning Gamification Analysis, Insights and Forecast, 2020-2032
- 6.1. Market Analysis, Insights and Forecast - by Application
- 6.1.1. K-12 education
- 6.1.2. Higher education
- 6.2. Market Analysis, Insights and Forecast - by Type
- 6.2.1. Cloud Based
- 6.2.2. On-Premise
- 6.1. Market Analysis, Insights and Forecast - by Application
- 7. South America E Learning Gamification Analysis, Insights and Forecast, 2020-2032
- 7.1. Market Analysis, Insights and Forecast - by Application
- 7.1.1. K-12 education
- 7.1.2. Higher education
- 7.2. Market Analysis, Insights and Forecast - by Type
- 7.2.1. Cloud Based
- 7.2.2. On-Premise
- 7.1. Market Analysis, Insights and Forecast - by Application
- 8. Europe E Learning Gamification Analysis, Insights and Forecast, 2020-2032
- 8.1. Market Analysis, Insights and Forecast - by Application
- 8.1.1. K-12 education
- 8.1.2. Higher education
- 8.2. Market Analysis, Insights and Forecast - by Type
- 8.2.1. Cloud Based
- 8.2.2. On-Premise
- 8.1. Market Analysis, Insights and Forecast - by Application
- 9. Middle East & Africa E Learning Gamification Analysis, Insights and Forecast, 2020-2032
- 9.1. Market Analysis, Insights and Forecast - by Application
- 9.1.1. K-12 education
- 9.1.2. Higher education
- 9.2. Market Analysis, Insights and Forecast - by Type
- 9.2.1. Cloud Based
- 9.2.2. On-Premise
- 9.1. Market Analysis, Insights and Forecast - by Application
- 10. Asia Pacific E Learning Gamification Analysis, Insights and Forecast, 2020-2032
- 10.1. Market Analysis, Insights and Forecast - by Application
- 10.1.1. K-12 education
- 10.1.2. Higher education
- 10.2. Market Analysis, Insights and Forecast - by Type
- 10.2.1. Cloud Based
- 10.2.2. On-Premise
- 10.1. Market Analysis, Insights and Forecast - by Application
- 11. Competitive Analysis
- 11.1. Global Market Share Analysis 2025
- 11.2. Company Profiles
- 11.2.1 Badgeville
- 11.2.1.1. Overview
- 11.2.1.2. Products
- 11.2.1.3. SWOT Analysis
- 11.2.1.4. Recent Developments
- 11.2.1.5. Financials (Based on Availability)
- 11.2.2 BI WORLDWIDE
- 11.2.2.1. Overview
- 11.2.2.2. Products
- 11.2.2.3. SWOT Analysis
- 11.2.2.4. Recent Developments
- 11.2.2.5. Financials (Based on Availability)
- 11.2.3 Classcraft Studios
- 11.2.3.1. Overview
- 11.2.3.2. Products
- 11.2.3.3. SWOT Analysis
- 11.2.3.4. Recent Developments
- 11.2.3.5. Financials (Based on Availability)
- 11.2.4 Microsoft
- 11.2.4.1. Overview
- 11.2.4.2. Products
- 11.2.4.3. SWOT Analysis
- 11.2.4.4. Recent Developments
- 11.2.4.5. Financials (Based on Availability)
- 11.2.5 SAP
- 11.2.5.1. Overview
- 11.2.5.2. Products
- 11.2.5.3. SWOT Analysis
- 11.2.5.4. Recent Developments
- 11.2.5.5. Financials (Based on Availability)
- 11.2.6 MPS Interactive Systems
- 11.2.6.1. Overview
- 11.2.6.2. Products
- 11.2.6.3. SWOT Analysis
- 11.2.6.4. Recent Developments
- 11.2.6.5. Financials (Based on Availability)
- 11.2.7 D2L Corporation
- 11.2.7.1. Overview
- 11.2.7.2. Products
- 11.2.7.3. SWOT Analysis
- 11.2.7.4. Recent Developments
- 11.2.7.5. Financials (Based on Availability)
- 11.2.8 Top Hat
- 11.2.8.1. Overview
- 11.2.8.2. Products
- 11.2.8.3. SWOT Analysis
- 11.2.8.4. Recent Developments
- 11.2.8.5. Financials (Based on Availability)
- 11.2.9 Cognizant
- 11.2.9.1. Overview
- 11.2.9.2. Products
- 11.2.9.3. SWOT Analysis
- 11.2.9.4. Recent Developments
- 11.2.9.5. Financials (Based on Availability)
- 11.2.10 Recurrence Inc.
- 11.2.10.1. Overview
- 11.2.10.2. Products
- 11.2.10.3. SWOT Analysis
- 11.2.10.4. Recent Developments
- 11.2.10.5. Financials (Based on Availability)
- 11.2.11 Fundamentor
- 11.2.11.1. Overview
- 11.2.11.2. Products
- 11.2.11.3. SWOT Analysis
- 11.2.11.4. Recent Developments
- 11.2.11.5. Financials (Based on Availability)
- 11.2.12 Gametize
- 11.2.12.1. Overview
- 11.2.12.2. Products
- 11.2.12.3. SWOT Analysis
- 11.2.12.4. Recent Developments
- 11.2.12.5. Financials (Based on Availability)
- 11.2.13 GradeCraft
- 11.2.13.1. Overview
- 11.2.13.2. Products
- 11.2.13.3. SWOT Analysis
- 11.2.13.4. Recent Developments
- 11.2.13.5. Financials (Based on Availability)
- 11.2.14 Kuato Studios
- 11.2.14.1. Overview
- 11.2.14.2. Products
- 11.2.14.3. SWOT Analysis
- 11.2.14.4. Recent Developments
- 11.2.14.5. Financials (Based on Availability)
- 11.2.15 Kungfu-Math
- 11.2.15.1. Overview
- 11.2.15.2. Products
- 11.2.15.3. SWOT Analysis
- 11.2.15.4. Recent Developments
- 11.2.15.5. Financials (Based on Availability)
- 11.2.1 Badgeville
List of Figures
- Figure 1: Global E Learning Gamification Revenue Breakdown (undefined, %) by Region 2025 & 2033
- Figure 2: North America E Learning Gamification Revenue (undefined), by Application 2025 & 2033
- Figure 3: North America E Learning Gamification Revenue Share (%), by Application 2025 & 2033
- Figure 4: North America E Learning Gamification Revenue (undefined), by Type 2025 & 2033
- Figure 5: North America E Learning Gamification Revenue Share (%), by Type 2025 & 2033
- Figure 6: North America E Learning Gamification Revenue (undefined), by Country 2025 & 2033
- Figure 7: North America E Learning Gamification Revenue Share (%), by Country 2025 & 2033
- Figure 8: South America E Learning Gamification Revenue (undefined), by Application 2025 & 2033
- Figure 9: South America E Learning Gamification Revenue Share (%), by Application 2025 & 2033
- Figure 10: South America E Learning Gamification Revenue (undefined), by Type 2025 & 2033
- Figure 11: South America E Learning Gamification Revenue Share (%), by Type 2025 & 2033
- Figure 12: South America E Learning Gamification Revenue (undefined), by Country 2025 & 2033
- Figure 13: South America E Learning Gamification Revenue Share (%), by Country 2025 & 2033
- Figure 14: Europe E Learning Gamification Revenue (undefined), by Application 2025 & 2033
- Figure 15: Europe E Learning Gamification Revenue Share (%), by Application 2025 & 2033
- Figure 16: Europe E Learning Gamification Revenue (undefined), by Type 2025 & 2033
- Figure 17: Europe E Learning Gamification Revenue Share (%), by Type 2025 & 2033
- Figure 18: Europe E Learning Gamification Revenue (undefined), by Country 2025 & 2033
- Figure 19: Europe E Learning Gamification Revenue Share (%), by Country 2025 & 2033
- Figure 20: Middle East & Africa E Learning Gamification Revenue (undefined), by Application 2025 & 2033
- Figure 21: Middle East & Africa E Learning Gamification Revenue Share (%), by Application 2025 & 2033
- Figure 22: Middle East & Africa E Learning Gamification Revenue (undefined), by Type 2025 & 2033
- Figure 23: Middle East & Africa E Learning Gamification Revenue Share (%), by Type 2025 & 2033
- Figure 24: Middle East & Africa E Learning Gamification Revenue (undefined), by Country 2025 & 2033
- Figure 25: Middle East & Africa E Learning Gamification Revenue Share (%), by Country 2025 & 2033
- Figure 26: Asia Pacific E Learning Gamification Revenue (undefined), by Application 2025 & 2033
- Figure 27: Asia Pacific E Learning Gamification Revenue Share (%), by Application 2025 & 2033
- Figure 28: Asia Pacific E Learning Gamification Revenue (undefined), by Type 2025 & 2033
- Figure 29: Asia Pacific E Learning Gamification Revenue Share (%), by Type 2025 & 2033
- Figure 30: Asia Pacific E Learning Gamification Revenue (undefined), by Country 2025 & 2033
- Figure 31: Asia Pacific E Learning Gamification Revenue Share (%), by Country 2025 & 2033
List of Tables
- Table 1: Global E Learning Gamification Revenue undefined Forecast, by Application 2020 & 2033
- Table 2: Global E Learning Gamification Revenue undefined Forecast, by Type 2020 & 2033
- Table 3: Global E Learning Gamification Revenue undefined Forecast, by Region 2020 & 2033
- Table 4: Global E Learning Gamification Revenue undefined Forecast, by Application 2020 & 2033
- Table 5: Global E Learning Gamification Revenue undefined Forecast, by Type 2020 & 2033
- Table 6: Global E Learning Gamification Revenue undefined Forecast, by Country 2020 & 2033
- Table 7: United States E Learning Gamification Revenue (undefined) Forecast, by Application 2020 & 2033
- Table 8: Canada E Learning Gamification Revenue (undefined) Forecast, by Application 2020 & 2033
- Table 9: Mexico E Learning Gamification Revenue (undefined) Forecast, by Application 2020 & 2033
- Table 10: Global E Learning Gamification Revenue undefined Forecast, by Application 2020 & 2033
- Table 11: Global E Learning Gamification Revenue undefined Forecast, by Type 2020 & 2033
- Table 12: Global E Learning Gamification Revenue undefined Forecast, by Country 2020 & 2033
- Table 13: Brazil E Learning Gamification Revenue (undefined) Forecast, by Application 2020 & 2033
- Table 14: Argentina E Learning Gamification Revenue (undefined) Forecast, by Application 2020 & 2033
- Table 15: Rest of South America E Learning Gamification Revenue (undefined) Forecast, by Application 2020 & 2033
- Table 16: Global E Learning Gamification Revenue undefined Forecast, by Application 2020 & 2033
- Table 17: Global E Learning Gamification Revenue undefined Forecast, by Type 2020 & 2033
- Table 18: Global E Learning Gamification Revenue undefined Forecast, by Country 2020 & 2033
- Table 19: United Kingdom E Learning Gamification Revenue (undefined) Forecast, by Application 2020 & 2033
- Table 20: Germany E Learning Gamification Revenue (undefined) Forecast, by Application 2020 & 2033
- Table 21: France E Learning Gamification Revenue (undefined) Forecast, by Application 2020 & 2033
- Table 22: Italy E Learning Gamification Revenue (undefined) Forecast, by Application 2020 & 2033
- Table 23: Spain E Learning Gamification Revenue (undefined) Forecast, by Application 2020 & 2033
- Table 24: Russia E Learning Gamification Revenue (undefined) Forecast, by Application 2020 & 2033
- Table 25: Benelux E Learning Gamification Revenue (undefined) Forecast, by Application 2020 & 2033
- Table 26: Nordics E Learning Gamification Revenue (undefined) Forecast, by Application 2020 & 2033
- Table 27: Rest of Europe E Learning Gamification Revenue (undefined) Forecast, by Application 2020 & 2033
- Table 28: Global E Learning Gamification Revenue undefined Forecast, by Application 2020 & 2033
- Table 29: Global E Learning Gamification Revenue undefined Forecast, by Type 2020 & 2033
- Table 30: Global E Learning Gamification Revenue undefined Forecast, by Country 2020 & 2033
- Table 31: Turkey E Learning Gamification Revenue (undefined) Forecast, by Application 2020 & 2033
- Table 32: Israel E Learning Gamification Revenue (undefined) Forecast, by Application 2020 & 2033
- Table 33: GCC E Learning Gamification Revenue (undefined) Forecast, by Application 2020 & 2033
- Table 34: North Africa E Learning Gamification Revenue (undefined) Forecast, by Application 2020 & 2033
- Table 35: South Africa E Learning Gamification Revenue (undefined) Forecast, by Application 2020 & 2033
- Table 36: Rest of Middle East & Africa E Learning Gamification Revenue (undefined) Forecast, by Application 2020 & 2033
- Table 37: Global E Learning Gamification Revenue undefined Forecast, by Application 2020 & 2033
- Table 38: Global E Learning Gamification Revenue undefined Forecast, by Type 2020 & 2033
- Table 39: Global E Learning Gamification Revenue undefined Forecast, by Country 2020 & 2033
- Table 40: China E Learning Gamification Revenue (undefined) Forecast, by Application 2020 & 2033
- Table 41: India E Learning Gamification Revenue (undefined) Forecast, by Application 2020 & 2033
- Table 42: Japan E Learning Gamification Revenue (undefined) Forecast, by Application 2020 & 2033
- Table 43: South Korea E Learning Gamification Revenue (undefined) Forecast, by Application 2020 & 2033
- Table 44: ASEAN E Learning Gamification Revenue (undefined) Forecast, by Application 2020 & 2033
- Table 45: Oceania E Learning Gamification Revenue (undefined) Forecast, by Application 2020 & 2033
- Table 46: Rest of Asia Pacific E Learning Gamification Revenue (undefined) Forecast, by Application 2020 & 2033
Frequently Asked Questions
1. What is the projected Compound Annual Growth Rate (CAGR) of the E Learning Gamification?
The projected CAGR is approximately 26.06%.
2. Which companies are prominent players in the E Learning Gamification?
Key companies in the market include Badgeville, BI WORLDWIDE, Classcraft Studios, Microsoft, SAP, MPS Interactive Systems, D2L Corporation, Top Hat, Cognizant, Recurrence Inc., Fundamentor, Gametize, GradeCraft, Kuato Studios, Kungfu-Math.
3. What are the main segments of the E Learning Gamification?
The market segments include Application, Type.
4. Can you provide details about the market size?
The market size is estimated to be USD XXX N/A as of 2022.
5. What are some drivers contributing to market growth?
N/A
6. What are the notable trends driving market growth?
N/A
7. Are there any restraints impacting market growth?
N/A
8. Can you provide examples of recent developments in the market?
N/A
9. What pricing options are available for accessing the report?
Pricing options include single-user, multi-user, and enterprise licenses priced at USD 3950.00, USD 5925.00, and USD 7900.00 respectively.
10. Is the market size provided in terms of value or volume?
The market size is provided in terms of value, measured in N/A.
11. Are there any specific market keywords associated with the report?
Yes, the market keyword associated with the report is "E Learning Gamification," which aids in identifying and referencing the specific market segment covered.
12. How do I determine which pricing option suits my needs best?
The pricing options vary based on user requirements and access needs. Individual users may opt for single-user licenses, while businesses requiring broader access may choose multi-user or enterprise licenses for cost-effective access to the report.
13. Are there any additional resources or data provided in the E Learning Gamification report?
While the report offers comprehensive insights, it's advisable to review the specific contents or supplementary materials provided to ascertain if additional resources or data are available.
14. How can I stay updated on further developments or reports in the E Learning Gamification?
To stay informed about further developments, trends, and reports in the E Learning Gamification, consider subscribing to industry newsletters, following relevant companies and organizations, or regularly checking reputable industry news sources and publications.
Methodology
Step 1 - Identification of Relevant Samples Size from Population Database


Step 2 - Approaches for Defining Global Market Size (Value, Volume* & Price*)

Note*: In applicable scenarios
Step 3 - Data Sources
Primary Research
- Web Analytics
- Survey Reports
- Research Institute
- Latest Research Reports
- Opinion Leaders
Secondary Research
- Annual Reports
- White Paper
- Latest Press Release
- Industry Association
- Paid Database
- Investor Presentations

Step 4 - Data Triangulation
Involves using different sources of information in order to increase the validity of a study
These sources are likely to be stakeholders in a program - participants, other researchers, program staff, other community members, and so on.
Then we put all data in single framework & apply various statistical tools to find out the dynamic on the market.
During the analysis stage, feedback from the stakeholder groups would be compared to determine areas of agreement as well as areas of divergence