

Key Insights
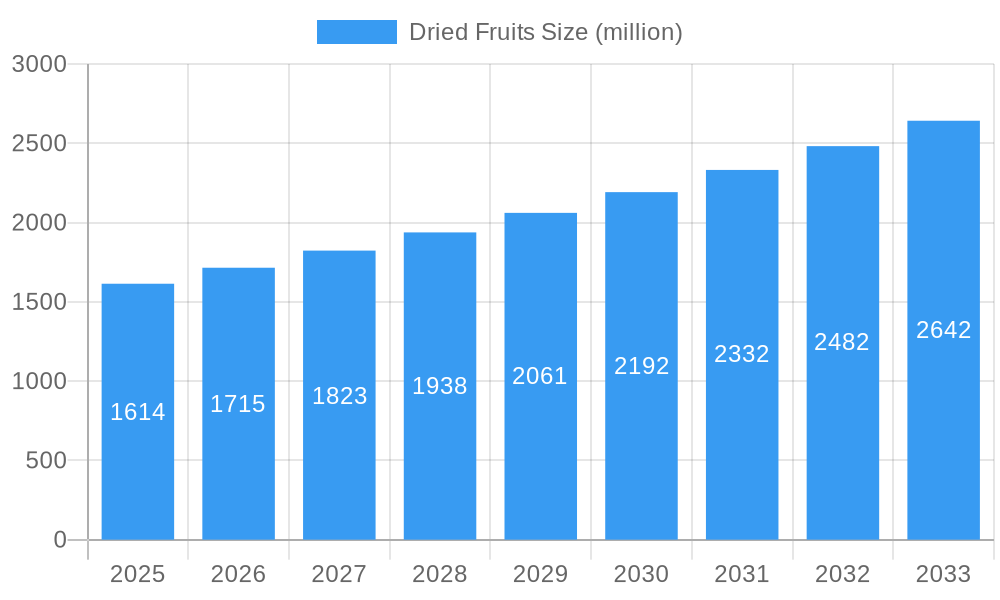
The global dried fruits market is poised for significant expansion, projected to reach a substantial USD 1614 million by 2025, with a robust Compound Annual Growth Rate (CAGR) of 6.2% anticipated throughout the forecast period of 2025-2033. This upward trajectory is propelled by a confluence of evolving consumer preferences, a growing emphasis on health and wellness, and the inherent convenience of dried fruits as a portable and long-lasting snack option. The increasing demand for natural and minimally processed food products further bolsters this market's growth. Consumers are actively seeking healthier alternatives to conventional snacks, and dried fruits, rich in fiber, vitamins, and minerals, perfectly align with these dietary aspirations. This trend is particularly evident in developed economies, where health-conscious consumers are willing to invest in premium, nutrient-dense food options. Furthermore, the versatility of dried fruits in culinary applications, spanning dairy products, confectionery, snacks, desserts, and bakery items, significantly contributes to their widespread adoption and market penetration.
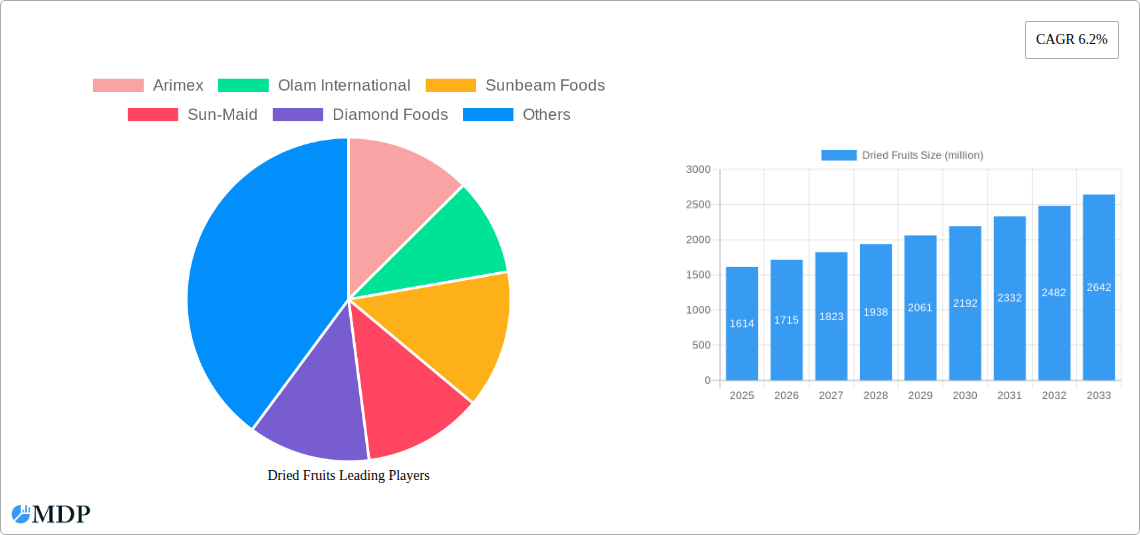
Dried Fruits Market Size (In Billion)
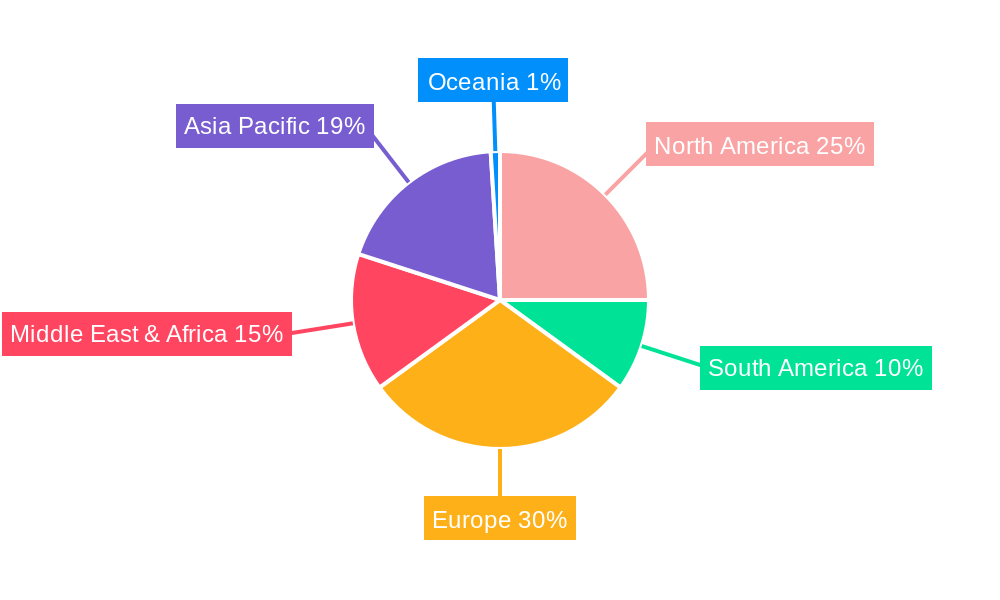
The market is segmented by key applications, with dairy products, confectionary, snacks, and desserts emerging as dominant segments due to their high consumption rates and the integral role dried fruits play in enhancing flavor and texture. In terms of type, apricots, figs, and dates are expected to witness substantial demand, driven by their unique nutritional profiles and widespread appeal across various cultures and cuisines. The Asia Pacific region is anticipated to lead the market growth, fueled by a burgeoning population, rising disposable incomes, and increasing awareness regarding the health benefits of dried fruits. North America and Europe also represent significant markets, characterized by a mature consumer base that values convenience and premium quality. While the market presents immense opportunities, challenges such as fluctuating raw material prices and intense competition among key players like Olam International, Sunbeam Foods, and Archer Daniels Midland necessitate strategic innovation and efficient supply chain management to sustain growth and capture market share.
Dried Fruits Company Market Share
Dried Fruits Market: A Comprehensive Industry Analysis (2019-2033)
Report Description:
Uncover the burgeoning global Dried Fruits market with this in-depth analysis, spanning from 2019 to 2033. This report provides essential intelligence for industry stakeholders, including manufacturers, suppliers, distributors, and investors, navigating the dynamic landscape of dried fruit production and consumption. With a focus on actionable insights, this report dives deep into market dynamics, emerging trends, key growth drivers, and challenges. Explore the extensive applications across Dairy Products, Confectionary, Snacks, Desserts, Bread, and Others, alongside the diverse range of fruit types including Apricots, Figs, Dates, Peaches, Berries, and Others. Gain a competitive edge by understanding the strategies of leading players such as Arimex, Olam International, Sunbeam Foods, Sun-Maid, Diamond Foods, Archer Daniels Midland, Kanegrade, Graceland, Hines Nut Company, H.B.S. Foods, and Ocean Spray Cranberries. The report forecasts the market to reach an estimated value of over one million dollars by the base year 2025, with a significant projected growth trajectory through 2033. Essential for strategic planning and investment decisions in this multi-million dollar industry.
Dried Fruits Market Dynamics & Concentration
The global Dried Fruits market exhibits a moderate concentration, with several key players dominating significant market share. Innovation drivers are primarily fueled by consumer demand for healthier snack options, convenient food products, and ingredients with extended shelf life. Regulatory frameworks, including food safety standards and labeling requirements, play a crucial role in shaping market entry and product development. Product substitutes, such as fresh fruits and other processed snacks, pose a competitive challenge, necessitating a focus on value-added dried fruit products. End-user trends are leaning towards natural ingredients, organic certifications, and functional benefits, driving demand for premium and specialty dried fruits. Mergers and acquisitions (M&A) activities are observed as companies seek to expand their product portfolios, geographic reach, and supply chain capabilities. Recent M&A deal counts suggest strategic consolidations aimed at achieving economies of scale and enhancing market penetration. For instance, a notable M&A deal in the past year involved a one million dollar valuation, indicative of the strategic importance of acquiring established brands and distribution networks.
Dried Fruits Industry Trends & Analysis
The dried fruits industry is experiencing robust growth, driven by an increasing consumer preference for natural, healthy, and convenient food options. The market is projected to expand at a Compound Annual Growth Rate (CAGR) of approximately xx% over the forecast period. This upward trajectory is underpinned by several key factors. Technological disruptions are revolutionizing drying processes, leading to improved nutrient retention, extended shelf life, and enhanced product quality. Advanced dehydration techniques, such as freeze-drying and vacuum drying, are gaining traction, allowing for the preservation of delicate flavors and textures. Consumer preferences are increasingly shifting towards plant-based diets and functional foods, where dried fruits play a vital role as a natural sweetener, nutrient booster, and source of dietary fiber. The perceived health benefits associated with dried fruits, including their rich antioxidant content and natural energy-providing properties, are significant market penetration drivers. Competitive dynamics within the industry are characterized by both established global players and emerging regional manufacturers. Companies are investing heavily in product diversification, launching innovative blends, and catering to niche markets, such as those seeking allergen-free or low-sugar options. The rise of e-commerce platforms has further democratized market access, allowing smaller producers to reach a wider customer base and increasing overall market competition. The global market size is expected to exceed one million dollars by 2025, with continued substantial growth anticipated.
Leading Markets & Segments in Dried Fruits
The dominant region in the dried fruits market is Asia Pacific, driven by its large population, rising disposable incomes, and traditional consumption patterns. Within this region, countries like China and India represent significant markets due to their established agricultural base and growing demand for processed food products.
Application Dominance: Snacks
The Snacks segment is currently the largest and fastest-growing application for dried fruits.
- Health Consciousness: Growing consumer awareness of health and wellness, coupled with the demand for convenient, on-the-go food options, propels the use of dried fruits in snack bars, trail mixes, and standalone snack packs.
- Natural Sweetness & Fiber: Dried fruits offer a natural source of sweetness and dietary fiber, aligning with consumer preferences for healthier snack alternatives to processed confectionery.
- Versatility: Their ability to be incorporated into various snack formulations, providing texture and flavor, makes them a preferred ingredient for manufacturers.
Type Dominance: Dates
Among the various types of dried fruits, Dates hold a commanding position.
- Nutritional Profile: Dates are recognized for their high energy content, essential vitamins, and minerals, making them a popular choice for health-conscious consumers and athletes.
- Cultural Significance: In many regions, particularly in the Middle East and North Africa, dates hold significant cultural and religious importance, driving consistent demand.
- Versatile Ingredient: Their natural sweetness and caramel-like flavor make them a versatile ingredient in both sweet and savory dishes, as well as a standalone snack.
The Dairy Products segment also shows significant growth potential, with dried fruits being incorporated into yogurts, cereals, and dairy-based desserts to enhance flavor, texture, and nutritional value. The Confectionary segment continues to be a strong application, with dried fruits used to add natural sweetness and a chewy texture to chocolates, candies, and baked goods.
Dried Fruits Product Developments
Product innovation in the dried fruits market is characterized by a focus on creating healthier, more convenient, and functional offerings. Companies are increasingly developing innovative blends of dried fruits with nuts and seeds to cater to the growing demand for wholesome snack options. The incorporation of dried fruits into novel food formats, such as dried fruit powders for smoothies and baking mixes, is gaining momentum. Furthermore, the emphasis on preserving natural flavors and nutrients through advanced drying technologies like freeze-drying and air-drying is a key trend. Packaging innovations, including resealable pouches and single-serving packs, are also enhancing convenience and extending shelf life, providing a competitive advantage in the bustling dried fruits sector.
Key Drivers of Dried Fruits Growth
The growth of the dried fruits market is propelled by several key drivers. Increasing consumer awareness of health benefits associated with natural foods, such as high fiber content and essential nutrients, is a primary driver. The convenience factor, owing to their long shelf life and portability, makes them an ideal snack for busy lifestyles. Technological advancements in drying and processing techniques are improving product quality and expanding the variety of available dried fruits. Furthermore, growing demand from the food and beverage industry for natural sweeteners and flavor enhancers, especially in the confectionery and dairy sectors, fuels market expansion. Favorable government initiatives promoting healthy eating and agricultural exports in key producing regions also contribute significantly to market growth.
Challenges in the Dried Fruits Market
Despite the positive growth trajectory, the dried fruits market faces several challenges. Volatility in raw material prices due to climate change and agricultural production fluctuations can impact profitability. Stringent food safety regulations and quality control standards in different export markets necessitate significant investment in compliance. Intense competition from both domestic and international players, alongside the availability of lower-priced substitutes, puts pressure on profit margins. Supply chain disruptions, including logistical complexities and storage requirements, can also pose significant hurdles. The need for continuous innovation to meet evolving consumer preferences and maintain market relevance presents an ongoing challenge for industry participants.
Emerging Opportunities in Dried Fruits
Emerging opportunities in the dried fruits market lie in the growing demand for exotic and less common dried fruit varieties, such as goji berries and acai. The expansion of the functional foods sector presents a significant opportunity, with dried fruits being incorporated into products offering specific health benefits, such as improved digestion or immune support. Strategic partnerships between dried fruit producers and manufacturers in the dairy, bakery, and health food industries can unlock new market segments. Furthermore, the increasing adoption of e-commerce platforms provides a direct channel to consumers, allowing for market expansion and brand building. Technological advancements in sustainable farming and processing methods can also create opportunities for companies focused on eco-friendly production.
Leading Players in the Dried Fruits Sector
- Arimex
- Olam International
- Sunbeam Foods
- Sun-Maid
- Diamond Foods
- Archer Daniels Midland
- Kanegrade
- Graceland
- Hines Nut Company
- H.B.S. Foods
- Ocean Spray Cranberries
Key Milestones in Dried Fruits Industry
- 2019: Increased consumer focus on plant-based diets and healthy snacking, boosting demand for dried fruits.
- 2020: Expansion of online retail channels, providing greater accessibility for dried fruit products.
- 2021: Significant investment in R&D for advanced drying technologies to preserve nutrients and improve shelf life.
- 2022: Launch of new dried fruit blends with superfoods and nuts, catering to health-conscious consumers.
- 2023: Growing emphasis on organic and sustainably sourced dried fruits, influencing production practices and market appeal.
- 2024: Increased M&A activities as larger companies acquire smaller niche players to diversify portfolios.
Strategic Outlook for Dried Fruits Market
The strategic outlook for the dried fruits market remains highly optimistic, driven by sustained consumer demand for healthy, convenient, and natural food ingredients. Growth accelerators include further innovation in product development, focusing on functional benefits and unique flavor profiles. Expanding into emerging markets with growing disposable incomes and increasing health awareness will be crucial. Strategic collaborations with key players in the food and beverage industry, along with leveraging digital marketing and e-commerce channels, will drive market penetration. Companies that prioritize sustainable sourcing, ethical production, and transparent labeling will likely gain a competitive advantage and foster long-term brand loyalty. The market is poised for continued expansion, with an estimated total market value projected to exceed one million dollars in the coming years.
Dried Fruits Segmentation
-
1. Application
- 1.1. Dairy Products
- 1.2. Confectionary
- 1.3. Snacks
- 1.4. Desserts
- 1.5. Bread
- 1.6. Others
-
2. Type
- 2.1. Apricots
- 2.2. Figs
- 2.3. Dates
- 2.4. Peaches
- 2.5. Berries
- 2.6. Others
Dried Fruits Segmentation By Geography
-
1. North America
- 1.1. United States
- 1.2. Canada
- 1.3. Mexico
-
2. South America
- 2.1. Brazil
- 2.2. Argentina
- 2.3. Rest of South America
-
3. Europe
- 3.1. United Kingdom
- 3.2. Germany
- 3.3. France
- 3.4. Italy
- 3.5. Spain
- 3.6. Russia
- 3.7. Benelux
- 3.8. Nordics
- 3.9. Rest of Europe
-
4. Middle East & Africa
- 4.1. Turkey
- 4.2. Israel
- 4.3. GCC
- 4.4. North Africa
- 4.5. South Africa
- 4.6. Rest of Middle East & Africa
-
5. Asia Pacific
- 5.1. China
- 5.2. India
- 5.3. Japan
- 5.4. South Korea
- 5.5. ASEAN
- 5.6. Oceania
- 5.7. Rest of Asia Pacific
Dried Fruits Regional Market Share
Geographic Coverage of Dried Fruits
Dried Fruits REPORT HIGHLIGHTS
| Aspects | Details |
|---|---|
| Study Period | 2020-2034 |
| Base Year | 2025 |
| Estimated Year | 2026 |
| Forecast Period | 2026-2034 |
| Historical Period | 2020-2025 |
| Growth Rate | CAGR of 5.72% from 2020-2034 |
| Segmentation |
|
Table of Contents
- 1. Introduction
- 1.1. Research Scope
- 1.2. Market Segmentation
- 1.3. Research Methodology
- 1.4. Definitions and Assumptions
- 2. Executive Summary
- 2.1. Introduction
- 3. Market Dynamics
- 3.1. Introduction
- 3.2. Market Drivers
- 3.3. Market Restrains
- 3.4. Market Trends
- 4. Market Factor Analysis
- 4.1. Porters Five Forces
- 4.2. Supply/Value Chain
- 4.3. PESTEL analysis
- 4.4. Market Entropy
- 4.5. Patent/Trademark Analysis
- 5. Global Dried Fruits Analysis, Insights and Forecast, 2020-2032
- 5.1. Market Analysis, Insights and Forecast - by Application
- 5.1.1. Dairy Products
- 5.1.2. Confectionary
- 5.1.3. Snacks
- 5.1.4. Desserts
- 5.1.5. Bread
- 5.1.6. Others
- 5.2. Market Analysis, Insights and Forecast - by Type
- 5.2.1. Apricots
- 5.2.2. Figs
- 5.2.3. Dates
- 5.2.4. Peaches
- 5.2.5. Berries
- 5.2.6. Others
- 5.3. Market Analysis, Insights and Forecast - by Region
- 5.3.1. North America
- 5.3.2. South America
- 5.3.3. Europe
- 5.3.4. Middle East & Africa
- 5.3.5. Asia Pacific
- 5.1. Market Analysis, Insights and Forecast - by Application
- 6. North America Dried Fruits Analysis, Insights and Forecast, 2020-2032
- 6.1. Market Analysis, Insights and Forecast - by Application
- 6.1.1. Dairy Products
- 6.1.2. Confectionary
- 6.1.3. Snacks
- 6.1.4. Desserts
- 6.1.5. Bread
- 6.1.6. Others
- 6.2. Market Analysis, Insights and Forecast - by Type
- 6.2.1. Apricots
- 6.2.2. Figs
- 6.2.3. Dates
- 6.2.4. Peaches
- 6.2.5. Berries
- 6.2.6. Others
- 6.1. Market Analysis, Insights and Forecast - by Application
- 7. South America Dried Fruits Analysis, Insights and Forecast, 2020-2032
- 7.1. Market Analysis, Insights and Forecast - by Application
- 7.1.1. Dairy Products
- 7.1.2. Confectionary
- 7.1.3. Snacks
- 7.1.4. Desserts
- 7.1.5. Bread
- 7.1.6. Others
- 7.2. Market Analysis, Insights and Forecast - by Type
- 7.2.1. Apricots
- 7.2.2. Figs
- 7.2.3. Dates
- 7.2.4. Peaches
- 7.2.5. Berries
- 7.2.6. Others
- 7.1. Market Analysis, Insights and Forecast - by Application
- 8. Europe Dried Fruits Analysis, Insights and Forecast, 2020-2032
- 8.1. Market Analysis, Insights and Forecast - by Application
- 8.1.1. Dairy Products
- 8.1.2. Confectionary
- 8.1.3. Snacks
- 8.1.4. Desserts
- 8.1.5. Bread
- 8.1.6. Others
- 8.2. Market Analysis, Insights and Forecast - by Type
- 8.2.1. Apricots
- 8.2.2. Figs
- 8.2.3. Dates
- 8.2.4. Peaches
- 8.2.5. Berries
- 8.2.6. Others
- 8.1. Market Analysis, Insights and Forecast - by Application
- 9. Middle East & Africa Dried Fruits Analysis, Insights and Forecast, 2020-2032
- 9.1. Market Analysis, Insights and Forecast - by Application
- 9.1.1. Dairy Products
- 9.1.2. Confectionary
- 9.1.3. Snacks
- 9.1.4. Desserts
- 9.1.5. Bread
- 9.1.6. Others
- 9.2. Market Analysis, Insights and Forecast - by Type
- 9.2.1. Apricots
- 9.2.2. Figs
- 9.2.3. Dates
- 9.2.4. Peaches
- 9.2.5. Berries
- 9.2.6. Others
- 9.1. Market Analysis, Insights and Forecast - by Application
- 10. Asia Pacific Dried Fruits Analysis, Insights and Forecast, 2020-2032
- 10.1. Market Analysis, Insights and Forecast - by Application
- 10.1.1. Dairy Products
- 10.1.2. Confectionary
- 10.1.3. Snacks
- 10.1.4. Desserts
- 10.1.5. Bread
- 10.1.6. Others
- 10.2. Market Analysis, Insights and Forecast - by Type
- 10.2.1. Apricots
- 10.2.2. Figs
- 10.2.3. Dates
- 10.2.4. Peaches
- 10.2.5. Berries
- 10.2.6. Others
- 10.1. Market Analysis, Insights and Forecast - by Application
- 11. Competitive Analysis
- 11.1. Global Market Share Analysis 2025
- 11.2. Company Profiles
- 11.2.1 Arimex
- 11.2.1.1. Overview
- 11.2.1.2. Products
- 11.2.1.3. SWOT Analysis
- 11.2.1.4. Recent Developments
- 11.2.1.5. Financials (Based on Availability)
- 11.2.2 Olam International
- 11.2.2.1. Overview
- 11.2.2.2. Products
- 11.2.2.3. SWOT Analysis
- 11.2.2.4. Recent Developments
- 11.2.2.5. Financials (Based on Availability)
- 11.2.3 Sunbeam Foods
- 11.2.3.1. Overview
- 11.2.3.2. Products
- 11.2.3.3. SWOT Analysis
- 11.2.3.4. Recent Developments
- 11.2.3.5. Financials (Based on Availability)
- 11.2.4 Sun-Maid
- 11.2.4.1. Overview
- 11.2.4.2. Products
- 11.2.4.3. SWOT Analysis
- 11.2.4.4. Recent Developments
- 11.2.4.5. Financials (Based on Availability)
- 11.2.5 Diamond Foods
- 11.2.5.1. Overview
- 11.2.5.2. Products
- 11.2.5.3. SWOT Analysis
- 11.2.5.4. Recent Developments
- 11.2.5.5. Financials (Based on Availability)
- 11.2.6 Archer Daniels Midland
- 11.2.6.1. Overview
- 11.2.6.2. Products
- 11.2.6.3. SWOT Analysis
- 11.2.6.4. Recent Developments
- 11.2.6.5. Financials (Based on Availability)
- 11.2.7 Kanegrade
- 11.2.7.1. Overview
- 11.2.7.2. Products
- 11.2.7.3. SWOT Analysis
- 11.2.7.4. Recent Developments
- 11.2.7.5. Financials (Based on Availability)
- 11.2.8 Graceland
- 11.2.8.1. Overview
- 11.2.8.2. Products
- 11.2.8.3. SWOT Analysis
- 11.2.8.4. Recent Developments
- 11.2.8.5. Financials (Based on Availability)
- 11.2.9 Hines Nut Company
- 11.2.9.1. Overview
- 11.2.9.2. Products
- 11.2.9.3. SWOT Analysis
- 11.2.9.4. Recent Developments
- 11.2.9.5. Financials (Based on Availability)
- 11.2.10 H.B.S. Foods
- 11.2.10.1. Overview
- 11.2.10.2. Products
- 11.2.10.3. SWOT Analysis
- 11.2.10.4. Recent Developments
- 11.2.10.5. Financials (Based on Availability)
- 11.2.11 Ocean Spray Cranberries
- 11.2.11.1. Overview
- 11.2.11.2. Products
- 11.2.11.3. SWOT Analysis
- 11.2.11.4. Recent Developments
- 11.2.11.5. Financials (Based on Availability)
- 11.2.1 Arimex
List of Figures
- Figure 1: Global Dried Fruits Revenue Breakdown (undefined, %) by Region 2025 & 2033
- Figure 2: Global Dried Fruits Volume Breakdown (K, %) by Region 2025 & 2033
- Figure 3: North America Dried Fruits Revenue (undefined), by Application 2025 & 2033
- Figure 4: North America Dried Fruits Volume (K), by Application 2025 & 2033
- Figure 5: North America Dried Fruits Revenue Share (%), by Application 2025 & 2033
- Figure 6: North America Dried Fruits Volume Share (%), by Application 2025 & 2033
- Figure 7: North America Dried Fruits Revenue (undefined), by Type 2025 & 2033
- Figure 8: North America Dried Fruits Volume (K), by Type 2025 & 2033
- Figure 9: North America Dried Fruits Revenue Share (%), by Type 2025 & 2033
- Figure 10: North America Dried Fruits Volume Share (%), by Type 2025 & 2033
- Figure 11: North America Dried Fruits Revenue (undefined), by Country 2025 & 2033
- Figure 12: North America Dried Fruits Volume (K), by Country 2025 & 2033
- Figure 13: North America Dried Fruits Revenue Share (%), by Country 2025 & 2033
- Figure 14: North America Dried Fruits Volume Share (%), by Country 2025 & 2033
- Figure 15: South America Dried Fruits Revenue (undefined), by Application 2025 & 2033
- Figure 16: South America Dried Fruits Volume (K), by Application 2025 & 2033
- Figure 17: South America Dried Fruits Revenue Share (%), by Application 2025 & 2033
- Figure 18: South America Dried Fruits Volume Share (%), by Application 2025 & 2033
- Figure 19: South America Dried Fruits Revenue (undefined), by Type 2025 & 2033
- Figure 20: South America Dried Fruits Volume (K), by Type 2025 & 2033
- Figure 21: South America Dried Fruits Revenue Share (%), by Type 2025 & 2033
- Figure 22: South America Dried Fruits Volume Share (%), by Type 2025 & 2033
- Figure 23: South America Dried Fruits Revenue (undefined), by Country 2025 & 2033
- Figure 24: South America Dried Fruits Volume (K), by Country 2025 & 2033
- Figure 25: South America Dried Fruits Revenue Share (%), by Country 2025 & 2033
- Figure 26: South America Dried Fruits Volume Share (%), by Country 2025 & 2033
- Figure 27: Europe Dried Fruits Revenue (undefined), by Application 2025 & 2033
- Figure 28: Europe Dried Fruits Volume (K), by Application 2025 & 2033
- Figure 29: Europe Dried Fruits Revenue Share (%), by Application 2025 & 2033
- Figure 30: Europe Dried Fruits Volume Share (%), by Application 2025 & 2033
- Figure 31: Europe Dried Fruits Revenue (undefined), by Type 2025 & 2033
- Figure 32: Europe Dried Fruits Volume (K), by Type 2025 & 2033
- Figure 33: Europe Dried Fruits Revenue Share (%), by Type 2025 & 2033
- Figure 34: Europe Dried Fruits Volume Share (%), by Type 2025 & 2033
- Figure 35: Europe Dried Fruits Revenue (undefined), by Country 2025 & 2033
- Figure 36: Europe Dried Fruits Volume (K), by Country 2025 & 2033
- Figure 37: Europe Dried Fruits Revenue Share (%), by Country 2025 & 2033
- Figure 38: Europe Dried Fruits Volume Share (%), by Country 2025 & 2033
- Figure 39: Middle East & Africa Dried Fruits Revenue (undefined), by Application 2025 & 2033
- Figure 40: Middle East & Africa Dried Fruits Volume (K), by Application 2025 & 2033
- Figure 41: Middle East & Africa Dried Fruits Revenue Share (%), by Application 2025 & 2033
- Figure 42: Middle East & Africa Dried Fruits Volume Share (%), by Application 2025 & 2033
- Figure 43: Middle East & Africa Dried Fruits Revenue (undefined), by Type 2025 & 2033
- Figure 44: Middle East & Africa Dried Fruits Volume (K), by Type 2025 & 2033
- Figure 45: Middle East & Africa Dried Fruits Revenue Share (%), by Type 2025 & 2033
- Figure 46: Middle East & Africa Dried Fruits Volume Share (%), by Type 2025 & 2033
- Figure 47: Middle East & Africa Dried Fruits Revenue (undefined), by Country 2025 & 2033
- Figure 48: Middle East & Africa Dried Fruits Volume (K), by Country 2025 & 2033
- Figure 49: Middle East & Africa Dried Fruits Revenue Share (%), by Country 2025 & 2033
- Figure 50: Middle East & Africa Dried Fruits Volume Share (%), by Country 2025 & 2033
- Figure 51: Asia Pacific Dried Fruits Revenue (undefined), by Application 2025 & 2033
- Figure 52: Asia Pacific Dried Fruits Volume (K), by Application 2025 & 2033
- Figure 53: Asia Pacific Dried Fruits Revenue Share (%), by Application 2025 & 2033
- Figure 54: Asia Pacific Dried Fruits Volume Share (%), by Application 2025 & 2033
- Figure 55: Asia Pacific Dried Fruits Revenue (undefined), by Type 2025 & 2033
- Figure 56: Asia Pacific Dried Fruits Volume (K), by Type 2025 & 2033
- Figure 57: Asia Pacific Dried Fruits Revenue Share (%), by Type 2025 & 2033
- Figure 58: Asia Pacific Dried Fruits Volume Share (%), by Type 2025 & 2033
- Figure 59: Asia Pacific Dried Fruits Revenue (undefined), by Country 2025 & 2033
- Figure 60: Asia Pacific Dried Fruits Volume (K), by Country 2025 & 2033
- Figure 61: Asia Pacific Dried Fruits Revenue Share (%), by Country 2025 & 2033
- Figure 62: Asia Pacific Dried Fruits Volume Share (%), by Country 2025 & 2033
List of Tables
- Table 1: Global Dried Fruits Revenue undefined Forecast, by Application 2020 & 2033
- Table 2: Global Dried Fruits Volume K Forecast, by Application 2020 & 2033
- Table 3: Global Dried Fruits Revenue undefined Forecast, by Type 2020 & 2033
- Table 4: Global Dried Fruits Volume K Forecast, by Type 2020 & 2033
- Table 5: Global Dried Fruits Revenue undefined Forecast, by Region 2020 & 2033
- Table 6: Global Dried Fruits Volume K Forecast, by Region 2020 & 2033
- Table 7: Global Dried Fruits Revenue undefined Forecast, by Application 2020 & 2033
- Table 8: Global Dried Fruits Volume K Forecast, by Application 2020 & 2033
- Table 9: Global Dried Fruits Revenue undefined Forecast, by Type 2020 & 2033
- Table 10: Global Dried Fruits Volume K Forecast, by Type 2020 & 2033
- Table 11: Global Dried Fruits Revenue undefined Forecast, by Country 2020 & 2033
- Table 12: Global Dried Fruits Volume K Forecast, by Country 2020 & 2033
- Table 13: United States Dried Fruits Revenue (undefined) Forecast, by Application 2020 & 2033
- Table 14: United States Dried Fruits Volume (K) Forecast, by Application 2020 & 2033
- Table 15: Canada Dried Fruits Revenue (undefined) Forecast, by Application 2020 & 2033
- Table 16: Canada Dried Fruits Volume (K) Forecast, by Application 2020 & 2033
- Table 17: Mexico Dried Fruits Revenue (undefined) Forecast, by Application 2020 & 2033
- Table 18: Mexico Dried Fruits Volume (K) Forecast, by Application 2020 & 2033
- Table 19: Global Dried Fruits Revenue undefined Forecast, by Application 2020 & 2033
- Table 20: Global Dried Fruits Volume K Forecast, by Application 2020 & 2033
- Table 21: Global Dried Fruits Revenue undefined Forecast, by Type 2020 & 2033
- Table 22: Global Dried Fruits Volume K Forecast, by Type 2020 & 2033
- Table 23: Global Dried Fruits Revenue undefined Forecast, by Country 2020 & 2033
- Table 24: Global Dried Fruits Volume K Forecast, by Country 2020 & 2033
- Table 25: Brazil Dried Fruits Revenue (undefined) Forecast, by Application 2020 & 2033
- Table 26: Brazil Dried Fruits Volume (K) Forecast, by Application 2020 & 2033
- Table 27: Argentina Dried Fruits Revenue (undefined) Forecast, by Application 2020 & 2033
- Table 28: Argentina Dried Fruits Volume (K) Forecast, by Application 2020 & 2033
- Table 29: Rest of South America Dried Fruits Revenue (undefined) Forecast, by Application 2020 & 2033
- Table 30: Rest of South America Dried Fruits Volume (K) Forecast, by Application 2020 & 2033
- Table 31: Global Dried Fruits Revenue undefined Forecast, by Application 2020 & 2033
- Table 32: Global Dried Fruits Volume K Forecast, by Application 2020 & 2033
- Table 33: Global Dried Fruits Revenue undefined Forecast, by Type 2020 & 2033
- Table 34: Global Dried Fruits Volume K Forecast, by Type 2020 & 2033
- Table 35: Global Dried Fruits Revenue undefined Forecast, by Country 2020 & 2033
- Table 36: Global Dried Fruits Volume K Forecast, by Country 2020 & 2033
- Table 37: United Kingdom Dried Fruits Revenue (undefined) Forecast, by Application 2020 & 2033
- Table 38: United Kingdom Dried Fruits Volume (K) Forecast, by Application 2020 & 2033
- Table 39: Germany Dried Fruits Revenue (undefined) Forecast, by Application 2020 & 2033
- Table 40: Germany Dried Fruits Volume (K) Forecast, by Application 2020 & 2033
- Table 41: France Dried Fruits Revenue (undefined) Forecast, by Application 2020 & 2033
- Table 42: France Dried Fruits Volume (K) Forecast, by Application 2020 & 2033
- Table 43: Italy Dried Fruits Revenue (undefined) Forecast, by Application 2020 & 2033
- Table 44: Italy Dried Fruits Volume (K) Forecast, by Application 2020 & 2033
- Table 45: Spain Dried Fruits Revenue (undefined) Forecast, by Application 2020 & 2033
- Table 46: Spain Dried Fruits Volume (K) Forecast, by Application 2020 & 2033
- Table 47: Russia Dried Fruits Revenue (undefined) Forecast, by Application 2020 & 2033
- Table 48: Russia Dried Fruits Volume (K) Forecast, by Application 2020 & 2033
- Table 49: Benelux Dried Fruits Revenue (undefined) Forecast, by Application 2020 & 2033
- Table 50: Benelux Dried Fruits Volume (K) Forecast, by Application 2020 & 2033
- Table 51: Nordics Dried Fruits Revenue (undefined) Forecast, by Application 2020 & 2033
- Table 52: Nordics Dried Fruits Volume (K) Forecast, by Application 2020 & 2033
- Table 53: Rest of Europe Dried Fruits Revenue (undefined) Forecast, by Application 2020 & 2033
- Table 54: Rest of Europe Dried Fruits Volume (K) Forecast, by Application 2020 & 2033
- Table 55: Global Dried Fruits Revenue undefined Forecast, by Application 2020 & 2033
- Table 56: Global Dried Fruits Volume K Forecast, by Application 2020 & 2033
- Table 57: Global Dried Fruits Revenue undefined Forecast, by Type 2020 & 2033
- Table 58: Global Dried Fruits Volume K Forecast, by Type 2020 & 2033
- Table 59: Global Dried Fruits Revenue undefined Forecast, by Country 2020 & 2033
- Table 60: Global Dried Fruits Volume K Forecast, by Country 2020 & 2033
- Table 61: Turkey Dried Fruits Revenue (undefined) Forecast, by Application 2020 & 2033
- Table 62: Turkey Dried Fruits Volume (K) Forecast, by Application 2020 & 2033
- Table 63: Israel Dried Fruits Revenue (undefined) Forecast, by Application 2020 & 2033
- Table 64: Israel Dried Fruits Volume (K) Forecast, by Application 2020 & 2033
- Table 65: GCC Dried Fruits Revenue (undefined) Forecast, by Application 2020 & 2033
- Table 66: GCC Dried Fruits Volume (K) Forecast, by Application 2020 & 2033
- Table 67: North Africa Dried Fruits Revenue (undefined) Forecast, by Application 2020 & 2033
- Table 68: North Africa Dried Fruits Volume (K) Forecast, by Application 2020 & 2033
- Table 69: South Africa Dried Fruits Revenue (undefined) Forecast, by Application 2020 & 2033
- Table 70: South Africa Dried Fruits Volume (K) Forecast, by Application 2020 & 2033
- Table 71: Rest of Middle East & Africa Dried Fruits Revenue (undefined) Forecast, by Application 2020 & 2033
- Table 72: Rest of Middle East & Africa Dried Fruits Volume (K) Forecast, by Application 2020 & 2033
- Table 73: Global Dried Fruits Revenue undefined Forecast, by Application 2020 & 2033
- Table 74: Global Dried Fruits Volume K Forecast, by Application 2020 & 2033
- Table 75: Global Dried Fruits Revenue undefined Forecast, by Type 2020 & 2033
- Table 76: Global Dried Fruits Volume K Forecast, by Type 2020 & 2033
- Table 77: Global Dried Fruits Revenue undefined Forecast, by Country 2020 & 2033
- Table 78: Global Dried Fruits Volume K Forecast, by Country 2020 & 2033
- Table 79: China Dried Fruits Revenue (undefined) Forecast, by Application 2020 & 2033
- Table 80: China Dried Fruits Volume (K) Forecast, by Application 2020 & 2033
- Table 81: India Dried Fruits Revenue (undefined) Forecast, by Application 2020 & 2033
- Table 82: India Dried Fruits Volume (K) Forecast, by Application 2020 & 2033
- Table 83: Japan Dried Fruits Revenue (undefined) Forecast, by Application 2020 & 2033
- Table 84: Japan Dried Fruits Volume (K) Forecast, by Application 2020 & 2033
- Table 85: South Korea Dried Fruits Revenue (undefined) Forecast, by Application 2020 & 2033
- Table 86: South Korea Dried Fruits Volume (K) Forecast, by Application 2020 & 2033
- Table 87: ASEAN Dried Fruits Revenue (undefined) Forecast, by Application 2020 & 2033
- Table 88: ASEAN Dried Fruits Volume (K) Forecast, by Application 2020 & 2033
- Table 89: Oceania Dried Fruits Revenue (undefined) Forecast, by Application 2020 & 2033
- Table 90: Oceania Dried Fruits Volume (K) Forecast, by Application 2020 & 2033
- Table 91: Rest of Asia Pacific Dried Fruits Revenue (undefined) Forecast, by Application 2020 & 2033
- Table 92: Rest of Asia Pacific Dried Fruits Volume (K) Forecast, by Application 2020 & 2033
Frequently Asked Questions
1. What is the projected Compound Annual Growth Rate (CAGR) of the Dried Fruits?
The projected CAGR is approximately 5.72%.
2. Which companies are prominent players in the Dried Fruits?
Key companies in the market include Arimex, Olam International, Sunbeam Foods, Sun-Maid, Diamond Foods, Archer Daniels Midland, Kanegrade, Graceland, Hines Nut Company, H.B.S. Foods, Ocean Spray Cranberries.
3. What are the main segments of the Dried Fruits?
The market segments include Application, Type.
4. Can you provide details about the market size?
The market size is estimated to be USD XXX N/A as of 2022.
5. What are some drivers contributing to market growth?
N/A
6. What are the notable trends driving market growth?
N/A
7. Are there any restraints impacting market growth?
N/A
8. Can you provide examples of recent developments in the market?
N/A
9. What pricing options are available for accessing the report?
Pricing options include single-user, multi-user, and enterprise licenses priced at USD 3950.00, USD 5925.00, and USD 7900.00 respectively.
10. Is the market size provided in terms of value or volume?
The market size is provided in terms of value, measured in N/A and volume, measured in K.
11. Are there any specific market keywords associated with the report?
Yes, the market keyword associated with the report is "Dried Fruits," which aids in identifying and referencing the specific market segment covered.
12. How do I determine which pricing option suits my needs best?
The pricing options vary based on user requirements and access needs. Individual users may opt for single-user licenses, while businesses requiring broader access may choose multi-user or enterprise licenses for cost-effective access to the report.
13. Are there any additional resources or data provided in the Dried Fruits report?
While the report offers comprehensive insights, it's advisable to review the specific contents or supplementary materials provided to ascertain if additional resources or data are available.
14. How can I stay updated on further developments or reports in the Dried Fruits?
To stay informed about further developments, trends, and reports in the Dried Fruits, consider subscribing to industry newsletters, following relevant companies and organizations, or regularly checking reputable industry news sources and publications.
Methodology
Step 1 - Identification of Relevant Samples Size from Population Database


Step 2 - Approaches for Defining Global Market Size (Value, Volume* & Price*)

Note*: In applicable scenarios
Step 3 - Data Sources
Primary Research
- Web Analytics
- Survey Reports
- Research Institute
- Latest Research Reports
- Opinion Leaders
Secondary Research
- Annual Reports
- White Paper
- Latest Press Release
- Industry Association
- Paid Database
- Investor Presentations

Step 4 - Data Triangulation
Involves using different sources of information in order to increase the validity of a study
These sources are likely to be stakeholders in a program - participants, other researchers, program staff, other community members, and so on.
Then we put all data in single framework & apply various statistical tools to find out the dynamic on the market.
During the analysis stage, feedback from the stakeholder groups would be compared to determine areas of agreement as well as areas of divergence