

Key Insights
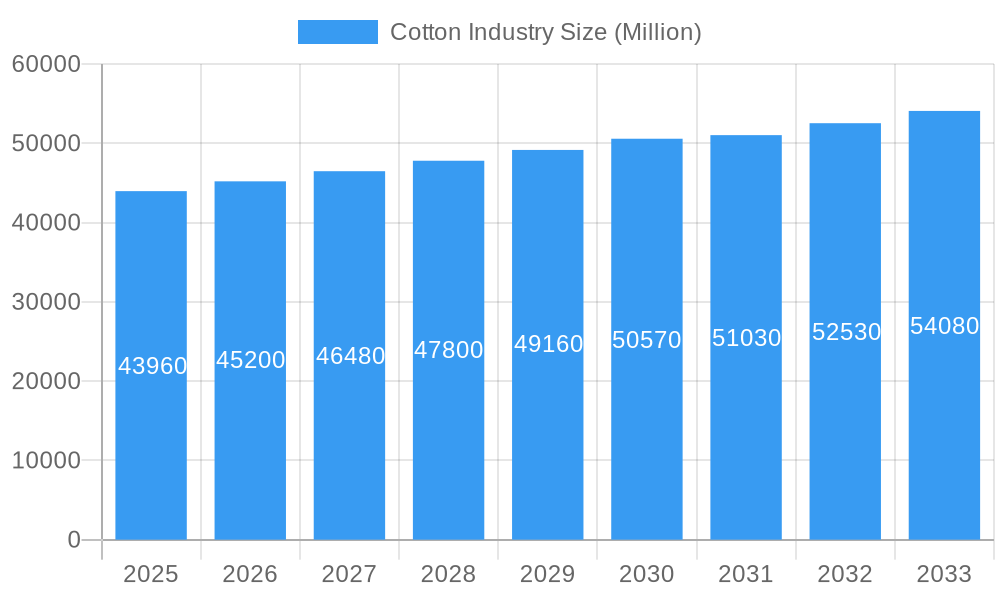
The global cotton industry, valued at $43.96 billion in 2025, is projected to experience steady growth, with a compound annual growth rate (CAGR) of 2.70% from 2025 to 2033. This growth is driven by several factors. Increasing demand for apparel, particularly in developing economies with burgeoning middle classes, fuels significant consumption. The home textiles sector also contributes substantially, with cotton remaining a preferred material for bedding, towels, and upholstery due to its comfort and breathability. Furthermore, the industrial applications of cotton, ranging from medical supplies to specialized fabrics, provide a consistent and expanding market segment. While challenges exist, including fluctuations in cotton prices influenced by weather patterns and global trade policies, the industry's resilience stems from the versatility of cotton and ongoing research into sustainable and high-yield farming practices. The shift towards eco-friendly and ethically sourced cotton is also driving innovation, further solidifying the industry's position. Different fiber lengths (short, medium, and long staple), grades (SLM, M, SM), colors (white and colored), and end-use applications cater to diverse market needs. Key players like Monsanto, Syngenta, and Bayer CropScience actively contribute to advancements in cotton genetics and agricultural technologies. Geographic distribution shows strong presence in regions like North America, Asia-Pacific (particularly China and India), and South America, with varied regional market shares reflecting differing levels of production and consumption.
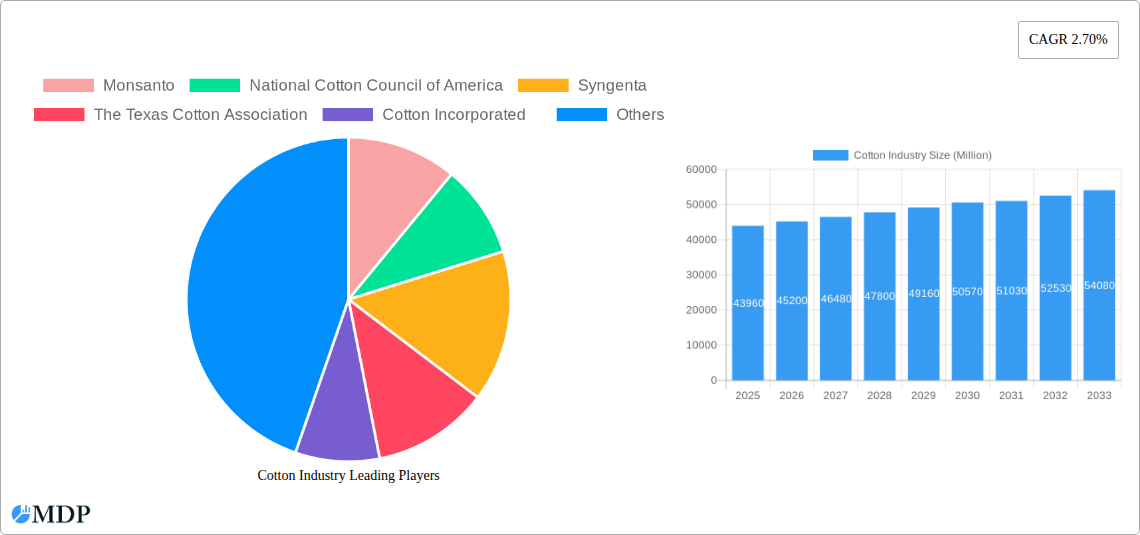
Cotton Industry Market Size (In Billion)
The segmentation of the cotton market by fiber length, grade, color, and end-use allows for targeted market analysis and strategic planning by industry stakeholders. Regional variations are influenced by factors such as climate conditions suitable for cotton cultivation, established textile manufacturing industries, and consumer preferences. Future growth will likely be shaped by advancements in genetic modification leading to enhanced yields and pest resistance, alongside increased consumer demand for sustainable and traceable cotton products. The industry's ability to adapt to changing environmental concerns and consumer expectations will be crucial for continued success in the forecast period. Competitive pressures among key players will drive innovation and efficiency gains across the value chain. Government policies and international trade agreements will also play a role in shaping the future landscape of the global cotton market.
Cotton Industry Company Market Share
Cotton Industry Market Report: 2019-2033
This comprehensive report provides an in-depth analysis of the global cotton industry, offering invaluable insights for stakeholders, investors, and industry professionals. With a study period spanning 2019-2033, a base year of 2025, and a forecast period of 2025-2033, this report leverages extensive data and market research to deliver a clear understanding of current dynamics and future trends. The report covers over $xx Million market value and projects significant growth.
Cotton Industry Market Dynamics & Concentration
The global cotton market, valued at approximately $xx Million in 2025, exhibits a moderately concentrated structure. Key players like Monsanto, National Cotton Council of America, Syngenta, The Texas Cotton Association, Cotton Incorporated, International Cotton Association, and Bayer CropScience hold significant market share, though the exact percentage varies across segments and regions. Innovation is driven by advancements in seed technology, genetic engineering (e.g., Bt cotton), and sustainable farming practices. Regulatory frameworks, including those related to pesticide use and environmental protection, significantly impact production costs and market access. Product substitutes, such as synthetic fibers (polyester, nylon), pose ongoing competitive pressure. End-user trends, particularly a growing preference for sustainable and ethically sourced cotton, are reshaping the market landscape. M&A activity within the industry has been moderate in recent years, with xx major deals reported between 2019 and 2024. This activity is primarily focused on consolidating seed production and improving supply chain efficiency.
- Market Share: Dominated by a few major players, with smaller players competing in niche segments.
- M&A Deal Counts: Approximately xx major mergers and acquisitions between 2019 and 2024.
- Innovation Drivers: Genetic engineering, sustainable farming practices, and advancements in seed technology.
- Regulatory Frameworks: Stringent regulations on pesticide use and environmental protection impact production.
Cotton Industry Industry Trends & Analysis
The global cotton market is poised for robust growth, with a projected Compound Annual Growth Rate (CAGR) of **[Insert Specific CAGR Here]%** during the forecast period (2025-2033). This expansion is fueled by a confluence of factors, notably the ever-increasing global population and rising disposable incomes, which directly translate into heightened demand for apparel and home textiles – the core applications for cotton. Technological advancements are also playing a pivotal role. The development of innovative, high-yield, and pest-resistant cotton varieties is significantly boosting productivity and driving down production costs, making cotton more competitive. However, the industry is not without its hurdles. Producers and manufacturers must navigate the complexities of fluctuating cotton prices, the unpredictability of weather patterns that can impact yields, and the persistent challenge of competition from synthetic fibers. In response to these dynamics, a significant shift in consumer preferences towards sustainable and ethically produced cotton is creating substantial opportunities for organic and fair-trade cotton providers. While organic cotton's market penetration is steadily increasing, it still represents a modest portion of overall cotton production. The competitive landscape remains intensely dynamic, with both established industry giants and agile emerging companies actively vying for market share through a strategic combination of groundbreaking innovation, effective branding, and optimized supply chain management. The growing imperative for sustainable cotton sourcing will be a major catalyst for future market expansion.
Leading Markets & Segments in Cotton Industry
India and China remain the leading cotton-producing countries globally, accounting for a significant portion of total output. Within the fiber length segments, medium-staple cotton dominates the market due to its versatility and cost-effectiveness. The most prevalent grade is Middling (M), reflecting the balance between quality and price. White cotton maintains its dominant position, owing to its suitability for a wider range of applications. The apparel industry is the largest end-use segment, followed by home textiles and industrial applications.
- Key Drivers for Leading Regions:
- India: Favorable climatic conditions, government support for cotton farming, and a large domestic market.
- China: Extensive cotton cultivation area, robust textile industry, and significant government investment in agricultural research.
- Dominant Segments:
- Fiber Length: Medium-staple cotton
- Grade: Middling (M)
- Color: White
- End Use: Apparel
Cotton Industry Product Developments
Innovation within the cotton industry is accelerating, marked by the advent of advanced genetically modified (GM) cotton varieties engineered for superior pest resistance and enhanced yield capabilities. Alongside these technological leaps, the cultivation of organic cotton is gaining traction, addressing critical concerns related to pest management, water conservation, and overall environmental sustainability. Current technological trends are laser-focused on elevating fiber quality, maximizing yield, and minimizing the ecological footprint associated with cotton production. The market's receptiveness to these innovations is exceptionally strong, driven by a burgeoning consumer demand for cotton products that are not only of high quality but also produced with a commitment to sustainability.
Key Drivers of Cotton Industry Growth
Several factors contribute to the growth of the cotton industry. Technological advancements in seed technology and farming practices boost yields and reduce production costs. Favorable economic conditions, particularly in emerging economies, drive increased demand for cotton products. Furthermore, supportive government policies and initiatives promote cotton production and the textile industry.
Challenges in the Cotton Industry Market
The cotton industry is confronted by a multifaceted array of challenges. Pronounced fluctuations in cotton prices introduce significant financial uncertainty for both growers and downstream manufacturers. Disruptions within the supply chain and logistical complexities can impede the timely and efficient delivery of cotton, impacting production schedules and market responsiveness. Furthermore, the persistent and intense competition posed by synthetic fibers necessitates continuous innovation and rigorous cost optimization strategies to maintain market relevance. These combined factors collectively exert pressure on industry growth and profitability.
Emerging Opportunities in Cotton Industry
The cotton industry presents significant opportunities for growth. Technological breakthroughs in sustainable cotton production methods are gaining traction. Strategic partnerships between producers, manufacturers, and retailers are enhancing supply chain transparency and efficiency. Market expansion into new geographies with rising consumer demand further fuels growth potential.
Leading Players in the Cotton Industry Sector
- Olam International
- Louis Dreyfus Company
- Bunge Limited
- Archer Daniels Midland Company
- Monsanto (now part of Bayer)
- National Cotton Council of America
- Syngenta (now part of ChemChina)
- The Texas Cotton Association
- Cotton Incorporated
- International Cotton Association
- Bayer CropScience
- Viterra
Key Milestones in Cotton Industry Industry
- September 2022: Two new organic cotton varieties were introduced in India, boosting sustainable cotton production.
- August 2022: Several major apparel brands joined the Organic Cotton Accelerator (OCA), signaling increased industry commitment to sustainability.
- March 2022: Armor seed company launched new cotton varieties with improved fiber quality and pest resistance, enhancing productivity.
Strategic Outlook for Cotton Industry Market
The future trajectory of the cotton industry is intrinsically linked to its capacity for agile adaptation to evolving consumer expectations and the relentless pace of technological advancement. Embracing and implementing sustainable production practices, coupled with forging strategic alliances, will be paramount in securing sustained long-term growth. A dedicated focus on developing value-added cotton products and pioneering innovations in textile technology will be instrumental in fortifying the industry's market competitiveness. The sector's proactive engagement in addressing environmental concerns and bolstering supply chain resilience will be critical determinants in unlocking its full future market potential.
Cotton Industry Segmentation
- 1. Production Analysis
- 2. Consumption Analysis
- 3. Import Market Analysis (Value & Volume)
- 4. Export Market Analysis (Value & Volume)
- 5. Price Trend Analysis
Cotton Industry Segmentation By Geography
-
1. North America
- 1.1. United States
- 1.2. Canada
- 1.3. Mexico
-
2. Europe
- 2.1. Germany
- 2.2. France
- 2.3. Russia
- 2.4. Greece
- 2.5. Italy
-
3. Asia Pacific
- 3.1. China
- 3.2. India
- 3.3. Australia
- 3.4. Pakistan
- 3.5. Bangladesh
-
4. South America
- 4.1. Brazil
- 4.2. Argentina
- 5. Middle East
-
6. South Africa
- 6.1. Turkey
- 6.2. Egypt
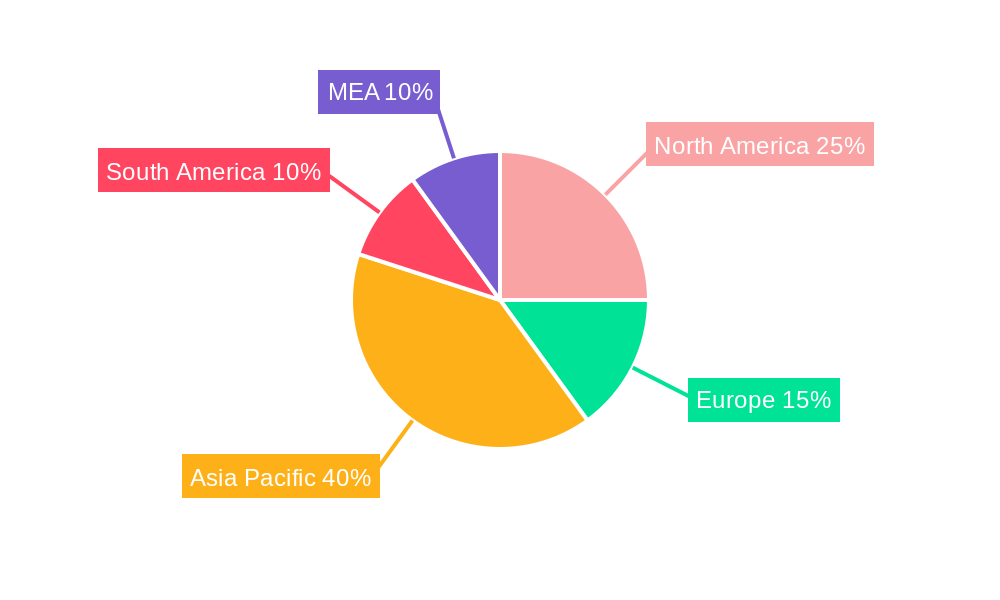
Cotton Industry Regional Market Share
Geographic Coverage of Cotton Industry
Cotton Industry REPORT HIGHLIGHTS
| Aspects | Details |
|---|---|
| Study Period | 2020-2034 |
| Base Year | 2025 |
| Estimated Year | 2026 |
| Forecast Period | 2026-2034 |
| Historical Period | 2020-2025 |
| Growth Rate | CAGR of 2.70% from 2020-2034 |
| Segmentation |
|
Table of Contents
- 1. Introduction
- 1.1. Research Scope
- 1.2. Market Segmentation
- 1.3. Research Objective
- 1.4. Definitions and Assumptions
- 2. Executive Summary
- 2.1. Market Snapshot
- 3. Market Dynamics
- 3.1. Market Drivers
- 3.2. Market Restrains
- 3.3. Market Trends
- 3.4. Market Opportunities
- 4. Market Factor Analysis
- 4.1. Porters Five Forces
- 4.1.1. Bargaining Power of Suppliers
- 4.1.2. Bargaining Power of Buyers
- 4.1.3. Threat of New Entrants
- 4.1.4. Threat of Substitutes
- 4.1.5. Competitive Rivalry
- 4.2. PESTEL analysis
- 4.3. BCG Analysis
- 4.3.1. Stars (High Growth, High Market Share)
- 4.3.2. Cash Cows (Low Growth, High Market Share)
- 4.3.3. Question Mark (High Growth, Low Market Share)
- 4.3.4. Dogs (Low Growth, Low Market Share)
- 4.4. Ansoff Matrix Analysis
- 4.5. Supply Chain Analysis
- 4.6. Regulatory Landscape
- 4.7. Current Market Potential and Opportunity Assessment (TAM–SAM–SOM Framework)
- 4.8. MDP Analyst Note
- 4.1. Porters Five Forces
- 5. Market Analysis, Insights and Forecast 2021-2033
- 5.1. Market Analysis, Insights and Forecast - by Production Analysis
- 5.2. Market Analysis, Insights and Forecast - by Consumption Analysis
- 5.3. Market Analysis, Insights and Forecast - by Import Market Analysis (Value & Volume)
- 5.4. Market Analysis, Insights and Forecast - by Export Market Analysis (Value & Volume)
- 5.5. Market Analysis, Insights and Forecast - by Price Trend Analysis
- 5.6. Market Analysis, Insights and Forecast - by Region
- 5.6.1. North America
- 5.6.2. Europe
- 5.6.3. Asia Pacific
- 5.6.4. South America
- 5.6.5. Middle East
- 5.6.6. South Africa
- 6. Global Cotton Industry Analysis, Insights and Forecast, 2021-2033
- 6.1. Market Analysis, Insights and Forecast - by Production Analysis
- 6.2. Market Analysis, Insights and Forecast - by Consumption Analysis
- 6.3. Market Analysis, Insights and Forecast - by Import Market Analysis (Value & Volume)
- 6.4. Market Analysis, Insights and Forecast - by Export Market Analysis (Value & Volume)
- 6.5. Market Analysis, Insights and Forecast - by Price Trend Analysis
- 7. North America Cotton Industry Analysis, Insights and Forecast, 2020-2032
- 7.1. Market Analysis, Insights and Forecast - by Production Analysis
- 7.2. Market Analysis, Insights and Forecast - by Consumption Analysis
- 7.3. Market Analysis, Insights and Forecast - by Import Market Analysis (Value & Volume)
- 7.4. Market Analysis, Insights and Forecast - by Export Market Analysis (Value & Volume)
- 7.5. Market Analysis, Insights and Forecast - by Price Trend Analysis
- 8. Europe Cotton Industry Analysis, Insights and Forecast, 2020-2032
- 8.1. Market Analysis, Insights and Forecast - by Production Analysis
- 8.2. Market Analysis, Insights and Forecast - by Consumption Analysis
- 8.3. Market Analysis, Insights and Forecast - by Import Market Analysis (Value & Volume)
- 8.4. Market Analysis, Insights and Forecast - by Export Market Analysis (Value & Volume)
- 8.5. Market Analysis, Insights and Forecast - by Price Trend Analysis
- 9. Asia Pacific Cotton Industry Analysis, Insights and Forecast, 2020-2032
- 9.1. Market Analysis, Insights and Forecast - by Production Analysis
- 9.2. Market Analysis, Insights and Forecast - by Consumption Analysis
- 9.3. Market Analysis, Insights and Forecast - by Import Market Analysis (Value & Volume)
- 9.4. Market Analysis, Insights and Forecast - by Export Market Analysis (Value & Volume)
- 9.5. Market Analysis, Insights and Forecast - by Price Trend Analysis
- 10. South America Cotton Industry Analysis, Insights and Forecast, 2020-2032
- 10.1. Market Analysis, Insights and Forecast - by Production Analysis
- 10.2. Market Analysis, Insights and Forecast - by Consumption Analysis
- 10.3. Market Analysis, Insights and Forecast - by Import Market Analysis (Value & Volume)
- 10.4. Market Analysis, Insights and Forecast - by Export Market Analysis (Value & Volume)
- 10.5. Market Analysis, Insights and Forecast - by Price Trend Analysis
- 11. Middle East Cotton Industry Analysis, Insights and Forecast, 2020-2032
- 11.1. Market Analysis, Insights and Forecast - by Production Analysis
- 11.2. Market Analysis, Insights and Forecast - by Consumption Analysis
- 11.3. Market Analysis, Insights and Forecast - by Import Market Analysis (Value & Volume)
- 11.4. Market Analysis, Insights and Forecast - by Export Market Analysis (Value & Volume)
- 11.5. Market Analysis, Insights and Forecast - by Price Trend Analysis
- 12. South Africa Cotton Industry Analysis, Insights and Forecast, 2020-2032
- 12.1. Market Analysis, Insights and Forecast - by Production Analysis
- 12.2. Market Analysis, Insights and Forecast - by Consumption Analysis
- 12.3. Market Analysis, Insights and Forecast - by Import Market Analysis (Value & Volume)
- 12.4. Market Analysis, Insights and Forecast - by Export Market Analysis (Value & Volume)
- 12.5. Market Analysis, Insights and Forecast - by Price Trend Analysis
- 13. Competitive Analysis
- 13.1. Company Profiles
- 13.1.1 Monsanto
- 13.1.1.1. Company Overview
- 13.1.1.2. Products
- 13.1.1.3. Company Financials
- 13.1.1.4. SWOT Analysis
- 13.1.2 National Cotton Council of America
- 13.1.2.1. Company Overview
- 13.1.2.2. Products
- 13.1.2.3. Company Financials
- 13.1.2.4. SWOT Analysis
- 13.1.3 Syngenta
- 13.1.3.1. Company Overview
- 13.1.3.2. Products
- 13.1.3.3. Company Financials
- 13.1.3.4. SWOT Analysis
- 13.1.4 The Texas Cotton Association
- 13.1.4.1. Company Overview
- 13.1.4.2. Products
- 13.1.4.3. Company Financials
- 13.1.4.4. SWOT Analysis
- 13.1.5 Cotton Incorporated
- 13.1.5.1. Company Overview
- 13.1.5.2. Products
- 13.1.5.3. Company Financials
- 13.1.5.4. SWOT Analysis
- 13.1.6 International Cotton Association
- 13.1.6.1. Company Overview
- 13.1.6.2. Products
- 13.1.6.3. Company Financials
- 13.1.6.4. SWOT Analysis
- 13.1.7 Bayer CropScience
- 13.1.7.1. Company Overview
- 13.1.7.2. Products
- 13.1.7.3. Company Financials
- 13.1.7.4. SWOT Analysis
- 13.1.1 Monsanto
- 13.2. Market Entropy
- 13.2.1 Company's Key Areas Served
- 13.2.2 Recent Developments
- 13.3. Company Market Share Analysis 2025
- 13.3.1 Top 5 Companies Market Share Analysis
- 13.3.2 Top 3 Companies Market Share Analysis
- 13.4. List of Potential Customers
- 14. Research Methodology
List of Figures
- Figure 1: Global Cotton Industry Revenue Breakdown (Million, %) by Region 2025 & 2033
- Figure 2: Global Cotton Industry Volume Breakdown (Kiloton, %) by Region 2025 & 2033
- Figure 3: North America Cotton Industry Revenue (Million), by Production Analysis 2025 & 2033
- Figure 4: North America Cotton Industry Volume (Kiloton), by Production Analysis 2025 & 2033
- Figure 5: North America Cotton Industry Revenue Share (%), by Production Analysis 2025 & 2033
- Figure 6: North America Cotton Industry Volume Share (%), by Production Analysis 2025 & 2033
- Figure 7: North America Cotton Industry Revenue (Million), by Consumption Analysis 2025 & 2033
- Figure 8: North America Cotton Industry Volume (Kiloton), by Consumption Analysis 2025 & 2033
- Figure 9: North America Cotton Industry Revenue Share (%), by Consumption Analysis 2025 & 2033
- Figure 10: North America Cotton Industry Volume Share (%), by Consumption Analysis 2025 & 2033
- Figure 11: North America Cotton Industry Revenue (Million), by Import Market Analysis (Value & Volume) 2025 & 2033
- Figure 12: North America Cotton Industry Volume (Kiloton), by Import Market Analysis (Value & Volume) 2025 & 2033
- Figure 13: North America Cotton Industry Revenue Share (%), by Import Market Analysis (Value & Volume) 2025 & 2033
- Figure 14: North America Cotton Industry Volume Share (%), by Import Market Analysis (Value & Volume) 2025 & 2033
- Figure 15: North America Cotton Industry Revenue (Million), by Export Market Analysis (Value & Volume) 2025 & 2033
- Figure 16: North America Cotton Industry Volume (Kiloton), by Export Market Analysis (Value & Volume) 2025 & 2033
- Figure 17: North America Cotton Industry Revenue Share (%), by Export Market Analysis (Value & Volume) 2025 & 2033
- Figure 18: North America Cotton Industry Volume Share (%), by Export Market Analysis (Value & Volume) 2025 & 2033
- Figure 19: North America Cotton Industry Revenue (Million), by Price Trend Analysis 2025 & 2033
- Figure 20: North America Cotton Industry Volume (Kiloton), by Price Trend Analysis 2025 & 2033
- Figure 21: North America Cotton Industry Revenue Share (%), by Price Trend Analysis 2025 & 2033
- Figure 22: North America Cotton Industry Volume Share (%), by Price Trend Analysis 2025 & 2033
- Figure 23: North America Cotton Industry Revenue (Million), by Country 2025 & 2033
- Figure 24: North America Cotton Industry Volume (Kiloton), by Country 2025 & 2033
- Figure 25: North America Cotton Industry Revenue Share (%), by Country 2025 & 2033
- Figure 26: North America Cotton Industry Volume Share (%), by Country 2025 & 2033
- Figure 27: Europe Cotton Industry Revenue (Million), by Production Analysis 2025 & 2033
- Figure 28: Europe Cotton Industry Volume (Kiloton), by Production Analysis 2025 & 2033
- Figure 29: Europe Cotton Industry Revenue Share (%), by Production Analysis 2025 & 2033
- Figure 30: Europe Cotton Industry Volume Share (%), by Production Analysis 2025 & 2033
- Figure 31: Europe Cotton Industry Revenue (Million), by Consumption Analysis 2025 & 2033
- Figure 32: Europe Cotton Industry Volume (Kiloton), by Consumption Analysis 2025 & 2033
- Figure 33: Europe Cotton Industry Revenue Share (%), by Consumption Analysis 2025 & 2033
- Figure 34: Europe Cotton Industry Volume Share (%), by Consumption Analysis 2025 & 2033
- Figure 35: Europe Cotton Industry Revenue (Million), by Import Market Analysis (Value & Volume) 2025 & 2033
- Figure 36: Europe Cotton Industry Volume (Kiloton), by Import Market Analysis (Value & Volume) 2025 & 2033
- Figure 37: Europe Cotton Industry Revenue Share (%), by Import Market Analysis (Value & Volume) 2025 & 2033
- Figure 38: Europe Cotton Industry Volume Share (%), by Import Market Analysis (Value & Volume) 2025 & 2033
- Figure 39: Europe Cotton Industry Revenue (Million), by Export Market Analysis (Value & Volume) 2025 & 2033
- Figure 40: Europe Cotton Industry Volume (Kiloton), by Export Market Analysis (Value & Volume) 2025 & 2033
- Figure 41: Europe Cotton Industry Revenue Share (%), by Export Market Analysis (Value & Volume) 2025 & 2033
- Figure 42: Europe Cotton Industry Volume Share (%), by Export Market Analysis (Value & Volume) 2025 & 2033
- Figure 43: Europe Cotton Industry Revenue (Million), by Price Trend Analysis 2025 & 2033
- Figure 44: Europe Cotton Industry Volume (Kiloton), by Price Trend Analysis 2025 & 2033
- Figure 45: Europe Cotton Industry Revenue Share (%), by Price Trend Analysis 2025 & 2033
- Figure 46: Europe Cotton Industry Volume Share (%), by Price Trend Analysis 2025 & 2033
- Figure 47: Europe Cotton Industry Revenue (Million), by Country 2025 & 2033
- Figure 48: Europe Cotton Industry Volume (Kiloton), by Country 2025 & 2033
- Figure 49: Europe Cotton Industry Revenue Share (%), by Country 2025 & 2033
- Figure 50: Europe Cotton Industry Volume Share (%), by Country 2025 & 2033
- Figure 51: Asia Pacific Cotton Industry Revenue (Million), by Production Analysis 2025 & 2033
- Figure 52: Asia Pacific Cotton Industry Volume (Kiloton), by Production Analysis 2025 & 2033
- Figure 53: Asia Pacific Cotton Industry Revenue Share (%), by Production Analysis 2025 & 2033
- Figure 54: Asia Pacific Cotton Industry Volume Share (%), by Production Analysis 2025 & 2033
- Figure 55: Asia Pacific Cotton Industry Revenue (Million), by Consumption Analysis 2025 & 2033
- Figure 56: Asia Pacific Cotton Industry Volume (Kiloton), by Consumption Analysis 2025 & 2033
- Figure 57: Asia Pacific Cotton Industry Revenue Share (%), by Consumption Analysis 2025 & 2033
- Figure 58: Asia Pacific Cotton Industry Volume Share (%), by Consumption Analysis 2025 & 2033
- Figure 59: Asia Pacific Cotton Industry Revenue (Million), by Import Market Analysis (Value & Volume) 2025 & 2033
- Figure 60: Asia Pacific Cotton Industry Volume (Kiloton), by Import Market Analysis (Value & Volume) 2025 & 2033
- Figure 61: Asia Pacific Cotton Industry Revenue Share (%), by Import Market Analysis (Value & Volume) 2025 & 2033
- Figure 62: Asia Pacific Cotton Industry Volume Share (%), by Import Market Analysis (Value & Volume) 2025 & 2033
- Figure 63: Asia Pacific Cotton Industry Revenue (Million), by Export Market Analysis (Value & Volume) 2025 & 2033
- Figure 64: Asia Pacific Cotton Industry Volume (Kiloton), by Export Market Analysis (Value & Volume) 2025 & 2033
- Figure 65: Asia Pacific Cotton Industry Revenue Share (%), by Export Market Analysis (Value & Volume) 2025 & 2033
- Figure 66: Asia Pacific Cotton Industry Volume Share (%), by Export Market Analysis (Value & Volume) 2025 & 2033
- Figure 67: Asia Pacific Cotton Industry Revenue (Million), by Price Trend Analysis 2025 & 2033
- Figure 68: Asia Pacific Cotton Industry Volume (Kiloton), by Price Trend Analysis 2025 & 2033
- Figure 69: Asia Pacific Cotton Industry Revenue Share (%), by Price Trend Analysis 2025 & 2033
- Figure 70: Asia Pacific Cotton Industry Volume Share (%), by Price Trend Analysis 2025 & 2033
- Figure 71: Asia Pacific Cotton Industry Revenue (Million), by Country 2025 & 2033
- Figure 72: Asia Pacific Cotton Industry Volume (Kiloton), by Country 2025 & 2033
- Figure 73: Asia Pacific Cotton Industry Revenue Share (%), by Country 2025 & 2033
- Figure 74: Asia Pacific Cotton Industry Volume Share (%), by Country 2025 & 2033
- Figure 75: South America Cotton Industry Revenue (Million), by Production Analysis 2025 & 2033
- Figure 76: South America Cotton Industry Volume (Kiloton), by Production Analysis 2025 & 2033
- Figure 77: South America Cotton Industry Revenue Share (%), by Production Analysis 2025 & 2033
- Figure 78: South America Cotton Industry Volume Share (%), by Production Analysis 2025 & 2033
- Figure 79: South America Cotton Industry Revenue (Million), by Consumption Analysis 2025 & 2033
- Figure 80: South America Cotton Industry Volume (Kiloton), by Consumption Analysis 2025 & 2033
- Figure 81: South America Cotton Industry Revenue Share (%), by Consumption Analysis 2025 & 2033
- Figure 82: South America Cotton Industry Volume Share (%), by Consumption Analysis 2025 & 2033
- Figure 83: South America Cotton Industry Revenue (Million), by Import Market Analysis (Value & Volume) 2025 & 2033
- Figure 84: South America Cotton Industry Volume (Kiloton), by Import Market Analysis (Value & Volume) 2025 & 2033
- Figure 85: South America Cotton Industry Revenue Share (%), by Import Market Analysis (Value & Volume) 2025 & 2033
- Figure 86: South America Cotton Industry Volume Share (%), by Import Market Analysis (Value & Volume) 2025 & 2033
- Figure 87: South America Cotton Industry Revenue (Million), by Export Market Analysis (Value & Volume) 2025 & 2033
- Figure 88: South America Cotton Industry Volume (Kiloton), by Export Market Analysis (Value & Volume) 2025 & 2033
- Figure 89: South America Cotton Industry Revenue Share (%), by Export Market Analysis (Value & Volume) 2025 & 2033
- Figure 90: South America Cotton Industry Volume Share (%), by Export Market Analysis (Value & Volume) 2025 & 2033
- Figure 91: South America Cotton Industry Revenue (Million), by Price Trend Analysis 2025 & 2033
- Figure 92: South America Cotton Industry Volume (Kiloton), by Price Trend Analysis 2025 & 2033
- Figure 93: South America Cotton Industry Revenue Share (%), by Price Trend Analysis 2025 & 2033
- Figure 94: South America Cotton Industry Volume Share (%), by Price Trend Analysis 2025 & 2033
- Figure 95: South America Cotton Industry Revenue (Million), by Country 2025 & 2033
- Figure 96: South America Cotton Industry Volume (Kiloton), by Country 2025 & 2033
- Figure 97: South America Cotton Industry Revenue Share (%), by Country 2025 & 2033
- Figure 98: South America Cotton Industry Volume Share (%), by Country 2025 & 2033
- Figure 99: Middle East Cotton Industry Revenue (Million), by Production Analysis 2025 & 2033
- Figure 100: Middle East Cotton Industry Volume (Kiloton), by Production Analysis 2025 & 2033
- Figure 101: Middle East Cotton Industry Revenue Share (%), by Production Analysis 2025 & 2033
- Figure 102: Middle East Cotton Industry Volume Share (%), by Production Analysis 2025 & 2033
- Figure 103: Middle East Cotton Industry Revenue (Million), by Consumption Analysis 2025 & 2033
- Figure 104: Middle East Cotton Industry Volume (Kiloton), by Consumption Analysis 2025 & 2033
- Figure 105: Middle East Cotton Industry Revenue Share (%), by Consumption Analysis 2025 & 2033
- Figure 106: Middle East Cotton Industry Volume Share (%), by Consumption Analysis 2025 & 2033
- Figure 107: Middle East Cotton Industry Revenue (Million), by Import Market Analysis (Value & Volume) 2025 & 2033
- Figure 108: Middle East Cotton Industry Volume (Kiloton), by Import Market Analysis (Value & Volume) 2025 & 2033
- Figure 109: Middle East Cotton Industry Revenue Share (%), by Import Market Analysis (Value & Volume) 2025 & 2033
- Figure 110: Middle East Cotton Industry Volume Share (%), by Import Market Analysis (Value & Volume) 2025 & 2033
- Figure 111: Middle East Cotton Industry Revenue (Million), by Export Market Analysis (Value & Volume) 2025 & 2033
- Figure 112: Middle East Cotton Industry Volume (Kiloton), by Export Market Analysis (Value & Volume) 2025 & 2033
- Figure 113: Middle East Cotton Industry Revenue Share (%), by Export Market Analysis (Value & Volume) 2025 & 2033
- Figure 114: Middle East Cotton Industry Volume Share (%), by Export Market Analysis (Value & Volume) 2025 & 2033
- Figure 115: Middle East Cotton Industry Revenue (Million), by Price Trend Analysis 2025 & 2033
- Figure 116: Middle East Cotton Industry Volume (Kiloton), by Price Trend Analysis 2025 & 2033
- Figure 117: Middle East Cotton Industry Revenue Share (%), by Price Trend Analysis 2025 & 2033
- Figure 118: Middle East Cotton Industry Volume Share (%), by Price Trend Analysis 2025 & 2033
- Figure 119: Middle East Cotton Industry Revenue (Million), by Country 2025 & 2033
- Figure 120: Middle East Cotton Industry Volume (Kiloton), by Country 2025 & 2033
- Figure 121: Middle East Cotton Industry Revenue Share (%), by Country 2025 & 2033
- Figure 122: Middle East Cotton Industry Volume Share (%), by Country 2025 & 2033
- Figure 123: South Africa Cotton Industry Revenue (Million), by Production Analysis 2025 & 2033
- Figure 124: South Africa Cotton Industry Volume (Kiloton), by Production Analysis 2025 & 2033
- Figure 125: South Africa Cotton Industry Revenue Share (%), by Production Analysis 2025 & 2033
- Figure 126: South Africa Cotton Industry Volume Share (%), by Production Analysis 2025 & 2033
- Figure 127: South Africa Cotton Industry Revenue (Million), by Consumption Analysis 2025 & 2033
- Figure 128: South Africa Cotton Industry Volume (Kiloton), by Consumption Analysis 2025 & 2033
- Figure 129: South Africa Cotton Industry Revenue Share (%), by Consumption Analysis 2025 & 2033
- Figure 130: South Africa Cotton Industry Volume Share (%), by Consumption Analysis 2025 & 2033
- Figure 131: South Africa Cotton Industry Revenue (Million), by Import Market Analysis (Value & Volume) 2025 & 2033
- Figure 132: South Africa Cotton Industry Volume (Kiloton), by Import Market Analysis (Value & Volume) 2025 & 2033
- Figure 133: South Africa Cotton Industry Revenue Share (%), by Import Market Analysis (Value & Volume) 2025 & 2033
- Figure 134: South Africa Cotton Industry Volume Share (%), by Import Market Analysis (Value & Volume) 2025 & 2033
- Figure 135: South Africa Cotton Industry Revenue (Million), by Export Market Analysis (Value & Volume) 2025 & 2033
- Figure 136: South Africa Cotton Industry Volume (Kiloton), by Export Market Analysis (Value & Volume) 2025 & 2033
- Figure 137: South Africa Cotton Industry Revenue Share (%), by Export Market Analysis (Value & Volume) 2025 & 2033
- Figure 138: South Africa Cotton Industry Volume Share (%), by Export Market Analysis (Value & Volume) 2025 & 2033
- Figure 139: South Africa Cotton Industry Revenue (Million), by Price Trend Analysis 2025 & 2033
- Figure 140: South Africa Cotton Industry Volume (Kiloton), by Price Trend Analysis 2025 & 2033
- Figure 141: South Africa Cotton Industry Revenue Share (%), by Price Trend Analysis 2025 & 2033
- Figure 142: South Africa Cotton Industry Volume Share (%), by Price Trend Analysis 2025 & 2033
- Figure 143: South Africa Cotton Industry Revenue (Million), by Country 2025 & 2033
- Figure 144: South Africa Cotton Industry Volume (Kiloton), by Country 2025 & 2033
- Figure 145: South Africa Cotton Industry Revenue Share (%), by Country 2025 & 2033
- Figure 146: South Africa Cotton Industry Volume Share (%), by Country 2025 & 2033
List of Tables
- Table 1: Global Cotton Industry Revenue Million Forecast, by Production Analysis 2020 & 2033
- Table 2: Global Cotton Industry Volume Kiloton Forecast, by Production Analysis 2020 & 2033
- Table 3: Global Cotton Industry Revenue Million Forecast, by Consumption Analysis 2020 & 2033
- Table 4: Global Cotton Industry Volume Kiloton Forecast, by Consumption Analysis 2020 & 2033
- Table 5: Global Cotton Industry Revenue Million Forecast, by Import Market Analysis (Value & Volume) 2020 & 2033
- Table 6: Global Cotton Industry Volume Kiloton Forecast, by Import Market Analysis (Value & Volume) 2020 & 2033
- Table 7: Global Cotton Industry Revenue Million Forecast, by Export Market Analysis (Value & Volume) 2020 & 2033
- Table 8: Global Cotton Industry Volume Kiloton Forecast, by Export Market Analysis (Value & Volume) 2020 & 2033
- Table 9: Global Cotton Industry Revenue Million Forecast, by Price Trend Analysis 2020 & 2033
- Table 10: Global Cotton Industry Volume Kiloton Forecast, by Price Trend Analysis 2020 & 2033
- Table 11: Global Cotton Industry Revenue Million Forecast, by Region 2020 & 2033
- Table 12: Global Cotton Industry Volume Kiloton Forecast, by Region 2020 & 2033
- Table 13: Global Cotton Industry Revenue Million Forecast, by Production Analysis 2020 & 2033
- Table 14: Global Cotton Industry Volume Kiloton Forecast, by Production Analysis 2020 & 2033
- Table 15: Global Cotton Industry Revenue Million Forecast, by Consumption Analysis 2020 & 2033
- Table 16: Global Cotton Industry Volume Kiloton Forecast, by Consumption Analysis 2020 & 2033
- Table 17: Global Cotton Industry Revenue Million Forecast, by Import Market Analysis (Value & Volume) 2020 & 2033
- Table 18: Global Cotton Industry Volume Kiloton Forecast, by Import Market Analysis (Value & Volume) 2020 & 2033
- Table 19: Global Cotton Industry Revenue Million Forecast, by Export Market Analysis (Value & Volume) 2020 & 2033
- Table 20: Global Cotton Industry Volume Kiloton Forecast, by Export Market Analysis (Value & Volume) 2020 & 2033
- Table 21: Global Cotton Industry Revenue Million Forecast, by Price Trend Analysis 2020 & 2033
- Table 22: Global Cotton Industry Volume Kiloton Forecast, by Price Trend Analysis 2020 & 2033
- Table 23: Global Cotton Industry Revenue Million Forecast, by Country 2020 & 2033
- Table 24: Global Cotton Industry Volume Kiloton Forecast, by Country 2020 & 2033
- Table 25: United States Cotton Industry Revenue (Million) Forecast, by Application 2020 & 2033
- Table 26: United States Cotton Industry Volume (Kiloton) Forecast, by Application 2020 & 2033
- Table 27: Canada Cotton Industry Revenue (Million) Forecast, by Application 2020 & 2033
- Table 28: Canada Cotton Industry Volume (Kiloton) Forecast, by Application 2020 & 2033
- Table 29: Mexico Cotton Industry Revenue (Million) Forecast, by Application 2020 & 2033
- Table 30: Mexico Cotton Industry Volume (Kiloton) Forecast, by Application 2020 & 2033
- Table 31: Global Cotton Industry Revenue Million Forecast, by Production Analysis 2020 & 2033
- Table 32: Global Cotton Industry Volume Kiloton Forecast, by Production Analysis 2020 & 2033
- Table 33: Global Cotton Industry Revenue Million Forecast, by Consumption Analysis 2020 & 2033
- Table 34: Global Cotton Industry Volume Kiloton Forecast, by Consumption Analysis 2020 & 2033
- Table 35: Global Cotton Industry Revenue Million Forecast, by Import Market Analysis (Value & Volume) 2020 & 2033
- Table 36: Global Cotton Industry Volume Kiloton Forecast, by Import Market Analysis (Value & Volume) 2020 & 2033
- Table 37: Global Cotton Industry Revenue Million Forecast, by Export Market Analysis (Value & Volume) 2020 & 2033
- Table 38: Global Cotton Industry Volume Kiloton Forecast, by Export Market Analysis (Value & Volume) 2020 & 2033
- Table 39: Global Cotton Industry Revenue Million Forecast, by Price Trend Analysis 2020 & 2033
- Table 40: Global Cotton Industry Volume Kiloton Forecast, by Price Trend Analysis 2020 & 2033
- Table 41: Global Cotton Industry Revenue Million Forecast, by Country 2020 & 2033
- Table 42: Global Cotton Industry Volume Kiloton Forecast, by Country 2020 & 2033
- Table 43: Germany Cotton Industry Revenue (Million) Forecast, by Application 2020 & 2033
- Table 44: Germany Cotton Industry Volume (Kiloton) Forecast, by Application 2020 & 2033
- Table 45: France Cotton Industry Revenue (Million) Forecast, by Application 2020 & 2033
- Table 46: France Cotton Industry Volume (Kiloton) Forecast, by Application 2020 & 2033
- Table 47: Russia Cotton Industry Revenue (Million) Forecast, by Application 2020 & 2033
- Table 48: Russia Cotton Industry Volume (Kiloton) Forecast, by Application 2020 & 2033
- Table 49: Greece Cotton Industry Revenue (Million) Forecast, by Application 2020 & 2033
- Table 50: Greece Cotton Industry Volume (Kiloton) Forecast, by Application 2020 & 2033
- Table 51: Italy Cotton Industry Revenue (Million) Forecast, by Application 2020 & 2033
- Table 52: Italy Cotton Industry Volume (Kiloton) Forecast, by Application 2020 & 2033
- Table 53: Global Cotton Industry Revenue Million Forecast, by Production Analysis 2020 & 2033
- Table 54: Global Cotton Industry Volume Kiloton Forecast, by Production Analysis 2020 & 2033
- Table 55: Global Cotton Industry Revenue Million Forecast, by Consumption Analysis 2020 & 2033
- Table 56: Global Cotton Industry Volume Kiloton Forecast, by Consumption Analysis 2020 & 2033
- Table 57: Global Cotton Industry Revenue Million Forecast, by Import Market Analysis (Value & Volume) 2020 & 2033
- Table 58: Global Cotton Industry Volume Kiloton Forecast, by Import Market Analysis (Value & Volume) 2020 & 2033
- Table 59: Global Cotton Industry Revenue Million Forecast, by Export Market Analysis (Value & Volume) 2020 & 2033
- Table 60: Global Cotton Industry Volume Kiloton Forecast, by Export Market Analysis (Value & Volume) 2020 & 2033
- Table 61: Global Cotton Industry Revenue Million Forecast, by Price Trend Analysis 2020 & 2033
- Table 62: Global Cotton Industry Volume Kiloton Forecast, by Price Trend Analysis 2020 & 2033
- Table 63: Global Cotton Industry Revenue Million Forecast, by Country 2020 & 2033
- Table 64: Global Cotton Industry Volume Kiloton Forecast, by Country 2020 & 2033
- Table 65: China Cotton Industry Revenue (Million) Forecast, by Application 2020 & 2033
- Table 66: China Cotton Industry Volume (Kiloton) Forecast, by Application 2020 & 2033
- Table 67: India Cotton Industry Revenue (Million) Forecast, by Application 2020 & 2033
- Table 68: India Cotton Industry Volume (Kiloton) Forecast, by Application 2020 & 2033
- Table 69: Australia Cotton Industry Revenue (Million) Forecast, by Application 2020 & 2033
- Table 70: Australia Cotton Industry Volume (Kiloton) Forecast, by Application 2020 & 2033
- Table 71: Pakistan Cotton Industry Revenue (Million) Forecast, by Application 2020 & 2033
- Table 72: Pakistan Cotton Industry Volume (Kiloton) Forecast, by Application 2020 & 2033
- Table 73: Bangladesh Cotton Industry Revenue (Million) Forecast, by Application 2020 & 2033
- Table 74: Bangladesh Cotton Industry Volume (Kiloton) Forecast, by Application 2020 & 2033
- Table 75: Global Cotton Industry Revenue Million Forecast, by Production Analysis 2020 & 2033
- Table 76: Global Cotton Industry Volume Kiloton Forecast, by Production Analysis 2020 & 2033
- Table 77: Global Cotton Industry Revenue Million Forecast, by Consumption Analysis 2020 & 2033
- Table 78: Global Cotton Industry Volume Kiloton Forecast, by Consumption Analysis 2020 & 2033
- Table 79: Global Cotton Industry Revenue Million Forecast, by Import Market Analysis (Value & Volume) 2020 & 2033
- Table 80: Global Cotton Industry Volume Kiloton Forecast, by Import Market Analysis (Value & Volume) 2020 & 2033
- Table 81: Global Cotton Industry Revenue Million Forecast, by Export Market Analysis (Value & Volume) 2020 & 2033
- Table 82: Global Cotton Industry Volume Kiloton Forecast, by Export Market Analysis (Value & Volume) 2020 & 2033
- Table 83: Global Cotton Industry Revenue Million Forecast, by Price Trend Analysis 2020 & 2033
- Table 84: Global Cotton Industry Volume Kiloton Forecast, by Price Trend Analysis 2020 & 2033
- Table 85: Global Cotton Industry Revenue Million Forecast, by Country 2020 & 2033
- Table 86: Global Cotton Industry Volume Kiloton Forecast, by Country 2020 & 2033
- Table 87: Brazil Cotton Industry Revenue (Million) Forecast, by Application 2020 & 2033
- Table 88: Brazil Cotton Industry Volume (Kiloton) Forecast, by Application 2020 & 2033
- Table 89: Argentina Cotton Industry Revenue (Million) Forecast, by Application 2020 & 2033
- Table 90: Argentina Cotton Industry Volume (Kiloton) Forecast, by Application 2020 & 2033
- Table 91: Global Cotton Industry Revenue Million Forecast, by Production Analysis 2020 & 2033
- Table 92: Global Cotton Industry Volume Kiloton Forecast, by Production Analysis 2020 & 2033
- Table 93: Global Cotton Industry Revenue Million Forecast, by Consumption Analysis 2020 & 2033
- Table 94: Global Cotton Industry Volume Kiloton Forecast, by Consumption Analysis 2020 & 2033
- Table 95: Global Cotton Industry Revenue Million Forecast, by Import Market Analysis (Value & Volume) 2020 & 2033
- Table 96: Global Cotton Industry Volume Kiloton Forecast, by Import Market Analysis (Value & Volume) 2020 & 2033
- Table 97: Global Cotton Industry Revenue Million Forecast, by Export Market Analysis (Value & Volume) 2020 & 2033
- Table 98: Global Cotton Industry Volume Kiloton Forecast, by Export Market Analysis (Value & Volume) 2020 & 2033
- Table 99: Global Cotton Industry Revenue Million Forecast, by Price Trend Analysis 2020 & 2033
- Table 100: Global Cotton Industry Volume Kiloton Forecast, by Price Trend Analysis 2020 & 2033
- Table 101: Global Cotton Industry Revenue Million Forecast, by Country 2020 & 2033
- Table 102: Global Cotton Industry Volume Kiloton Forecast, by Country 2020 & 2033
- Table 103: Global Cotton Industry Revenue Million Forecast, by Production Analysis 2020 & 2033
- Table 104: Global Cotton Industry Volume Kiloton Forecast, by Production Analysis 2020 & 2033
- Table 105: Global Cotton Industry Revenue Million Forecast, by Consumption Analysis 2020 & 2033
- Table 106: Global Cotton Industry Volume Kiloton Forecast, by Consumption Analysis 2020 & 2033
- Table 107: Global Cotton Industry Revenue Million Forecast, by Import Market Analysis (Value & Volume) 2020 & 2033
- Table 108: Global Cotton Industry Volume Kiloton Forecast, by Import Market Analysis (Value & Volume) 2020 & 2033
- Table 109: Global Cotton Industry Revenue Million Forecast, by Export Market Analysis (Value & Volume) 2020 & 2033
- Table 110: Global Cotton Industry Volume Kiloton Forecast, by Export Market Analysis (Value & Volume) 2020 & 2033
- Table 111: Global Cotton Industry Revenue Million Forecast, by Price Trend Analysis 2020 & 2033
- Table 112: Global Cotton Industry Volume Kiloton Forecast, by Price Trend Analysis 2020 & 2033
- Table 113: Global Cotton Industry Revenue Million Forecast, by Country 2020 & 2033
- Table 114: Global Cotton Industry Volume Kiloton Forecast, by Country 2020 & 2033
- Table 115: Turkey Cotton Industry Revenue (Million) Forecast, by Application 2020 & 2033
- Table 116: Turkey Cotton Industry Volume (Kiloton) Forecast, by Application 2020 & 2033
- Table 117: Egypt Cotton Industry Revenue (Million) Forecast, by Application 2020 & 2033
- Table 118: Egypt Cotton Industry Volume (Kiloton) Forecast, by Application 2020 & 2033
Frequently Asked Questions
1. What is the projected Compound Annual Growth Rate (CAGR) of the Cotton Industry?
The projected CAGR is approximately 2.70%.
2. Which companies are prominent players in the Cotton Industry?
Key companies in the market include Monsanto, National Cotton Council of America, Syngenta , The Texas Cotton Association, Cotton Incorporated , International Cotton Association , Bayer CropScience .
3. What are the main segments of the Cotton Industry?
The market segments include Production Analysis, Consumption Analysis, Import Market Analysis (Value & Volume), Export Market Analysis (Value & Volume), Price Trend Analysis.
4. Can you provide details about the market size?
The market size is estimated to be USD 43.96 Million as of 2022.
5. What are some drivers contributing to market growth?
Rising Demand for Milled and Broken Rice; Growing Preference for Speciality Rice Variety; Government Initiatives Supports Rice Production.
6. What are the notable trends driving market growth?
Increasing demand for the cotton exports.
7. Are there any restraints impacting market growth?
Lack of Supply Chain for Rice; Growing Agricultural Labor Crisis.
8. Can you provide examples of recent developments in the market?
September 2022: The two first-ever new organic cotton varieties have been made available to farmers in India. These varieties were developed through a decentralized organic participatory breeding program of FiBL Switzerland and their partners.
9. What pricing options are available for accessing the report?
Pricing options include single-user, multi-user, and enterprise licenses priced at USD 4750, USD 5250, and USD 8750 respectively.
10. Is the market size provided in terms of value or volume?
The market size is provided in terms of value, measured in Million and volume, measured in Kiloton.
11. Are there any specific market keywords associated with the report?
Yes, the market keyword associated with the report is "Cotton Industry," which aids in identifying and referencing the specific market segment covered.
12. How do I determine which pricing option suits my needs best?
The pricing options vary based on user requirements and access needs. Individual users may opt for single-user licenses, while businesses requiring broader access may choose multi-user or enterprise licenses for cost-effective access to the report.
13. Are there any additional resources or data provided in the Cotton Industry report?
While the report offers comprehensive insights, it's advisable to review the specific contents or supplementary materials provided to ascertain if additional resources or data are available.
14. How can I stay updated on further developments or reports in the Cotton Industry?
To stay informed about further developments, trends, and reports in the Cotton Industry, consider subscribing to industry newsletters, following relevant companies and organizations, or regularly checking reputable industry news sources and publications.
Methodology
Step 1 - Identification of Relevant Samples Size from Population Database


Step 2 - Approaches for Defining Global Market Size (Value, Volume* & Price*)

Note*: In applicable scenarios
Step 3 - Data Sources
Primary Research
- Web Analytics
- Survey Reports
- Research Institute
- Latest Research Reports
- Opinion Leaders
Secondary Research
- Annual Reports
- White Paper
- Latest Press Release
- Industry Association
- Paid Database
- Investor Presentations

Step 4 - Data Triangulation
Involves using different sources of information in order to increase the validity of a study
These sources are likely to be stakeholders in a program - participants, other researchers, program staff, other community members, and so on.
Then we put all data in single framework & apply various statistical tools to find out the dynamic on the market.
During the analysis stage, feedback from the stakeholder groups would be compared to determine areas of agreement as well as areas of divergence