

Key Insights
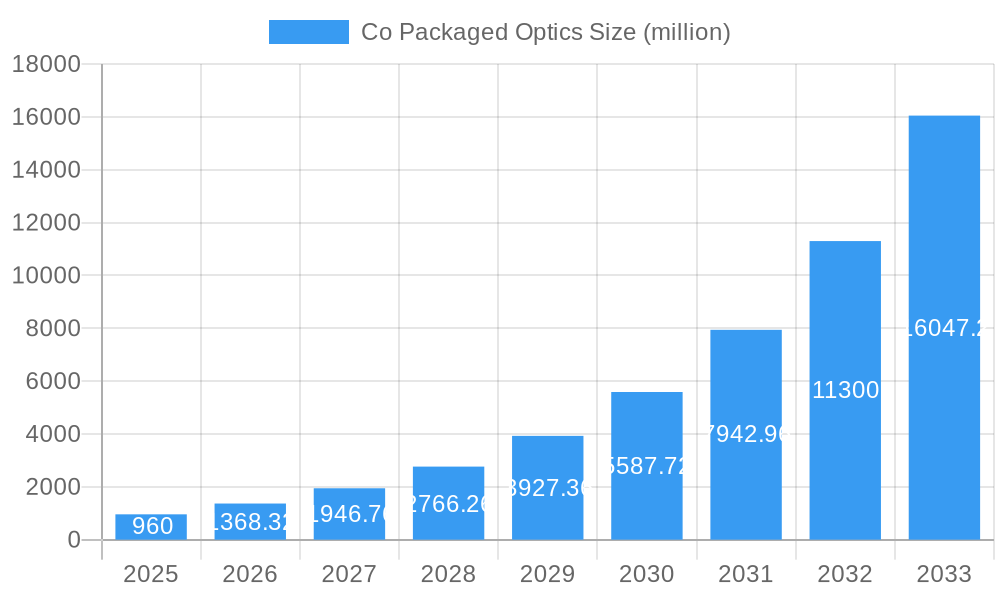
The Co-Packaged Optics (CPO) market is experiencing explosive growth, projected to reach $960 million in 2025 and exhibiting a remarkable Compound Annual Growth Rate (CAGR) of 42.9% from 2025 to 2033. This rapid expansion is driven by the increasing demand for higher bandwidth and lower power consumption in data centers, fueled by the proliferation of cloud computing, artificial intelligence, and high-performance computing applications. Key market drivers include the need for improved system-level efficiency, reduced latency, and simplified system design. Technological advancements in silicon photonics and advanced packaging techniques are further accelerating market growth. Major players like Broadcom, NVIDIA, Cisco, Ranovus, Intel, and Marvell Technology are heavily investing in R&D and strategic partnerships to capitalize on this burgeoning market opportunity. While the market faces some challenges related to initial higher costs and the complexities of integrating CPO technology, the long-term benefits in terms of performance and cost-effectiveness are expected to outweigh these hurdles.
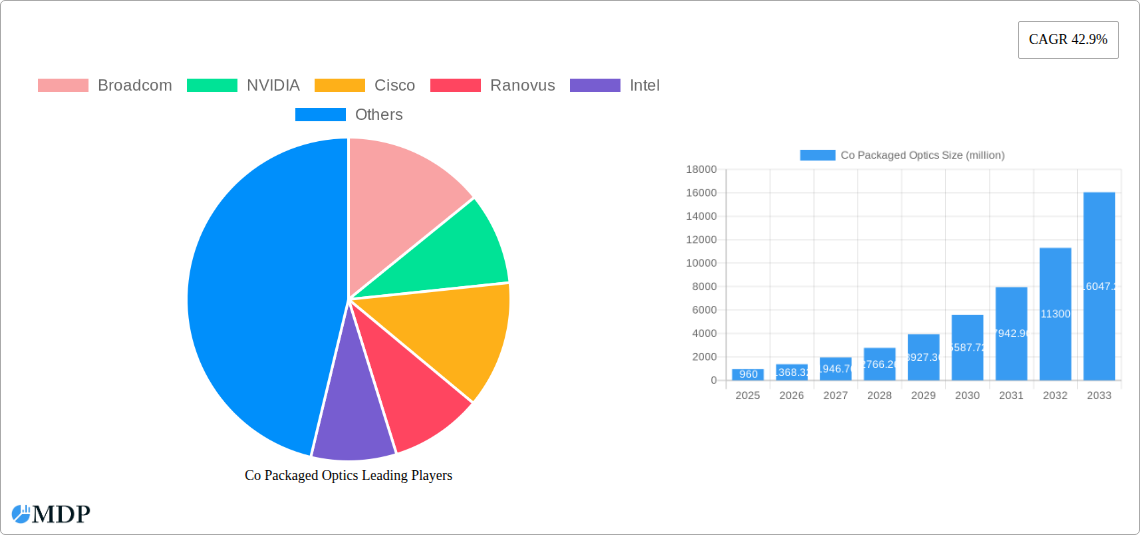
Co Packaged Optics Market Size (In Million)
The forecast period (2025-2033) promises even more significant growth as the industry transitions towards more sophisticated CPO solutions. Factors like increasing adoption of 400G and 800G optical transceivers, coupled with the anticipated emergence of 1.6T and beyond, will significantly contribute to the market expansion. Regional market penetration will likely see substantial growth in North America and Asia-Pacific, driven by strong demand from hyperscale data centers and telecommunication companies. Competitive landscape is highly dynamic with ongoing innovation and mergers and acquisitions expected to shape the market landscape in the coming years. The continuous advancement in miniaturization, integration, and cost reduction will play a crucial role in determining market dominance in the future.
Co Packaged Optics Company Market Share
Unlocking Explosive Growth: The Definitive Co-Packaged Optics Market Report (2019-2033)
This comprehensive report provides an in-depth analysis of the burgeoning Co-Packaged Optics market, projecting a multi-million-dollar valuation by 2033. Leveraging rigorous data analysis and expert insights, this report is an invaluable resource for industry stakeholders, investors, and strategic planners seeking to navigate this rapidly evolving landscape. The study period covers 2019-2033, with a base year of 2025 and a forecast period of 2025-2033. Key players like Broadcom, NVIDIA, Cisco, Ranovus, Intel, and Marvell Technology are analyzed for their market positioning and future strategies.
Co Packaged Optics Market Dynamics & Concentration
The Co-Packaged Optics market is experiencing significant consolidation, driven by intense competition and the need for economies of scale. Market concentration is increasing, with the top 5 players holding an estimated xx% market share in 2025. Innovation is a key driver, with companies investing millions in R&D to develop higher-bandwidth, lower-latency solutions. Regulatory frameworks, while generally supportive of technological advancement, are also evolving, posing some challenges for market participants. The market witnesses increasing product substitution with newer technologies emerging frequently impacting the overall market dynamics. End-user trends towards higher data rates and lower power consumption are fueling market growth. M&A activity has been substantial, with an estimated xx deals closed between 2019 and 2024.
- Market Share (2025): Top 5 players – xx%
- M&A Deals (2019-2024): xx
- Key Innovation Drivers: Higher bandwidth, lower latency, reduced power consumption.
- Regulatory Landscape: Evolving, posing both opportunities and challenges.
Co Packaged Optics Industry Trends & Analysis
The Co-Packaged Optics market is projected to witness a CAGR of xx% during the forecast period (2025-2033), driven by the exponential growth in data traffic. Technological disruptions, such as the adoption of silicon photonics and advanced packaging techniques, are accelerating market penetration. Consumer preferences are shifting towards high-performance, energy-efficient solutions, impacting product design and market segmentation. Competitive dynamics are intense, with companies focusing on innovation, strategic partnerships, and aggressive pricing strategies. The market penetration of Co-Packaged Optics is expected to reach xx% by 2033, up from xx% in 2025.
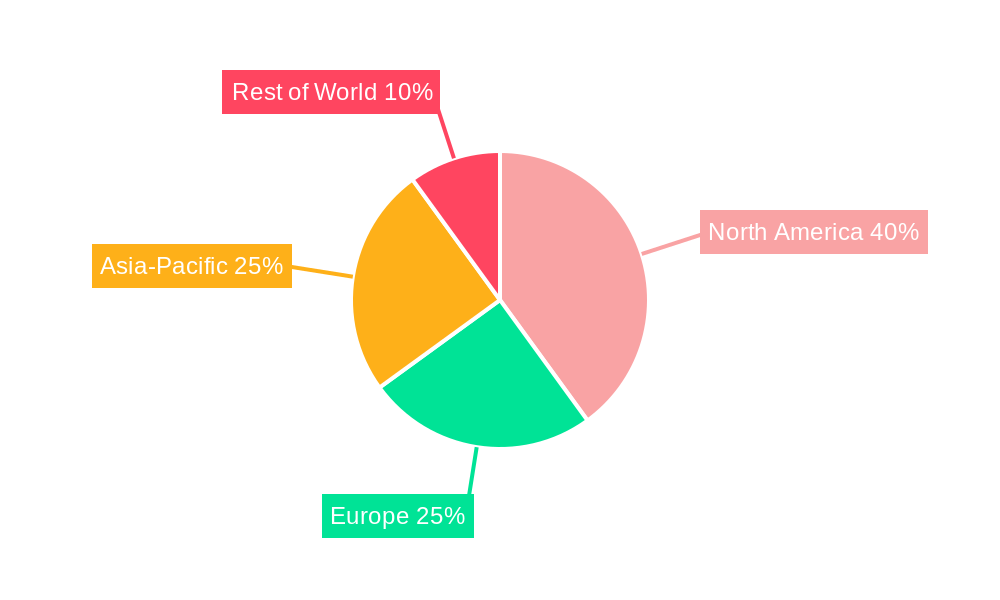
Leading Markets & Segments in Co Packaged Optics
The North American market currently holds the dominant position in the global Co-Packaged Optics market, fueled by robust technological advancements, significant investments in data center infrastructure, and favorable regulatory policies.
- Key Drivers in North America:
- Strong government support for technological innovation.
- High density of data centers and cloud service providers.
- Significant investments in 5G and other high-bandwidth infrastructure.
The dominance of North America is expected to continue through 2033 although significant growth is anticipated in the Asia-Pacific region driven by the expansion of 5G networks and rising digital adoption. Further regional analysis will provide granularity in market segmentation highlighting diverse growth drivers and market maturity across distinct geographical locations.
Co Packaged Optics Product Developments
Recent advancements in silicon photonics, integrated circuits, and advanced packaging techniques have led to significant improvements in co-packaged optics. These innovations have enabled the development of higher-bandwidth, lower-power, and more cost-effective solutions. The integration of these technologies into various applications, ranging from data centers and high-performance computing to telecommunications, is driving market growth and enhancing competitive advantages.
Key Drivers of Co Packaged Optics Growth
The explosive growth of the Co-Packaged Optics market is propelled by several key factors. Technological advancements in silicon photonics are enabling higher data rates and lower power consumption. The burgeoning demand for higher bandwidth in data centers and 5G networks fuels market expansion. Favorable government policies and investments in high-speed infrastructure further accelerate growth.
Challenges in the Co Packaged Optics Market
Despite significant growth potential, the Co-Packaged Optics market faces several challenges. Supply chain disruptions can lead to production delays and increased costs, impacting profitability. Intense competition, especially from established players, can squeeze margins. Moreover, achieving economies of scale in the production of these complex components presents a significant hurdle for some companies. The impact of these factors on the market is estimated to be a xx% reduction in growth in 2026.
Emerging Opportunities in Co Packaged Optics
The long-term growth of the Co-Packaged Optics market is driven by several promising opportunities. Technological breakthroughs in advanced packaging and integration hold the key to improving performance and reducing costs. Strategic partnerships between component manufacturers and system integrators will open new market segments. Expansion into emerging markets like the Asia-Pacific region presents significant growth potential.
Leading Players in the Co Packaged Optics Sector
- Broadcom
- NVIDIA
- Cisco
- Ranovus
- Intel
- Marvell Technology
Key Milestones in Co Packaged Optics Industry
- 2020: Introduction of xx technology by Broadcom, significantly increasing data transmission rates.
- 2022: Strategic partnership between NVIDIA and Cisco to develop co-packaged optics for high-performance computing.
- 2023: Acquisition of xx company by Intel, expanding its portfolio of co-packaged optics solutions.
- 2024: Ranovus launches new high-speed co-packaged optics with xx improvements in performance.
Strategic Outlook for Co Packaged Optics Market
The Co-Packaged Optics market is poised for continued expansion, driven by the relentless demand for higher bandwidth and lower latency. Strategic investments in R&D, strategic partnerships, and expansion into new markets will be critical for success in this dynamic market. The market is expected to reach a valuation exceeding several million dollars by 2033.
Co Packaged Optics Segmentation
-
1. Application
- 1.1. Data Center and HPC
- 1.2. Telecommunication and Networking
-
2. Type
- 2.1. Less than 1.6 T
- 2.2. 1.6 to 3.2 T
- 2.3. More than 3.2 T
Co Packaged Optics Segmentation By Geography
-
1. North America
- 1.1. United States
- 1.2. Canada
- 1.3. Mexico
-
2. South America
- 2.1. Brazil
- 2.2. Argentina
- 2.3. Rest of South America
-
3. Europe
- 3.1. United Kingdom
- 3.2. Germany
- 3.3. France
- 3.4. Italy
- 3.5. Spain
- 3.6. Russia
- 3.7. Benelux
- 3.8. Nordics
- 3.9. Rest of Europe
-
4. Middle East & Africa
- 4.1. Turkey
- 4.2. Israel
- 4.3. GCC
- 4.4. North Africa
- 4.5. South Africa
- 4.6. Rest of Middle East & Africa
-
5. Asia Pacific
- 5.1. China
- 5.2. India
- 5.3. Japan
- 5.4. South Korea
- 5.5. ASEAN
- 5.6. Oceania
- 5.7. Rest of Asia Pacific
Co Packaged Optics Regional Market Share
Geographic Coverage of Co Packaged Optics
Co Packaged Optics REPORT HIGHLIGHTS
| Aspects | Details |
|---|---|
| Study Period | 2020-2034 |
| Base Year | 2025 |
| Estimated Year | 2026 |
| Forecast Period | 2026-2034 |
| Historical Period | 2020-2025 |
| Growth Rate | CAGR of 42.9% from 2020-2034 |
| Segmentation |
|
Table of Contents
- 1. Introduction
- 1.1. Research Scope
- 1.2. Market Segmentation
- 1.3. Research Objective
- 1.4. Definitions and Assumptions
- 2. Executive Summary
- 2.1. Market Snapshot
- 3. Market Dynamics
- 3.1. Market Drivers
- 3.2. Market Restrains
- 3.3. Market Trends
- 3.4. Market Opportunities
- 4. Market Factor Analysis
- 4.1. Porters Five Forces
- 4.1.1. Bargaining Power of Suppliers
- 4.1.2. Bargaining Power of Buyers
- 4.1.3. Threat of New Entrants
- 4.1.4. Threat of Substitutes
- 4.1.5. Competitive Rivalry
- 4.2. PESTEL analysis
- 4.3. BCG Analysis
- 4.3.1. Stars (High Growth, High Market Share)
- 4.3.2. Cash Cows (Low Growth, High Market Share)
- 4.3.3. Question Mark (High Growth, Low Market Share)
- 4.3.4. Dogs (Low Growth, Low Market Share)
- 4.4. Ansoff Matrix Analysis
- 4.5. Supply Chain Analysis
- 4.6. Regulatory Landscape
- 4.7. Current Market Potential and Opportunity Assessment (TAM–SAM–SOM Framework)
- 4.8. MDP Analyst Note
- 4.1. Porters Five Forces
- 5. Market Analysis, Insights and Forecast 2021-2033
- 5.1. Market Analysis, Insights and Forecast - by Application
- 5.1.1. Data Center and HPC
- 5.1.2. Telecommunication and Networking
- 5.2. Market Analysis, Insights and Forecast - by Type
- 5.2.1. Less than 1.6 T
- 5.2.2. 1.6 to 3.2 T
- 5.2.3. More than 3.2 T
- 5.3. Market Analysis, Insights and Forecast - by Region
- 5.3.1. North America
- 5.3.2. South America
- 5.3.3. Europe
- 5.3.4. Middle East & Africa
- 5.3.5. Asia Pacific
- 5.1. Market Analysis, Insights and Forecast - by Application
- 6. Global Co Packaged Optics Analysis, Insights and Forecast, 2021-2033
- 6.1. Market Analysis, Insights and Forecast - by Application
- 6.1.1. Data Center and HPC
- 6.1.2. Telecommunication and Networking
- 6.2. Market Analysis, Insights and Forecast - by Type
- 6.2.1. Less than 1.6 T
- 6.2.2. 1.6 to 3.2 T
- 6.2.3. More than 3.2 T
- 6.1. Market Analysis, Insights and Forecast - by Application
- 7. North America Co Packaged Optics Analysis, Insights and Forecast, 2020-2032
- 7.1. Market Analysis, Insights and Forecast - by Application
- 7.1.1. Data Center and HPC
- 7.1.2. Telecommunication and Networking
- 7.2. Market Analysis, Insights and Forecast - by Type
- 7.2.1. Less than 1.6 T
- 7.2.2. 1.6 to 3.2 T
- 7.2.3. More than 3.2 T
- 7.1. Market Analysis, Insights and Forecast - by Application
- 8. South America Co Packaged Optics Analysis, Insights and Forecast, 2020-2032
- 8.1. Market Analysis, Insights and Forecast - by Application
- 8.1.1. Data Center and HPC
- 8.1.2. Telecommunication and Networking
- 8.2. Market Analysis, Insights and Forecast - by Type
- 8.2.1. Less than 1.6 T
- 8.2.2. 1.6 to 3.2 T
- 8.2.3. More than 3.2 T
- 8.1. Market Analysis, Insights and Forecast - by Application
- 9. Europe Co Packaged Optics Analysis, Insights and Forecast, 2020-2032
- 9.1. Market Analysis, Insights and Forecast - by Application
- 9.1.1. Data Center and HPC
- 9.1.2. Telecommunication and Networking
- 9.2. Market Analysis, Insights and Forecast - by Type
- 9.2.1. Less than 1.6 T
- 9.2.2. 1.6 to 3.2 T
- 9.2.3. More than 3.2 T
- 9.1. Market Analysis, Insights and Forecast - by Application
- 10. Middle East & Africa Co Packaged Optics Analysis, Insights and Forecast, 2020-2032
- 10.1. Market Analysis, Insights and Forecast - by Application
- 10.1.1. Data Center and HPC
- 10.1.2. Telecommunication and Networking
- 10.2. Market Analysis, Insights and Forecast - by Type
- 10.2.1. Less than 1.6 T
- 10.2.2. 1.6 to 3.2 T
- 10.2.3. More than 3.2 T
- 10.1. Market Analysis, Insights and Forecast - by Application
- 11. Asia Pacific Co Packaged Optics Analysis, Insights and Forecast, 2020-2032
- 11.1. Market Analysis, Insights and Forecast - by Application
- 11.1.1. Data Center and HPC
- 11.1.2. Telecommunication and Networking
- 11.2. Market Analysis, Insights and Forecast - by Type
- 11.2.1. Less than 1.6 T
- 11.2.2. 1.6 to 3.2 T
- 11.2.3. More than 3.2 T
- 11.1. Market Analysis, Insights and Forecast - by Application
- 12. Competitive Analysis
- 12.1. Company Profiles
- 12.1.1 Broadcom
- 12.1.1.1. Company Overview
- 12.1.1.2. Products
- 12.1.1.3. Company Financials
- 12.1.1.4. SWOT Analysis
- 12.1.2 NVIDIA
- 12.1.2.1. Company Overview
- 12.1.2.2. Products
- 12.1.2.3. Company Financials
- 12.1.2.4. SWOT Analysis
- 12.1.3 Cisco
- 12.1.3.1. Company Overview
- 12.1.3.2. Products
- 12.1.3.3. Company Financials
- 12.1.3.4. SWOT Analysis
- 12.1.4 Ranovus
- 12.1.4.1. Company Overview
- 12.1.4.2. Products
- 12.1.4.3. Company Financials
- 12.1.4.4. SWOT Analysis
- 12.1.5 Intel
- 12.1.5.1. Company Overview
- 12.1.5.2. Products
- 12.1.5.3. Company Financials
- 12.1.5.4. SWOT Analysis
- 12.1.6 Marvell Technology
- 12.1.6.1. Company Overview
- 12.1.6.2. Products
- 12.1.6.3. Company Financials
- 12.1.6.4. SWOT Analysis
- 12.1.1 Broadcom
- 12.2. Market Entropy
- 12.2.1 Company's Key Areas Served
- 12.2.2 Recent Developments
- 12.3. Company Market Share Analysis 2025
- 12.3.1 Top 5 Companies Market Share Analysis
- 12.3.2 Top 3 Companies Market Share Analysis
- 12.4. List of Potential Customers
- 13. Research Methodology
List of Figures
- Figure 1: Global Co Packaged Optics Revenue Breakdown (million, %) by Region 2025 & 2033
- Figure 2: North America Co Packaged Optics Revenue (million), by Application 2025 & 2033
- Figure 3: North America Co Packaged Optics Revenue Share (%), by Application 2025 & 2033
- Figure 4: North America Co Packaged Optics Revenue (million), by Type 2025 & 2033
- Figure 5: North America Co Packaged Optics Revenue Share (%), by Type 2025 & 2033
- Figure 6: North America Co Packaged Optics Revenue (million), by Country 2025 & 2033
- Figure 7: North America Co Packaged Optics Revenue Share (%), by Country 2025 & 2033
- Figure 8: South America Co Packaged Optics Revenue (million), by Application 2025 & 2033
- Figure 9: South America Co Packaged Optics Revenue Share (%), by Application 2025 & 2033
- Figure 10: South America Co Packaged Optics Revenue (million), by Type 2025 & 2033
- Figure 11: South America Co Packaged Optics Revenue Share (%), by Type 2025 & 2033
- Figure 12: South America Co Packaged Optics Revenue (million), by Country 2025 & 2033
- Figure 13: South America Co Packaged Optics Revenue Share (%), by Country 2025 & 2033
- Figure 14: Europe Co Packaged Optics Revenue (million), by Application 2025 & 2033
- Figure 15: Europe Co Packaged Optics Revenue Share (%), by Application 2025 & 2033
- Figure 16: Europe Co Packaged Optics Revenue (million), by Type 2025 & 2033
- Figure 17: Europe Co Packaged Optics Revenue Share (%), by Type 2025 & 2033
- Figure 18: Europe Co Packaged Optics Revenue (million), by Country 2025 & 2033
- Figure 19: Europe Co Packaged Optics Revenue Share (%), by Country 2025 & 2033
- Figure 20: Middle East & Africa Co Packaged Optics Revenue (million), by Application 2025 & 2033
- Figure 21: Middle East & Africa Co Packaged Optics Revenue Share (%), by Application 2025 & 2033
- Figure 22: Middle East & Africa Co Packaged Optics Revenue (million), by Type 2025 & 2033
- Figure 23: Middle East & Africa Co Packaged Optics Revenue Share (%), by Type 2025 & 2033
- Figure 24: Middle East & Africa Co Packaged Optics Revenue (million), by Country 2025 & 2033
- Figure 25: Middle East & Africa Co Packaged Optics Revenue Share (%), by Country 2025 & 2033
- Figure 26: Asia Pacific Co Packaged Optics Revenue (million), by Application 2025 & 2033
- Figure 27: Asia Pacific Co Packaged Optics Revenue Share (%), by Application 2025 & 2033
- Figure 28: Asia Pacific Co Packaged Optics Revenue (million), by Type 2025 & 2033
- Figure 29: Asia Pacific Co Packaged Optics Revenue Share (%), by Type 2025 & 2033
- Figure 30: Asia Pacific Co Packaged Optics Revenue (million), by Country 2025 & 2033
- Figure 31: Asia Pacific Co Packaged Optics Revenue Share (%), by Country 2025 & 2033
List of Tables
- Table 1: Global Co Packaged Optics Revenue million Forecast, by Application 2020 & 2033
- Table 2: Global Co Packaged Optics Revenue million Forecast, by Type 2020 & 2033
- Table 3: Global Co Packaged Optics Revenue million Forecast, by Region 2020 & 2033
- Table 4: Global Co Packaged Optics Revenue million Forecast, by Application 2020 & 2033
- Table 5: Global Co Packaged Optics Revenue million Forecast, by Type 2020 & 2033
- Table 6: Global Co Packaged Optics Revenue million Forecast, by Country 2020 & 2033
- Table 7: United States Co Packaged Optics Revenue (million) Forecast, by Application 2020 & 2033
- Table 8: Canada Co Packaged Optics Revenue (million) Forecast, by Application 2020 & 2033
- Table 9: Mexico Co Packaged Optics Revenue (million) Forecast, by Application 2020 & 2033
- Table 10: Global Co Packaged Optics Revenue million Forecast, by Application 2020 & 2033
- Table 11: Global Co Packaged Optics Revenue million Forecast, by Type 2020 & 2033
- Table 12: Global Co Packaged Optics Revenue million Forecast, by Country 2020 & 2033
- Table 13: Brazil Co Packaged Optics Revenue (million) Forecast, by Application 2020 & 2033
- Table 14: Argentina Co Packaged Optics Revenue (million) Forecast, by Application 2020 & 2033
- Table 15: Rest of South America Co Packaged Optics Revenue (million) Forecast, by Application 2020 & 2033
- Table 16: Global Co Packaged Optics Revenue million Forecast, by Application 2020 & 2033
- Table 17: Global Co Packaged Optics Revenue million Forecast, by Type 2020 & 2033
- Table 18: Global Co Packaged Optics Revenue million Forecast, by Country 2020 & 2033
- Table 19: United Kingdom Co Packaged Optics Revenue (million) Forecast, by Application 2020 & 2033
- Table 20: Germany Co Packaged Optics Revenue (million) Forecast, by Application 2020 & 2033
- Table 21: France Co Packaged Optics Revenue (million) Forecast, by Application 2020 & 2033
- Table 22: Italy Co Packaged Optics Revenue (million) Forecast, by Application 2020 & 2033
- Table 23: Spain Co Packaged Optics Revenue (million) Forecast, by Application 2020 & 2033
- Table 24: Russia Co Packaged Optics Revenue (million) Forecast, by Application 2020 & 2033
- Table 25: Benelux Co Packaged Optics Revenue (million) Forecast, by Application 2020 & 2033
- Table 26: Nordics Co Packaged Optics Revenue (million) Forecast, by Application 2020 & 2033
- Table 27: Rest of Europe Co Packaged Optics Revenue (million) Forecast, by Application 2020 & 2033
- Table 28: Global Co Packaged Optics Revenue million Forecast, by Application 2020 & 2033
- Table 29: Global Co Packaged Optics Revenue million Forecast, by Type 2020 & 2033
- Table 30: Global Co Packaged Optics Revenue million Forecast, by Country 2020 & 2033
- Table 31: Turkey Co Packaged Optics Revenue (million) Forecast, by Application 2020 & 2033
- Table 32: Israel Co Packaged Optics Revenue (million) Forecast, by Application 2020 & 2033
- Table 33: GCC Co Packaged Optics Revenue (million) Forecast, by Application 2020 & 2033
- Table 34: North Africa Co Packaged Optics Revenue (million) Forecast, by Application 2020 & 2033
- Table 35: South Africa Co Packaged Optics Revenue (million) Forecast, by Application 2020 & 2033
- Table 36: Rest of Middle East & Africa Co Packaged Optics Revenue (million) Forecast, by Application 2020 & 2033
- Table 37: Global Co Packaged Optics Revenue million Forecast, by Application 2020 & 2033
- Table 38: Global Co Packaged Optics Revenue million Forecast, by Type 2020 & 2033
- Table 39: Global Co Packaged Optics Revenue million Forecast, by Country 2020 & 2033
- Table 40: China Co Packaged Optics Revenue (million) Forecast, by Application 2020 & 2033
- Table 41: India Co Packaged Optics Revenue (million) Forecast, by Application 2020 & 2033
- Table 42: Japan Co Packaged Optics Revenue (million) Forecast, by Application 2020 & 2033
- Table 43: South Korea Co Packaged Optics Revenue (million) Forecast, by Application 2020 & 2033
- Table 44: ASEAN Co Packaged Optics Revenue (million) Forecast, by Application 2020 & 2033
- Table 45: Oceania Co Packaged Optics Revenue (million) Forecast, by Application 2020 & 2033
- Table 46: Rest of Asia Pacific Co Packaged Optics Revenue (million) Forecast, by Application 2020 & 2033
Frequently Asked Questions
1. What is the projected Compound Annual Growth Rate (CAGR) of the Co Packaged Optics?
The projected CAGR is approximately 42.9%.
2. Which companies are prominent players in the Co Packaged Optics?
Key companies in the market include Broadcom, NVIDIA, Cisco, Ranovus, Intel, Marvell Technology.
3. What are the main segments of the Co Packaged Optics?
The market segments include Application, Type.
4. Can you provide details about the market size?
The market size is estimated to be USD 960 million as of 2022.
5. What are some drivers contributing to market growth?
N/A
6. What are the notable trends driving market growth?
N/A
7. Are there any restraints impacting market growth?
N/A
8. Can you provide examples of recent developments in the market?
N/A
9. What pricing options are available for accessing the report?
Pricing options include single-user, multi-user, and enterprise licenses priced at USD 2900.00, USD 4350.00, and USD 5800.00 respectively.
10. Is the market size provided in terms of value or volume?
The market size is provided in terms of value, measured in million.
11. Are there any specific market keywords associated with the report?
Yes, the market keyword associated with the report is "Co Packaged Optics," which aids in identifying and referencing the specific market segment covered.
12. How do I determine which pricing option suits my needs best?
The pricing options vary based on user requirements and access needs. Individual users may opt for single-user licenses, while businesses requiring broader access may choose multi-user or enterprise licenses for cost-effective access to the report.
13. Are there any additional resources or data provided in the Co Packaged Optics report?
While the report offers comprehensive insights, it's advisable to review the specific contents or supplementary materials provided to ascertain if additional resources or data are available.
14. How can I stay updated on further developments or reports in the Co Packaged Optics?
To stay informed about further developments, trends, and reports in the Co Packaged Optics, consider subscribing to industry newsletters, following relevant companies and organizations, or regularly checking reputable industry news sources and publications.
Methodology
Step 1 - Identification of Relevant Samples Size from Population Database


Step 2 - Approaches for Defining Global Market Size (Value, Volume* & Price*)

Note*: In applicable scenarios
Step 3 - Data Sources
Primary Research
- Web Analytics
- Survey Reports
- Research Institute
- Latest Research Reports
- Opinion Leaders
Secondary Research
- Annual Reports
- White Paper
- Latest Press Release
- Industry Association
- Paid Database
- Investor Presentations

Step 4 - Data Triangulation
Involves using different sources of information in order to increase the validity of a study
These sources are likely to be stakeholders in a program - participants, other researchers, program staff, other community members, and so on.
Then we put all data in single framework & apply various statistical tools to find out the dynamic on the market.
During the analysis stage, feedback from the stakeholder groups would be compared to determine areas of agreement as well as areas of divergence