

Key Insights
The citrus crop nutrition market is a dynamic sector experiencing significant growth driven by the increasing global demand for citrus fruits and the rising adoption of advanced agricultural practices. The market's expansion is fueled by several factors, including the growing global population and rising disposable incomes leading to increased consumption of citrus fruits. Furthermore, the increasing awareness among citrus growers about the importance of balanced nutrition for enhanced yields and fruit quality is driving the demand for specialized fertilizers and crop nutrition solutions. Technological advancements in fertilizer formulations, including controlled-release fertilizers and bio-stimulants, are also contributing to market growth. However, factors such as fluctuating raw material prices, stringent environmental regulations regarding fertilizer usage, and the impact of climate change on citrus production pose challenges to market expansion. Competitive pressures from established players and the emergence of new entrants are also shaping the market landscape. Despite these challenges, the market is expected to maintain a steady growth trajectory, driven by the continuous need for efficient and sustainable crop nutrition solutions for improved citrus yields.
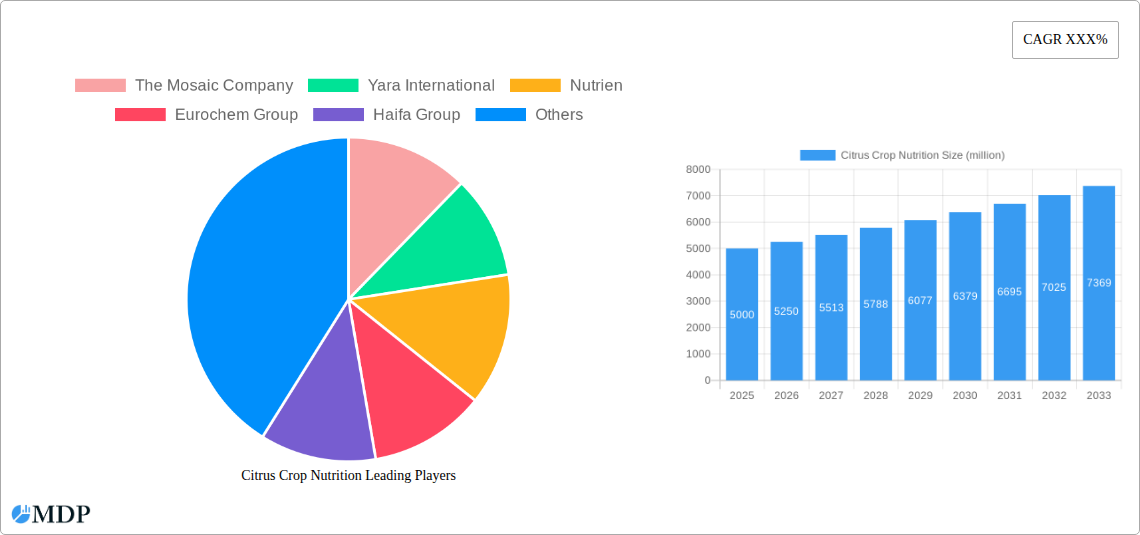
Citrus Crop Nutrition Market Size (In Billion)
Segment-wise, we can anticipate strong growth in specialized nutrient solutions tailored to specific citrus varieties and soil conditions. The adoption of precision agriculture techniques, including soil testing and nutrient management software, is expected to further drive market segmentation. Geographically, regions with high citrus production, such as the Mediterranean basin, South America, and Florida, will be key contributors to market growth. The competitive landscape features both established multinational corporations and regional players. Major players are focused on product innovation, mergers and acquisitions, and strategic partnerships to expand their market share and enhance their product offerings. This strategic maneuvering reflects a highly competitive yet lucrative market with ample opportunities for both established players and new entrants alike. Overall, the citrus crop nutrition market is poised for sustained growth, provided market participants adapt to evolving consumer demands and environmental regulations.

Citrus Crop Nutrition Company Market Share
Citrus Crop Nutrition Market Report: 2019-2033 - A Comprehensive Analysis
This comprehensive report provides an in-depth analysis of the global Citrus Crop Nutrition market, projecting a market value exceeding $XX million by 2033. The study covers the period from 2019 to 2033, with a base year of 2025 and a forecast period of 2025-2033. This report is invaluable for industry stakeholders, investors, and businesses seeking to understand market dynamics, competitive landscapes, and future growth opportunities within the citrus crop nutrition sector. It leverages extensive market research, incorporating data from the historical period (2019-2024) and utilizing expert estimations for the projected values.
Citrus Crop Nutrition Market Dynamics & Concentration
The global citrus crop nutrition market, valued at $XX million in 2025, is characterized by a moderately concentrated landscape. Major players such as The Mosaic Company, Yara International, Nutrien, Eurochem Group, Haifa Group, ICL Group, Compass Minerals, Helena Agri-Enterprises, Wilbur-Ellis, Brandt, and K+S KALI hold significant market shares, collectively accounting for approximately XX% of the total market in 2025. Market concentration is influenced by factors such as economies of scale in production and distribution, strong brand recognition, and extensive research & development capabilities.
- Market Share: The Mosaic Company holds the largest market share at approximately XX%, followed by Yara International with XX%.
- Innovation Drivers: Continuous innovation in fertilizer formulations, including slow-release and targeted nutrient delivery systems, is driving market growth.
- Regulatory Frameworks: Stringent environmental regulations concerning fertilizer use are shaping product development and influencing market dynamics.
- Product Substitutes: Organic farming practices and biofertilizers are emerging as potential substitutes, although their market penetration remains relatively low at XX% in 2025.
- End-User Trends: Growing demand for high-quality citrus fruits, coupled with increasing awareness of sustainable agricultural practices, is fostering market expansion.
- M&A Activities: The historical period (2019-2024) witnessed approximately XX merger and acquisition deals, indicating a trend towards consolidation within the industry. This trend is expected to continue, driven by the pursuit of economies of scale and expansion into new markets.
Citrus Crop Nutrition Industry Trends & Analysis
The citrus crop nutrition market exhibits a robust Compound Annual Growth Rate (CAGR) of XX% during the forecast period (2025-2033). This growth is propelled by several key factors: increasing global citrus fruit consumption, rising demand for improved crop yields and quality, and the escalating adoption of precision agriculture techniques. Technological advancements in fertilizer application, such as drone technology and variable rate application, are further boosting market expansion. Consumer preferences for sustainably produced citrus fruits are also driving demand for eco-friendly and efficient fertilizer solutions. Competitive dynamics are intense, with major players focusing on product innovation, strategic partnerships, and geographical expansion to maintain a competitive edge. Market penetration of advanced fertilizer technologies is expected to increase from XX% in 2025 to XX% by 2033.
Leading Markets & Segments in Citrus Crop Nutrition
The leading market for citrus crop nutrition is currently [Dominant Region/Country], accounting for approximately XX% of the global market in 2025. This dominance is primarily attributed to:
- Key Drivers in [Dominant Region/Country]:
- Favorable climatic conditions conducive to citrus cultivation.
- Extensive citrus orchards and large-scale farming practices.
- Government support for agricultural development and investment in infrastructure.
- Strong economic growth and rising disposable incomes, leading to increased consumer demand.
The detailed dominance analysis reveals that [Dominant Region/Country]'s well-established agricultural sector, coupled with substantial investments in research and development, are major contributors to its leading position within the citrus crop nutrition market. Other significant regions include [Region 2] and [Region 3], which exhibit substantial growth potential due to expanding citrus cultivation areas and increasing adoption of modern farming techniques.
Citrus Crop Nutrition Product Developments
Recent product innovations focus on developing specialized fertilizers tailored to specific citrus varieties and growth stages. These advancements include slow-release formulations that minimize nutrient leaching and optimize nutrient uptake. Furthermore, the integration of biostimulants and biofertilizers into conventional fertilizers is gaining traction, offering sustainable and environmentally friendly alternatives. These products are gaining market acceptance due to their improved efficiency and reduced environmental impact, enhancing their competitive advantages.
Key Drivers of Citrus Crop Nutrition Growth
Several factors fuel the growth of the citrus crop nutrition market. Technological advancements, such as precision agriculture and smart farming technologies, are significantly improving fertilizer application efficiency and reducing waste. Favorable government policies supporting agricultural development and promoting sustainable farming practices further stimulate market expansion. The increasing global demand for citrus fruits and the need for higher crop yields are critical drivers, along with rising investments in agricultural research and development.
Challenges in the Citrus Crop Nutrition Market
The citrus crop nutrition market faces various challenges. Stringent environmental regulations regarding fertilizer use, leading to increased compliance costs, are a major hurdle. Fluctuations in raw material prices and supply chain disruptions can impact profitability. Intense competition among established players necessitates continuous innovation and strategic investments to maintain market share. These factors collectively impact profitability and market growth, requiring proactive management strategies.
Emerging Opportunities in Citrus Crop Nutrition
The citrus crop nutrition market presents significant long-term growth opportunities. Technological breakthroughs in targeted nutrient delivery systems, offering increased efficiency and reduced environmental impact, are set to reshape the market. Strategic partnerships between fertilizer companies and agricultural technology providers create synergy and drive innovation. Expansion into emerging markets with growing citrus cultivation areas offers substantial market potential. These developments collectively pave the way for long-term market expansion and sustainable growth.
Leading Players in the Citrus Crop Nutrition Sector
- The Mosaic Company
- Yara International
- Nutrien
- Eurochem Group
- Haifa Group
- ICL Group
- Compass Minerals
- Helena Agri-Enterprises
- Wilbur-Ellis
- Brandt
- K+S KALI
Key Milestones in Citrus Crop Nutrition Industry
- 2020: Introduction of a new slow-release fertilizer by Yara International.
- 2021: The Mosaic Company acquires a smaller fertilizer producer, expanding its market reach.
- 2022: Nutrien launches a new precision agriculture platform for optimized fertilizer application.
- 2023: ICL Group invests heavily in research and development of biofertilizers.
- 2024: Several mergers and acquisitions take place within the industry, resulting in greater market consolidation.
Strategic Outlook for Citrus Crop Nutrition Market
The citrus crop nutrition market is poised for sustained growth, driven by ongoing technological advancements and increased demand for high-quality citrus fruits. Strategic investments in research and development, coupled with the adoption of sustainable farming practices, are key to long-term success. Expansion into emerging markets and the development of innovative product solutions will be crucial factors for companies seeking to capitalize on future growth opportunities. The market's future trajectory hinges on navigating regulatory challenges and fostering sustainable practices.
Citrus Crop Nutrition Segmentation
-
1. Application
- 1.1. Healthy Diet
- 1.2. Food Industry
- 1.3. Skin Care Products
- 1.4. Medicinal Purposes
-
2. Type
- 2.1. Fresh Citrus Fruits
- 2.2. Citrus Juice
- 2.3. Dried Citrus Fruits
- 2.4. Processed Citrus Foods
Citrus Crop Nutrition Segmentation By Geography
-
1. North America
- 1.1. United States
- 1.2. Canada
- 1.3. Mexico
-
2. South America
- 2.1. Brazil
- 2.2. Argentina
- 2.3. Rest of South America
-
3. Europe
- 3.1. United Kingdom
- 3.2. Germany
- 3.3. France
- 3.4. Italy
- 3.5. Spain
- 3.6. Russia
- 3.7. Benelux
- 3.8. Nordics
- 3.9. Rest of Europe
-
4. Middle East & Africa
- 4.1. Turkey
- 4.2. Israel
- 4.3. GCC
- 4.4. North Africa
- 4.5. South Africa
- 4.6. Rest of Middle East & Africa
-
5. Asia Pacific
- 5.1. China
- 5.2. India
- 5.3. Japan
- 5.4. South Korea
- 5.5. ASEAN
- 5.6. Oceania
- 5.7. Rest of Asia Pacific
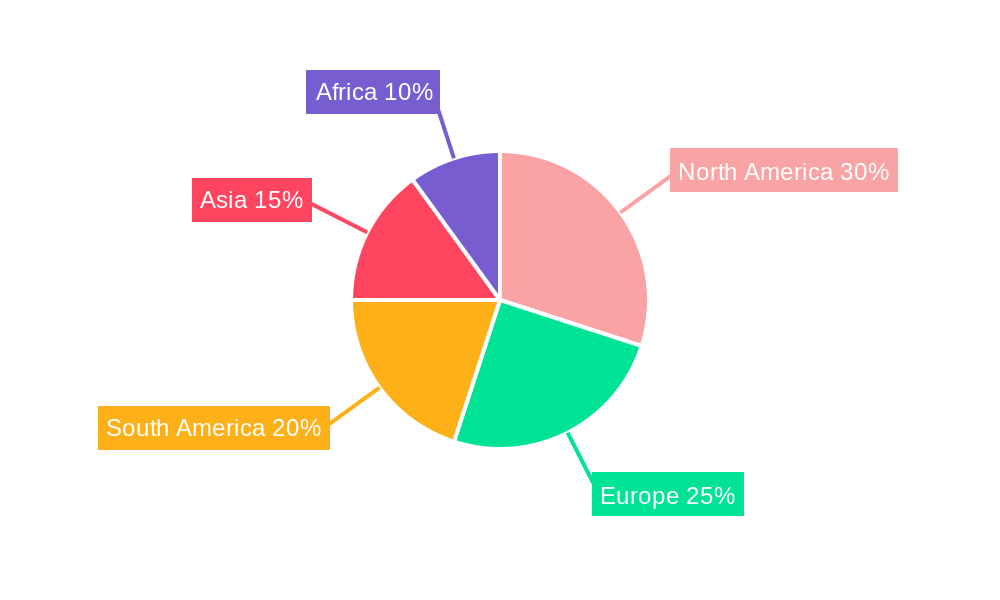
Citrus Crop Nutrition Regional Market Share
Geographic Coverage of Citrus Crop Nutrition
Citrus Crop Nutrition REPORT HIGHLIGHTS
| Aspects | Details |
|---|---|
| Study Period | 2020-2034 |
| Base Year | 2025 |
| Estimated Year | 2026 |
| Forecast Period | 2026-2034 |
| Historical Period | 2020-2025 |
| Growth Rate | CAGR of 13.4% from 2020-2034 |
| Segmentation |
|
Table of Contents
- 1. Introduction
- 1.1. Research Scope
- 1.2. Market Segmentation
- 1.3. Research Methodology
- 1.4. Definitions and Assumptions
- 2. Executive Summary
- 2.1. Introduction
- 3. Market Dynamics
- 3.1. Introduction
- 3.2. Market Drivers
- 3.3. Market Restrains
- 3.4. Market Trends
- 4. Market Factor Analysis
- 4.1. Porters Five Forces
- 4.2. Supply/Value Chain
- 4.3. PESTEL analysis
- 4.4. Market Entropy
- 4.5. Patent/Trademark Analysis
- 5. Global Citrus Crop Nutrition Analysis, Insights and Forecast, 2020-2032
- 5.1. Market Analysis, Insights and Forecast - by Application
- 5.1.1. Healthy Diet
- 5.1.2. Food Industry
- 5.1.3. Skin Care Products
- 5.1.4. Medicinal Purposes
- 5.2. Market Analysis, Insights and Forecast - by Type
- 5.2.1. Fresh Citrus Fruits
- 5.2.2. Citrus Juice
- 5.2.3. Dried Citrus Fruits
- 5.2.4. Processed Citrus Foods
- 5.3. Market Analysis, Insights and Forecast - by Region
- 5.3.1. North America
- 5.3.2. South America
- 5.3.3. Europe
- 5.3.4. Middle East & Africa
- 5.3.5. Asia Pacific
- 5.1. Market Analysis, Insights and Forecast - by Application
- 6. North America Citrus Crop Nutrition Analysis, Insights and Forecast, 2020-2032
- 6.1. Market Analysis, Insights and Forecast - by Application
- 6.1.1. Healthy Diet
- 6.1.2. Food Industry
- 6.1.3. Skin Care Products
- 6.1.4. Medicinal Purposes
- 6.2. Market Analysis, Insights and Forecast - by Type
- 6.2.1. Fresh Citrus Fruits
- 6.2.2. Citrus Juice
- 6.2.3. Dried Citrus Fruits
- 6.2.4. Processed Citrus Foods
- 6.1. Market Analysis, Insights and Forecast - by Application
- 7. South America Citrus Crop Nutrition Analysis, Insights and Forecast, 2020-2032
- 7.1. Market Analysis, Insights and Forecast - by Application
- 7.1.1. Healthy Diet
- 7.1.2. Food Industry
- 7.1.3. Skin Care Products
- 7.1.4. Medicinal Purposes
- 7.2. Market Analysis, Insights and Forecast - by Type
- 7.2.1. Fresh Citrus Fruits
- 7.2.2. Citrus Juice
- 7.2.3. Dried Citrus Fruits
- 7.2.4. Processed Citrus Foods
- 7.1. Market Analysis, Insights and Forecast - by Application
- 8. Europe Citrus Crop Nutrition Analysis, Insights and Forecast, 2020-2032
- 8.1. Market Analysis, Insights and Forecast - by Application
- 8.1.1. Healthy Diet
- 8.1.2. Food Industry
- 8.1.3. Skin Care Products
- 8.1.4. Medicinal Purposes
- 8.2. Market Analysis, Insights and Forecast - by Type
- 8.2.1. Fresh Citrus Fruits
- 8.2.2. Citrus Juice
- 8.2.3. Dried Citrus Fruits
- 8.2.4. Processed Citrus Foods
- 8.1. Market Analysis, Insights and Forecast - by Application
- 9. Middle East & Africa Citrus Crop Nutrition Analysis, Insights and Forecast, 2020-2032
- 9.1. Market Analysis, Insights and Forecast - by Application
- 9.1.1. Healthy Diet
- 9.1.2. Food Industry
- 9.1.3. Skin Care Products
- 9.1.4. Medicinal Purposes
- 9.2. Market Analysis, Insights and Forecast - by Type
- 9.2.1. Fresh Citrus Fruits
- 9.2.2. Citrus Juice
- 9.2.3. Dried Citrus Fruits
- 9.2.4. Processed Citrus Foods
- 9.1. Market Analysis, Insights and Forecast - by Application
- 10. Asia Pacific Citrus Crop Nutrition Analysis, Insights and Forecast, 2020-2032
- 10.1. Market Analysis, Insights and Forecast - by Application
- 10.1.1. Healthy Diet
- 10.1.2. Food Industry
- 10.1.3. Skin Care Products
- 10.1.4. Medicinal Purposes
- 10.2. Market Analysis, Insights and Forecast - by Type
- 10.2.1. Fresh Citrus Fruits
- 10.2.2. Citrus Juice
- 10.2.3. Dried Citrus Fruits
- 10.2.4. Processed Citrus Foods
- 10.1. Market Analysis, Insights and Forecast - by Application
- 11. Competitive Analysis
- 11.1. Global Market Share Analysis 2025
- 11.2. Company Profiles
- 11.2.1 The Mosaic Company
- 11.2.1.1. Overview
- 11.2.1.2. Products
- 11.2.1.3. SWOT Analysis
- 11.2.1.4. Recent Developments
- 11.2.1.5. Financials (Based on Availability)
- 11.2.2 Yara International
- 11.2.2.1. Overview
- 11.2.2.2. Products
- 11.2.2.3. SWOT Analysis
- 11.2.2.4. Recent Developments
- 11.2.2.5. Financials (Based on Availability)
- 11.2.3 Nutrien
- 11.2.3.1. Overview
- 11.2.3.2. Products
- 11.2.3.3. SWOT Analysis
- 11.2.3.4. Recent Developments
- 11.2.3.5. Financials (Based on Availability)
- 11.2.4 Eurochem Group
- 11.2.4.1. Overview
- 11.2.4.2. Products
- 11.2.4.3. SWOT Analysis
- 11.2.4.4. Recent Developments
- 11.2.4.5. Financials (Based on Availability)
- 11.2.5 Haifa Group
- 11.2.5.1. Overview
- 11.2.5.2. Products
- 11.2.5.3. SWOT Analysis
- 11.2.5.4. Recent Developments
- 11.2.5.5. Financials (Based on Availability)
- 11.2.6 ICL Group
- 11.2.6.1. Overview
- 11.2.6.2. Products
- 11.2.6.3. SWOT Analysis
- 11.2.6.4. Recent Developments
- 11.2.6.5. Financials (Based on Availability)
- 11.2.7 Compass Minerals
- 11.2.7.1. Overview
- 11.2.7.2. Products
- 11.2.7.3. SWOT Analysis
- 11.2.7.4. Recent Developments
- 11.2.7.5. Financials (Based on Availability)
- 11.2.8 Helena Agri-Enterprises
- 11.2.8.1. Overview
- 11.2.8.2. Products
- 11.2.8.3. SWOT Analysis
- 11.2.8.4. Recent Developments
- 11.2.8.5. Financials (Based on Availability)
- 11.2.9 Wilbur-Ellis
- 11.2.9.1. Overview
- 11.2.9.2. Products
- 11.2.9.3. SWOT Analysis
- 11.2.9.4. Recent Developments
- 11.2.9.5. Financials (Based on Availability)
- 11.2.10 Brandt
- 11.2.10.1. Overview
- 11.2.10.2. Products
- 11.2.10.3. SWOT Analysis
- 11.2.10.4. Recent Developments
- 11.2.10.5. Financials (Based on Availability)
- 11.2.11 K+S KALI
- 11.2.11.1. Overview
- 11.2.11.2. Products
- 11.2.11.3. SWOT Analysis
- 11.2.11.4. Recent Developments
- 11.2.11.5. Financials (Based on Availability)
- 11.2.1 The Mosaic Company
List of Figures
- Figure 1: Global Citrus Crop Nutrition Revenue Breakdown (undefined, %) by Region 2025 & 2033
- Figure 2: Global Citrus Crop Nutrition Volume Breakdown (K, %) by Region 2025 & 2033
- Figure 3: North America Citrus Crop Nutrition Revenue (undefined), by Application 2025 & 2033
- Figure 4: North America Citrus Crop Nutrition Volume (K), by Application 2025 & 2033
- Figure 5: North America Citrus Crop Nutrition Revenue Share (%), by Application 2025 & 2033
- Figure 6: North America Citrus Crop Nutrition Volume Share (%), by Application 2025 & 2033
- Figure 7: North America Citrus Crop Nutrition Revenue (undefined), by Type 2025 & 2033
- Figure 8: North America Citrus Crop Nutrition Volume (K), by Type 2025 & 2033
- Figure 9: North America Citrus Crop Nutrition Revenue Share (%), by Type 2025 & 2033
- Figure 10: North America Citrus Crop Nutrition Volume Share (%), by Type 2025 & 2033
- Figure 11: North America Citrus Crop Nutrition Revenue (undefined), by Country 2025 & 2033
- Figure 12: North America Citrus Crop Nutrition Volume (K), by Country 2025 & 2033
- Figure 13: North America Citrus Crop Nutrition Revenue Share (%), by Country 2025 & 2033
- Figure 14: North America Citrus Crop Nutrition Volume Share (%), by Country 2025 & 2033
- Figure 15: South America Citrus Crop Nutrition Revenue (undefined), by Application 2025 & 2033
- Figure 16: South America Citrus Crop Nutrition Volume (K), by Application 2025 & 2033
- Figure 17: South America Citrus Crop Nutrition Revenue Share (%), by Application 2025 & 2033
- Figure 18: South America Citrus Crop Nutrition Volume Share (%), by Application 2025 & 2033
- Figure 19: South America Citrus Crop Nutrition Revenue (undefined), by Type 2025 & 2033
- Figure 20: South America Citrus Crop Nutrition Volume (K), by Type 2025 & 2033
- Figure 21: South America Citrus Crop Nutrition Revenue Share (%), by Type 2025 & 2033
- Figure 22: South America Citrus Crop Nutrition Volume Share (%), by Type 2025 & 2033
- Figure 23: South America Citrus Crop Nutrition Revenue (undefined), by Country 2025 & 2033
- Figure 24: South America Citrus Crop Nutrition Volume (K), by Country 2025 & 2033
- Figure 25: South America Citrus Crop Nutrition Revenue Share (%), by Country 2025 & 2033
- Figure 26: South America Citrus Crop Nutrition Volume Share (%), by Country 2025 & 2033
- Figure 27: Europe Citrus Crop Nutrition Revenue (undefined), by Application 2025 & 2033
- Figure 28: Europe Citrus Crop Nutrition Volume (K), by Application 2025 & 2033
- Figure 29: Europe Citrus Crop Nutrition Revenue Share (%), by Application 2025 & 2033
- Figure 30: Europe Citrus Crop Nutrition Volume Share (%), by Application 2025 & 2033
- Figure 31: Europe Citrus Crop Nutrition Revenue (undefined), by Type 2025 & 2033
- Figure 32: Europe Citrus Crop Nutrition Volume (K), by Type 2025 & 2033
- Figure 33: Europe Citrus Crop Nutrition Revenue Share (%), by Type 2025 & 2033
- Figure 34: Europe Citrus Crop Nutrition Volume Share (%), by Type 2025 & 2033
- Figure 35: Europe Citrus Crop Nutrition Revenue (undefined), by Country 2025 & 2033
- Figure 36: Europe Citrus Crop Nutrition Volume (K), by Country 2025 & 2033
- Figure 37: Europe Citrus Crop Nutrition Revenue Share (%), by Country 2025 & 2033
- Figure 38: Europe Citrus Crop Nutrition Volume Share (%), by Country 2025 & 2033
- Figure 39: Middle East & Africa Citrus Crop Nutrition Revenue (undefined), by Application 2025 & 2033
- Figure 40: Middle East & Africa Citrus Crop Nutrition Volume (K), by Application 2025 & 2033
- Figure 41: Middle East & Africa Citrus Crop Nutrition Revenue Share (%), by Application 2025 & 2033
- Figure 42: Middle East & Africa Citrus Crop Nutrition Volume Share (%), by Application 2025 & 2033
- Figure 43: Middle East & Africa Citrus Crop Nutrition Revenue (undefined), by Type 2025 & 2033
- Figure 44: Middle East & Africa Citrus Crop Nutrition Volume (K), by Type 2025 & 2033
- Figure 45: Middle East & Africa Citrus Crop Nutrition Revenue Share (%), by Type 2025 & 2033
- Figure 46: Middle East & Africa Citrus Crop Nutrition Volume Share (%), by Type 2025 & 2033
- Figure 47: Middle East & Africa Citrus Crop Nutrition Revenue (undefined), by Country 2025 & 2033
- Figure 48: Middle East & Africa Citrus Crop Nutrition Volume (K), by Country 2025 & 2033
- Figure 49: Middle East & Africa Citrus Crop Nutrition Revenue Share (%), by Country 2025 & 2033
- Figure 50: Middle East & Africa Citrus Crop Nutrition Volume Share (%), by Country 2025 & 2033
- Figure 51: Asia Pacific Citrus Crop Nutrition Revenue (undefined), by Application 2025 & 2033
- Figure 52: Asia Pacific Citrus Crop Nutrition Volume (K), by Application 2025 & 2033
- Figure 53: Asia Pacific Citrus Crop Nutrition Revenue Share (%), by Application 2025 & 2033
- Figure 54: Asia Pacific Citrus Crop Nutrition Volume Share (%), by Application 2025 & 2033
- Figure 55: Asia Pacific Citrus Crop Nutrition Revenue (undefined), by Type 2025 & 2033
- Figure 56: Asia Pacific Citrus Crop Nutrition Volume (K), by Type 2025 & 2033
- Figure 57: Asia Pacific Citrus Crop Nutrition Revenue Share (%), by Type 2025 & 2033
- Figure 58: Asia Pacific Citrus Crop Nutrition Volume Share (%), by Type 2025 & 2033
- Figure 59: Asia Pacific Citrus Crop Nutrition Revenue (undefined), by Country 2025 & 2033
- Figure 60: Asia Pacific Citrus Crop Nutrition Volume (K), by Country 2025 & 2033
- Figure 61: Asia Pacific Citrus Crop Nutrition Revenue Share (%), by Country 2025 & 2033
- Figure 62: Asia Pacific Citrus Crop Nutrition Volume Share (%), by Country 2025 & 2033
List of Tables
- Table 1: Global Citrus Crop Nutrition Revenue undefined Forecast, by Application 2020 & 2033
- Table 2: Global Citrus Crop Nutrition Volume K Forecast, by Application 2020 & 2033
- Table 3: Global Citrus Crop Nutrition Revenue undefined Forecast, by Type 2020 & 2033
- Table 4: Global Citrus Crop Nutrition Volume K Forecast, by Type 2020 & 2033
- Table 5: Global Citrus Crop Nutrition Revenue undefined Forecast, by Region 2020 & 2033
- Table 6: Global Citrus Crop Nutrition Volume K Forecast, by Region 2020 & 2033
- Table 7: Global Citrus Crop Nutrition Revenue undefined Forecast, by Application 2020 & 2033
- Table 8: Global Citrus Crop Nutrition Volume K Forecast, by Application 2020 & 2033
- Table 9: Global Citrus Crop Nutrition Revenue undefined Forecast, by Type 2020 & 2033
- Table 10: Global Citrus Crop Nutrition Volume K Forecast, by Type 2020 & 2033
- Table 11: Global Citrus Crop Nutrition Revenue undefined Forecast, by Country 2020 & 2033
- Table 12: Global Citrus Crop Nutrition Volume K Forecast, by Country 2020 & 2033
- Table 13: United States Citrus Crop Nutrition Revenue (undefined) Forecast, by Application 2020 & 2033
- Table 14: United States Citrus Crop Nutrition Volume (K) Forecast, by Application 2020 & 2033
- Table 15: Canada Citrus Crop Nutrition Revenue (undefined) Forecast, by Application 2020 & 2033
- Table 16: Canada Citrus Crop Nutrition Volume (K) Forecast, by Application 2020 & 2033
- Table 17: Mexico Citrus Crop Nutrition Revenue (undefined) Forecast, by Application 2020 & 2033
- Table 18: Mexico Citrus Crop Nutrition Volume (K) Forecast, by Application 2020 & 2033
- Table 19: Global Citrus Crop Nutrition Revenue undefined Forecast, by Application 2020 & 2033
- Table 20: Global Citrus Crop Nutrition Volume K Forecast, by Application 2020 & 2033
- Table 21: Global Citrus Crop Nutrition Revenue undefined Forecast, by Type 2020 & 2033
- Table 22: Global Citrus Crop Nutrition Volume K Forecast, by Type 2020 & 2033
- Table 23: Global Citrus Crop Nutrition Revenue undefined Forecast, by Country 2020 & 2033
- Table 24: Global Citrus Crop Nutrition Volume K Forecast, by Country 2020 & 2033
- Table 25: Brazil Citrus Crop Nutrition Revenue (undefined) Forecast, by Application 2020 & 2033
- Table 26: Brazil Citrus Crop Nutrition Volume (K) Forecast, by Application 2020 & 2033
- Table 27: Argentina Citrus Crop Nutrition Revenue (undefined) Forecast, by Application 2020 & 2033
- Table 28: Argentina Citrus Crop Nutrition Volume (K) Forecast, by Application 2020 & 2033
- Table 29: Rest of South America Citrus Crop Nutrition Revenue (undefined) Forecast, by Application 2020 & 2033
- Table 30: Rest of South America Citrus Crop Nutrition Volume (K) Forecast, by Application 2020 & 2033
- Table 31: Global Citrus Crop Nutrition Revenue undefined Forecast, by Application 2020 & 2033
- Table 32: Global Citrus Crop Nutrition Volume K Forecast, by Application 2020 & 2033
- Table 33: Global Citrus Crop Nutrition Revenue undefined Forecast, by Type 2020 & 2033
- Table 34: Global Citrus Crop Nutrition Volume K Forecast, by Type 2020 & 2033
- Table 35: Global Citrus Crop Nutrition Revenue undefined Forecast, by Country 2020 & 2033
- Table 36: Global Citrus Crop Nutrition Volume K Forecast, by Country 2020 & 2033
- Table 37: United Kingdom Citrus Crop Nutrition Revenue (undefined) Forecast, by Application 2020 & 2033
- Table 38: United Kingdom Citrus Crop Nutrition Volume (K) Forecast, by Application 2020 & 2033
- Table 39: Germany Citrus Crop Nutrition Revenue (undefined) Forecast, by Application 2020 & 2033
- Table 40: Germany Citrus Crop Nutrition Volume (K) Forecast, by Application 2020 & 2033
- Table 41: France Citrus Crop Nutrition Revenue (undefined) Forecast, by Application 2020 & 2033
- Table 42: France Citrus Crop Nutrition Volume (K) Forecast, by Application 2020 & 2033
- Table 43: Italy Citrus Crop Nutrition Revenue (undefined) Forecast, by Application 2020 & 2033
- Table 44: Italy Citrus Crop Nutrition Volume (K) Forecast, by Application 2020 & 2033
- Table 45: Spain Citrus Crop Nutrition Revenue (undefined) Forecast, by Application 2020 & 2033
- Table 46: Spain Citrus Crop Nutrition Volume (K) Forecast, by Application 2020 & 2033
- Table 47: Russia Citrus Crop Nutrition Revenue (undefined) Forecast, by Application 2020 & 2033
- Table 48: Russia Citrus Crop Nutrition Volume (K) Forecast, by Application 2020 & 2033
- Table 49: Benelux Citrus Crop Nutrition Revenue (undefined) Forecast, by Application 2020 & 2033
- Table 50: Benelux Citrus Crop Nutrition Volume (K) Forecast, by Application 2020 & 2033
- Table 51: Nordics Citrus Crop Nutrition Revenue (undefined) Forecast, by Application 2020 & 2033
- Table 52: Nordics Citrus Crop Nutrition Volume (K) Forecast, by Application 2020 & 2033
- Table 53: Rest of Europe Citrus Crop Nutrition Revenue (undefined) Forecast, by Application 2020 & 2033
- Table 54: Rest of Europe Citrus Crop Nutrition Volume (K) Forecast, by Application 2020 & 2033
- Table 55: Global Citrus Crop Nutrition Revenue undefined Forecast, by Application 2020 & 2033
- Table 56: Global Citrus Crop Nutrition Volume K Forecast, by Application 2020 & 2033
- Table 57: Global Citrus Crop Nutrition Revenue undefined Forecast, by Type 2020 & 2033
- Table 58: Global Citrus Crop Nutrition Volume K Forecast, by Type 2020 & 2033
- Table 59: Global Citrus Crop Nutrition Revenue undefined Forecast, by Country 2020 & 2033
- Table 60: Global Citrus Crop Nutrition Volume K Forecast, by Country 2020 & 2033
- Table 61: Turkey Citrus Crop Nutrition Revenue (undefined) Forecast, by Application 2020 & 2033
- Table 62: Turkey Citrus Crop Nutrition Volume (K) Forecast, by Application 2020 & 2033
- Table 63: Israel Citrus Crop Nutrition Revenue (undefined) Forecast, by Application 2020 & 2033
- Table 64: Israel Citrus Crop Nutrition Volume (K) Forecast, by Application 2020 & 2033
- Table 65: GCC Citrus Crop Nutrition Revenue (undefined) Forecast, by Application 2020 & 2033
- Table 66: GCC Citrus Crop Nutrition Volume (K) Forecast, by Application 2020 & 2033
- Table 67: North Africa Citrus Crop Nutrition Revenue (undefined) Forecast, by Application 2020 & 2033
- Table 68: North Africa Citrus Crop Nutrition Volume (K) Forecast, by Application 2020 & 2033
- Table 69: South Africa Citrus Crop Nutrition Revenue (undefined) Forecast, by Application 2020 & 2033
- Table 70: South Africa Citrus Crop Nutrition Volume (K) Forecast, by Application 2020 & 2033
- Table 71: Rest of Middle East & Africa Citrus Crop Nutrition Revenue (undefined) Forecast, by Application 2020 & 2033
- Table 72: Rest of Middle East & Africa Citrus Crop Nutrition Volume (K) Forecast, by Application 2020 & 2033
- Table 73: Global Citrus Crop Nutrition Revenue undefined Forecast, by Application 2020 & 2033
- Table 74: Global Citrus Crop Nutrition Volume K Forecast, by Application 2020 & 2033
- Table 75: Global Citrus Crop Nutrition Revenue undefined Forecast, by Type 2020 & 2033
- Table 76: Global Citrus Crop Nutrition Volume K Forecast, by Type 2020 & 2033
- Table 77: Global Citrus Crop Nutrition Revenue undefined Forecast, by Country 2020 & 2033
- Table 78: Global Citrus Crop Nutrition Volume K Forecast, by Country 2020 & 2033
- Table 79: China Citrus Crop Nutrition Revenue (undefined) Forecast, by Application 2020 & 2033
- Table 80: China Citrus Crop Nutrition Volume (K) Forecast, by Application 2020 & 2033
- Table 81: India Citrus Crop Nutrition Revenue (undefined) Forecast, by Application 2020 & 2033
- Table 82: India Citrus Crop Nutrition Volume (K) Forecast, by Application 2020 & 2033
- Table 83: Japan Citrus Crop Nutrition Revenue (undefined) Forecast, by Application 2020 & 2033
- Table 84: Japan Citrus Crop Nutrition Volume (K) Forecast, by Application 2020 & 2033
- Table 85: South Korea Citrus Crop Nutrition Revenue (undefined) Forecast, by Application 2020 & 2033
- Table 86: South Korea Citrus Crop Nutrition Volume (K) Forecast, by Application 2020 & 2033
- Table 87: ASEAN Citrus Crop Nutrition Revenue (undefined) Forecast, by Application 2020 & 2033
- Table 88: ASEAN Citrus Crop Nutrition Volume (K) Forecast, by Application 2020 & 2033
- Table 89: Oceania Citrus Crop Nutrition Revenue (undefined) Forecast, by Application 2020 & 2033
- Table 90: Oceania Citrus Crop Nutrition Volume (K) Forecast, by Application 2020 & 2033
- Table 91: Rest of Asia Pacific Citrus Crop Nutrition Revenue (undefined) Forecast, by Application 2020 & 2033
- Table 92: Rest of Asia Pacific Citrus Crop Nutrition Volume (K) Forecast, by Application 2020 & 2033
Frequently Asked Questions
1. What is the projected Compound Annual Growth Rate (CAGR) of the Citrus Crop Nutrition?
The projected CAGR is approximately 13.4%.
2. Which companies are prominent players in the Citrus Crop Nutrition?
Key companies in the market include The Mosaic Company, Yara International, Nutrien, Eurochem Group, Haifa Group, ICL Group, Compass Minerals, Helena Agri-Enterprises, Wilbur-Ellis, Brandt, K+S KALI.
3. What are the main segments of the Citrus Crop Nutrition?
The market segments include Application, Type.
4. Can you provide details about the market size?
The market size is estimated to be USD XXX N/A as of 2022.
5. What are some drivers contributing to market growth?
N/A
6. What are the notable trends driving market growth?
N/A
7. Are there any restraints impacting market growth?
N/A
8. Can you provide examples of recent developments in the market?
N/A
9. What pricing options are available for accessing the report?
Pricing options include single-user, multi-user, and enterprise licenses priced at USD 3950.00, USD 5925.00, and USD 7900.00 respectively.
10. Is the market size provided in terms of value or volume?
The market size is provided in terms of value, measured in N/A and volume, measured in K.
11. Are there any specific market keywords associated with the report?
Yes, the market keyword associated with the report is "Citrus Crop Nutrition," which aids in identifying and referencing the specific market segment covered.
12. How do I determine which pricing option suits my needs best?
The pricing options vary based on user requirements and access needs. Individual users may opt for single-user licenses, while businesses requiring broader access may choose multi-user or enterprise licenses for cost-effective access to the report.
13. Are there any additional resources or data provided in the Citrus Crop Nutrition report?
While the report offers comprehensive insights, it's advisable to review the specific contents or supplementary materials provided to ascertain if additional resources or data are available.
14. How can I stay updated on further developments or reports in the Citrus Crop Nutrition?
To stay informed about further developments, trends, and reports in the Citrus Crop Nutrition, consider subscribing to industry newsletters, following relevant companies and organizations, or regularly checking reputable industry news sources and publications.
Methodology
Step 1 - Identification of Relevant Samples Size from Population Database


Step 2 - Approaches for Defining Global Market Size (Value, Volume* & Price*)

Note*: In applicable scenarios
Step 3 - Data Sources
Primary Research
- Web Analytics
- Survey Reports
- Research Institute
- Latest Research Reports
- Opinion Leaders
Secondary Research
- Annual Reports
- White Paper
- Latest Press Release
- Industry Association
- Paid Database
- Investor Presentations

Step 4 - Data Triangulation
Involves using different sources of information in order to increase the validity of a study
These sources are likely to be stakeholders in a program - participants, other researchers, program staff, other community members, and so on.
Then we put all data in single framework & apply various statistical tools to find out the dynamic on the market.
During the analysis stage, feedback from the stakeholder groups would be compared to determine areas of agreement as well as areas of divergence