

Key Insights
The global chicken products market, valued at $50.5 billion in 2025, is poised for substantial growth. This expansion is fueled by escalating consumer demand for accessible and economical protein alternatives. Health-conscious individuals increasingly favor chicken over red meats due to its leaner profile, further stimulating market expansion. Innovations in processing and packaging, including the introduction of value-added items such as ready-to-cook meals and marinated chicken, are key drivers of market dynamism. The proliferation of quick-service restaurants (QSRs) and the growing retail availability of prepared chicken products also contribute significantly to market impetus. Furthermore, evolving consumer preferences for convenience foods are anticipated to drive market growth throughout the forecast period. While challenges such as fluctuating feed prices and concerns regarding antibiotic resistance in poultry farming exist, industry-wide efforts toward sustainability and transparency are expected to mitigate these impacts.
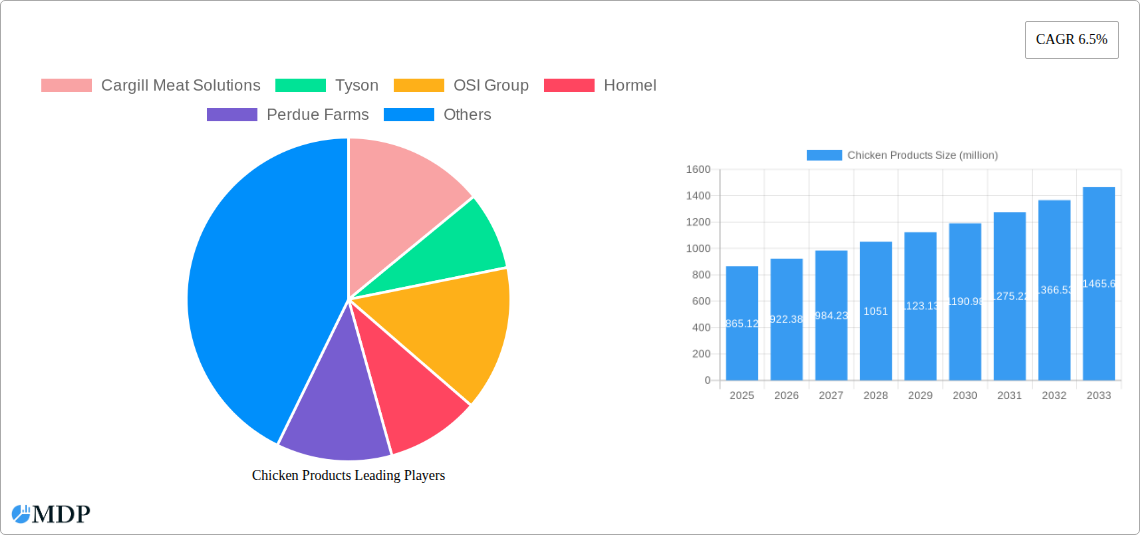
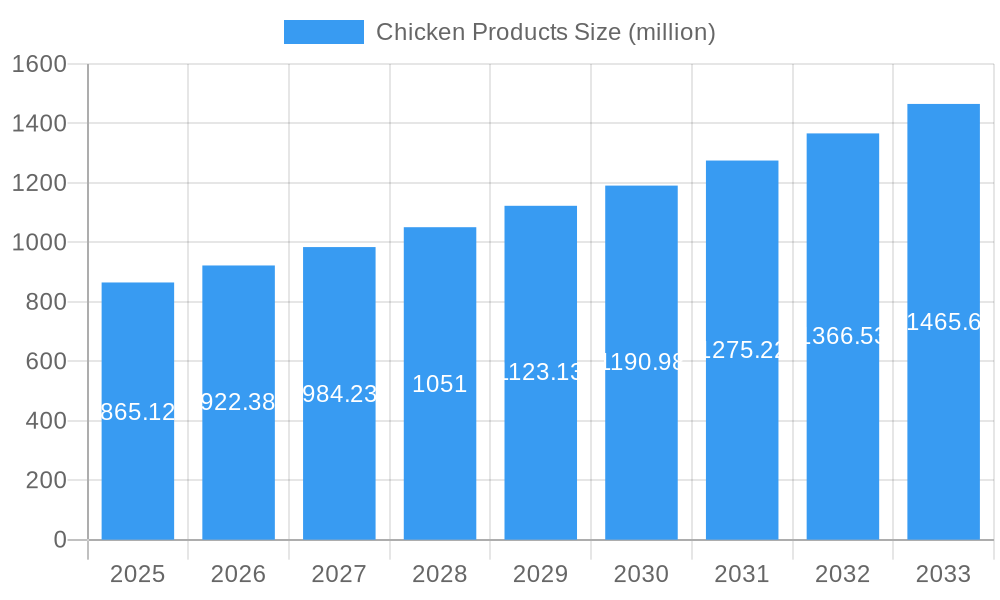
Chicken Products Market Size (In Billion)
The market is projected to achieve a compound annual growth rate (CAGR) of 8.9% from 2025. Leading industry participants, including Cargill, Tyson, and JBS USA Holdings, are actively investing in advanced processing technologies and expanding their international presence. Regional growth patterns are expected to vary, with developed economies potentially exhibiting slower expansion compared to emerging markets in Asia and Africa, where rising disposable incomes and population growth are significant factors. Segmentation within the chicken products market is likely to encompass fresh, frozen, processed, and value-added categories, each with distinct growth trajectories. Intense competitive pressures will persist, compelling companies to focus on brand development, product diversification, and supply chain optimization to sustain market share and profitability. The forecast period is likely to witness market consolidation through mergers and acquisitions, leading to a more concentrated industry landscape.
Chicken Products Company Market Share
Chicken Products Market Report: 2019-2033 - A Comprehensive Analysis of a Multi-Billion Dollar Industry
This comprehensive report provides an in-depth analysis of the global chicken products market, projecting a multi-billion dollar valuation by 2033. We delve into market dynamics, industry trends, leading players, and future opportunities, providing actionable insights for stakeholders across the value chain. The study period spans 2019-2033, with 2025 serving as the base and estimated year. The forecast period is 2025-2033, and the historical period covers 2019-2024. This report is invaluable for investors, manufacturers, distributors, and anyone seeking to understand and capitalize on the growth potential within this dynamic sector. Millions are used as the unit for all values in this report.
Chicken Products Market Dynamics & Concentration
This section analyzes the competitive landscape of the chicken products market, examining market concentration, innovation drivers, regulatory frameworks, and key industry activities. The market is characterized by a mix of large multinational corporations and smaller regional players. The top ten players—Cargill Meat Solutions, Tyson, OSI Group, Hormel, Perdue Farms, Koch Foods, Sanderson Farms, Keystone Foods, JBS USA Holdings, and BRF S.A.—hold a significant portion of the global market share, estimated at xx million in 2025. Smaller players like Mountaire Farms, Shandong Xiantan, Minhe Animal Husbandry, Sunner Development, and DaChan Food, collectively contribute xx million, showcasing the presence of strong regional players.
- Market Concentration: The Herfindahl-Hirschman Index (HHI) for the global chicken products market is estimated at xx, indicating a moderately concentrated market.
- Innovation Drivers: Technological advancements in processing, packaging, and breeding are driving innovation, with a focus on enhancing efficiency and product quality.
- Regulatory Frameworks: Government regulations concerning food safety, animal welfare, and environmental sustainability significantly influence market operations. Recent regulatory changes have increased compliance costs by an estimated xx million annually.
- Product Substitutes: Plant-based meat alternatives are emerging as substitutes, though chicken products retain a strong market position due to taste, affordability, and familiarity.
- End-User Trends: Growing consumer demand for convenience, health-conscious options, and sustainable practices shapes product development and market trends.
- M&A Activities: The chicken products sector has witnessed xx M&A deals in the historical period, driven by strategic expansion, market consolidation, and access to new technologies.
Chicken Products Industry Trends & Analysis
This section examines the key trends shaping the chicken products market. The market experienced a Compound Annual Growth Rate (CAGR) of xx% during the historical period (2019-2024) and is projected to grow at a CAGR of xx% during the forecast period (2025-2033). This growth is fueled by several factors:
- Rising Global Population and Income Levels: The increasing global population, particularly in developing economies, significantly fuels the demand for affordable protein sources like chicken.
- Changing Dietary Habits: Chicken has become a staple in numerous diets worldwide, driven by its versatility, nutritional value, and relatively low cost compared to other protein sources.
- Technological Advancements in Production and Processing: Automation and innovation in poultry farming, processing, and packaging enhance efficiency and reduce costs, further driving market expansion.
- E-commerce and Retail Distribution Channels: The rising popularity of online grocery shopping and evolving retail channels expands access to chicken products for consumers, increasing overall market penetration.
Leading Markets & Segments in Chicken Products
The Asia-Pacific region dominates the global chicken products market, accounting for an estimated xx million in 2025. This dominance is driven by several factors:
- High Population Density: The region boasts a large and growing population, providing a substantial consumer base for chicken products.
- Rapid Economic Growth: Rising disposable incomes in several Asian countries increase the affordability of chicken for a larger segment of the population.
- Favorable Government Policies: Supportive government policies that promote agriculture and food security create a conducive environment for the growth of the chicken industry.
- Expanding Infrastructure: Investments in cold storage facilities and transportation networks enhance the supply chain, allowing for wider distribution and access to consumers across the region.
Chicken Products Product Developments
Recent product innovations center around value-added products such as ready-to-cook meals, marinated chicken, and processed chicken snacks, appealing to the demand for convenience and time-saving solutions. This trend also emphasizes sustainable and ethical sourcing to align with consumer preferences. Technological advances in breeding, processing, and packaging enhance efficiency, product quality, and shelf life. These products cater to diversified consumer segments based on their preferences for taste, health, convenience, and affordability.
Key Drivers of Chicken Products Growth
The chicken products market's growth is driven by a confluence of factors:
- Technological advancements: Automation in farming, processing, and packaging optimize efficiency and reduce costs.
- Economic factors: Rising disposable incomes and changing consumption patterns boost demand in developing economies.
- Regulatory support: Government policies promoting sustainable agriculture support sector development.
Challenges in the Chicken Products Market
Several challenges hinder the chicken products market's growth:
- Fluctuating feed prices: Rising feed costs directly impact production costs and profit margins.
- Disease outbreaks: Avian influenza and other diseases can disrupt supply chains and negatively impact production.
- Stringent regulations: Compliance with food safety, environmental, and animal welfare regulations adds to operational costs.
Emerging Opportunities in Chicken Products
Future growth is driven by:
- Technological breakthroughs in alternative protein sources: Innovation in plant-based and cell-cultured chicken offers new product categories.
- Strategic partnerships: Collaboration across the value chain can enhance efficiency and sustainability.
- Market expansion: Untapped markets in developing regions represent significant growth opportunities.
Leading Players in the Chicken Products Sector
- Cargill Meat Solutions
- Tyson
- OSI Group
- Hormel
- Perdue Farms
- Koch Foods
- Sanderson Farms
- Keystone Foods
- JBS USA Holdings
- BRF S.A.
- Mountaire Farms
- Shandong Xiantan
- Minhe Animal Husbandry
- Sunner Development
- DaChan Food
Key Milestones in Chicken Products Industry
- 2020: Increased demand for at-home consumption due to the COVID-19 pandemic.
- 2021: Several major players invested in plant-based alternatives, indicating growing interest in diversifying product portfolios.
- 2022: Implementation of stricter food safety regulations in several key markets.
- 2023: Significant increase in the adoption of automation technologies across the value chain.
Strategic Outlook for Chicken Products Market
The chicken products market holds strong growth potential, driven by consistent consumer demand and technological advancements. Strategic opportunities exist in value-added products, sustainable practices, and market expansion in developing regions. Companies that successfully navigate challenges related to feed costs, disease outbreaks, and evolving regulations are poised for significant growth.
Chicken Products Segmentation
-
1. Application
- 1.1. Food Services
- 1.2. Retail
-
2. Type
- 2.1. Frozen Chicken Products
- 2.2. Deli Chicken Products
- 2.3. Others
Chicken Products Segmentation By Geography
-
1. North America
- 1.1. United States
- 1.2. Canada
- 1.3. Mexico
-
2. South America
- 2.1. Brazil
- 2.2. Argentina
- 2.3. Rest of South America
-
3. Europe
- 3.1. United Kingdom
- 3.2. Germany
- 3.3. France
- 3.4. Italy
- 3.5. Spain
- 3.6. Russia
- 3.7. Benelux
- 3.8. Nordics
- 3.9. Rest of Europe
-
4. Middle East & Africa
- 4.1. Turkey
- 4.2. Israel
- 4.3. GCC
- 4.4. North Africa
- 4.5. South Africa
- 4.6. Rest of Middle East & Africa
-
5. Asia Pacific
- 5.1. China
- 5.2. India
- 5.3. Japan
- 5.4. South Korea
- 5.5. ASEAN
- 5.6. Oceania
- 5.7. Rest of Asia Pacific
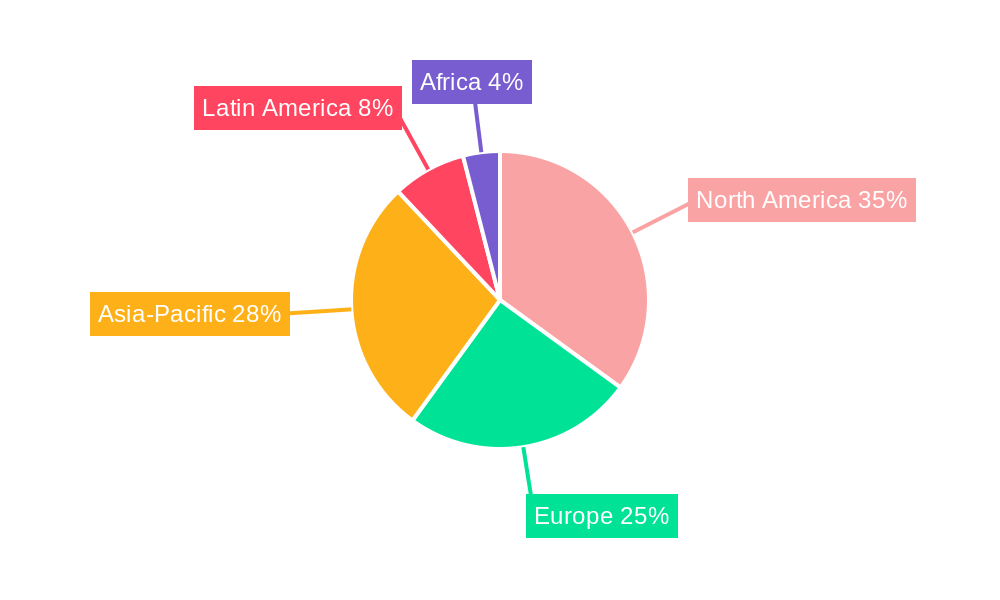
Chicken Products Regional Market Share
Geographic Coverage of Chicken Products
Chicken Products REPORT HIGHLIGHTS
| Aspects | Details |
|---|---|
| Study Period | 2020-2034 |
| Base Year | 2025 |
| Estimated Year | 2026 |
| Forecast Period | 2026-2034 |
| Historical Period | 2020-2025 |
| Growth Rate | CAGR of 8.9% from 2020-2034 |
| Segmentation |
|
Table of Contents
- 1. Introduction
- 1.1. Research Scope
- 1.2. Market Segmentation
- 1.3. Research Methodology
- 1.4. Definitions and Assumptions
- 2. Executive Summary
- 2.1. Introduction
- 3. Market Dynamics
- 3.1. Introduction
- 3.2. Market Drivers
- 3.3. Market Restrains
- 3.4. Market Trends
- 4. Market Factor Analysis
- 4.1. Porters Five Forces
- 4.2. Supply/Value Chain
- 4.3. PESTEL analysis
- 4.4. Market Entropy
- 4.5. Patent/Trademark Analysis
- 5. Global Chicken Products Analysis, Insights and Forecast, 2020-2032
- 5.1. Market Analysis, Insights and Forecast - by Application
- 5.1.1. Food Services
- 5.1.2. Retail
- 5.2. Market Analysis, Insights and Forecast - by Type
- 5.2.1. Frozen Chicken Products
- 5.2.2. Deli Chicken Products
- 5.2.3. Others
- 5.3. Market Analysis, Insights and Forecast - by Region
- 5.3.1. North America
- 5.3.2. South America
- 5.3.3. Europe
- 5.3.4. Middle East & Africa
- 5.3.5. Asia Pacific
- 5.1. Market Analysis, Insights and Forecast - by Application
- 6. North America Chicken Products Analysis, Insights and Forecast, 2020-2032
- 6.1. Market Analysis, Insights and Forecast - by Application
- 6.1.1. Food Services
- 6.1.2. Retail
- 6.2. Market Analysis, Insights and Forecast - by Type
- 6.2.1. Frozen Chicken Products
- 6.2.2. Deli Chicken Products
- 6.2.3. Others
- 6.1. Market Analysis, Insights and Forecast - by Application
- 7. South America Chicken Products Analysis, Insights and Forecast, 2020-2032
- 7.1. Market Analysis, Insights and Forecast - by Application
- 7.1.1. Food Services
- 7.1.2. Retail
- 7.2. Market Analysis, Insights and Forecast - by Type
- 7.2.1. Frozen Chicken Products
- 7.2.2. Deli Chicken Products
- 7.2.3. Others
- 7.1. Market Analysis, Insights and Forecast - by Application
- 8. Europe Chicken Products Analysis, Insights and Forecast, 2020-2032
- 8.1. Market Analysis, Insights and Forecast - by Application
- 8.1.1. Food Services
- 8.1.2. Retail
- 8.2. Market Analysis, Insights and Forecast - by Type
- 8.2.1. Frozen Chicken Products
- 8.2.2. Deli Chicken Products
- 8.2.3. Others
- 8.1. Market Analysis, Insights and Forecast - by Application
- 9. Middle East & Africa Chicken Products Analysis, Insights and Forecast, 2020-2032
- 9.1. Market Analysis, Insights and Forecast - by Application
- 9.1.1. Food Services
- 9.1.2. Retail
- 9.2. Market Analysis, Insights and Forecast - by Type
- 9.2.1. Frozen Chicken Products
- 9.2.2. Deli Chicken Products
- 9.2.3. Others
- 9.1. Market Analysis, Insights and Forecast - by Application
- 10. Asia Pacific Chicken Products Analysis, Insights and Forecast, 2020-2032
- 10.1. Market Analysis, Insights and Forecast - by Application
- 10.1.1. Food Services
- 10.1.2. Retail
- 10.2. Market Analysis, Insights and Forecast - by Type
- 10.2.1. Frozen Chicken Products
- 10.2.2. Deli Chicken Products
- 10.2.3. Others
- 10.1. Market Analysis, Insights and Forecast - by Application
- 11. Competitive Analysis
- 11.1. Global Market Share Analysis 2025
- 11.2. Company Profiles
- 11.2.1 Cargill Meat Solutions
- 11.2.1.1. Overview
- 11.2.1.2. Products
- 11.2.1.3. SWOT Analysis
- 11.2.1.4. Recent Developments
- 11.2.1.5. Financials (Based on Availability)
- 11.2.2 Tyson
- 11.2.2.1. Overview
- 11.2.2.2. Products
- 11.2.2.3. SWOT Analysis
- 11.2.2.4. Recent Developments
- 11.2.2.5. Financials (Based on Availability)
- 11.2.3 OSI Group
- 11.2.3.1. Overview
- 11.2.3.2. Products
- 11.2.3.3. SWOT Analysis
- 11.2.3.4. Recent Developments
- 11.2.3.5. Financials (Based on Availability)
- 11.2.4 Hormel
- 11.2.4.1. Overview
- 11.2.4.2. Products
- 11.2.4.3. SWOT Analysis
- 11.2.4.4. Recent Developments
- 11.2.4.5. Financials (Based on Availability)
- 11.2.5 Perdue Farms
- 11.2.5.1. Overview
- 11.2.5.2. Products
- 11.2.5.3. SWOT Analysis
- 11.2.5.4. Recent Developments
- 11.2.5.5. Financials (Based on Availability)
- 11.2.6 Koch Foods
- 11.2.6.1. Overview
- 11.2.6.2. Products
- 11.2.6.3. SWOT Analysis
- 11.2.6.4. Recent Developments
- 11.2.6.5. Financials (Based on Availability)
- 11.2.7 Sanderson Farm
- 11.2.7.1. Overview
- 11.2.7.2. Products
- 11.2.7.3. SWOT Analysis
- 11.2.7.4. Recent Developments
- 11.2.7.5. Financials (Based on Availability)
- 11.2.8 Keystone Foods
- 11.2.8.1. Overview
- 11.2.8.2. Products
- 11.2.8.3. SWOT Analysis
- 11.2.8.4. Recent Developments
- 11.2.8.5. Financials (Based on Availability)
- 11.2.9 JBS USA Holdings
- 11.2.9.1. Overview
- 11.2.9.2. Products
- 11.2.9.3. SWOT Analysis
- 11.2.9.4. Recent Developments
- 11.2.9.5. Financials (Based on Availability)
- 11.2.10 BRF S.A.
- 11.2.10.1. Overview
- 11.2.10.2. Products
- 11.2.10.3. SWOT Analysis
- 11.2.10.4. Recent Developments
- 11.2.10.5. Financials (Based on Availability)
- 11.2.11 Mountaire Farms
- 11.2.11.1. Overview
- 11.2.11.2. Products
- 11.2.11.3. SWOT Analysis
- 11.2.11.4. Recent Developments
- 11.2.11.5. Financials (Based on Availability)
- 11.2.12 Shangdong Xiantan
- 11.2.12.1. Overview
- 11.2.12.2. Products
- 11.2.12.3. SWOT Analysis
- 11.2.12.4. Recent Developments
- 11.2.12.5. Financials (Based on Availability)
- 11.2.13 Minhe Animal Husbandry
- 11.2.13.1. Overview
- 11.2.13.2. Products
- 11.2.13.3. SWOT Analysis
- 11.2.13.4. Recent Developments
- 11.2.13.5. Financials (Based on Availability)
- 11.2.14 Sunner Development
- 11.2.14.1. Overview
- 11.2.14.2. Products
- 11.2.14.3. SWOT Analysis
- 11.2.14.4. Recent Developments
- 11.2.14.5. Financials (Based on Availability)
- 11.2.15 DaChan Food
- 11.2.15.1. Overview
- 11.2.15.2. Products
- 11.2.15.3. SWOT Analysis
- 11.2.15.4. Recent Developments
- 11.2.15.5. Financials (Based on Availability)
- 11.2.1 Cargill Meat Solutions
List of Figures
- Figure 1: Global Chicken Products Revenue Breakdown (billion, %) by Region 2025 & 2033
- Figure 2: North America Chicken Products Revenue (billion), by Application 2025 & 2033
- Figure 3: North America Chicken Products Revenue Share (%), by Application 2025 & 2033
- Figure 4: North America Chicken Products Revenue (billion), by Type 2025 & 2033
- Figure 5: North America Chicken Products Revenue Share (%), by Type 2025 & 2033
- Figure 6: North America Chicken Products Revenue (billion), by Country 2025 & 2033
- Figure 7: North America Chicken Products Revenue Share (%), by Country 2025 & 2033
- Figure 8: South America Chicken Products Revenue (billion), by Application 2025 & 2033
- Figure 9: South America Chicken Products Revenue Share (%), by Application 2025 & 2033
- Figure 10: South America Chicken Products Revenue (billion), by Type 2025 & 2033
- Figure 11: South America Chicken Products Revenue Share (%), by Type 2025 & 2033
- Figure 12: South America Chicken Products Revenue (billion), by Country 2025 & 2033
- Figure 13: South America Chicken Products Revenue Share (%), by Country 2025 & 2033
- Figure 14: Europe Chicken Products Revenue (billion), by Application 2025 & 2033
- Figure 15: Europe Chicken Products Revenue Share (%), by Application 2025 & 2033
- Figure 16: Europe Chicken Products Revenue (billion), by Type 2025 & 2033
- Figure 17: Europe Chicken Products Revenue Share (%), by Type 2025 & 2033
- Figure 18: Europe Chicken Products Revenue (billion), by Country 2025 & 2033
- Figure 19: Europe Chicken Products Revenue Share (%), by Country 2025 & 2033
- Figure 20: Middle East & Africa Chicken Products Revenue (billion), by Application 2025 & 2033
- Figure 21: Middle East & Africa Chicken Products Revenue Share (%), by Application 2025 & 2033
- Figure 22: Middle East & Africa Chicken Products Revenue (billion), by Type 2025 & 2033
- Figure 23: Middle East & Africa Chicken Products Revenue Share (%), by Type 2025 & 2033
- Figure 24: Middle East & Africa Chicken Products Revenue (billion), by Country 2025 & 2033
- Figure 25: Middle East & Africa Chicken Products Revenue Share (%), by Country 2025 & 2033
- Figure 26: Asia Pacific Chicken Products Revenue (billion), by Application 2025 & 2033
- Figure 27: Asia Pacific Chicken Products Revenue Share (%), by Application 2025 & 2033
- Figure 28: Asia Pacific Chicken Products Revenue (billion), by Type 2025 & 2033
- Figure 29: Asia Pacific Chicken Products Revenue Share (%), by Type 2025 & 2033
- Figure 30: Asia Pacific Chicken Products Revenue (billion), by Country 2025 & 2033
- Figure 31: Asia Pacific Chicken Products Revenue Share (%), by Country 2025 & 2033
List of Tables
- Table 1: Global Chicken Products Revenue billion Forecast, by Application 2020 & 2033
- Table 2: Global Chicken Products Revenue billion Forecast, by Type 2020 & 2033
- Table 3: Global Chicken Products Revenue billion Forecast, by Region 2020 & 2033
- Table 4: Global Chicken Products Revenue billion Forecast, by Application 2020 & 2033
- Table 5: Global Chicken Products Revenue billion Forecast, by Type 2020 & 2033
- Table 6: Global Chicken Products Revenue billion Forecast, by Country 2020 & 2033
- Table 7: United States Chicken Products Revenue (billion) Forecast, by Application 2020 & 2033
- Table 8: Canada Chicken Products Revenue (billion) Forecast, by Application 2020 & 2033
- Table 9: Mexico Chicken Products Revenue (billion) Forecast, by Application 2020 & 2033
- Table 10: Global Chicken Products Revenue billion Forecast, by Application 2020 & 2033
- Table 11: Global Chicken Products Revenue billion Forecast, by Type 2020 & 2033
- Table 12: Global Chicken Products Revenue billion Forecast, by Country 2020 & 2033
- Table 13: Brazil Chicken Products Revenue (billion) Forecast, by Application 2020 & 2033
- Table 14: Argentina Chicken Products Revenue (billion) Forecast, by Application 2020 & 2033
- Table 15: Rest of South America Chicken Products Revenue (billion) Forecast, by Application 2020 & 2033
- Table 16: Global Chicken Products Revenue billion Forecast, by Application 2020 & 2033
- Table 17: Global Chicken Products Revenue billion Forecast, by Type 2020 & 2033
- Table 18: Global Chicken Products Revenue billion Forecast, by Country 2020 & 2033
- Table 19: United Kingdom Chicken Products Revenue (billion) Forecast, by Application 2020 & 2033
- Table 20: Germany Chicken Products Revenue (billion) Forecast, by Application 2020 & 2033
- Table 21: France Chicken Products Revenue (billion) Forecast, by Application 2020 & 2033
- Table 22: Italy Chicken Products Revenue (billion) Forecast, by Application 2020 & 2033
- Table 23: Spain Chicken Products Revenue (billion) Forecast, by Application 2020 & 2033
- Table 24: Russia Chicken Products Revenue (billion) Forecast, by Application 2020 & 2033
- Table 25: Benelux Chicken Products Revenue (billion) Forecast, by Application 2020 & 2033
- Table 26: Nordics Chicken Products Revenue (billion) Forecast, by Application 2020 & 2033
- Table 27: Rest of Europe Chicken Products Revenue (billion) Forecast, by Application 2020 & 2033
- Table 28: Global Chicken Products Revenue billion Forecast, by Application 2020 & 2033
- Table 29: Global Chicken Products Revenue billion Forecast, by Type 2020 & 2033
- Table 30: Global Chicken Products Revenue billion Forecast, by Country 2020 & 2033
- Table 31: Turkey Chicken Products Revenue (billion) Forecast, by Application 2020 & 2033
- Table 32: Israel Chicken Products Revenue (billion) Forecast, by Application 2020 & 2033
- Table 33: GCC Chicken Products Revenue (billion) Forecast, by Application 2020 & 2033
- Table 34: North Africa Chicken Products Revenue (billion) Forecast, by Application 2020 & 2033
- Table 35: South Africa Chicken Products Revenue (billion) Forecast, by Application 2020 & 2033
- Table 36: Rest of Middle East & Africa Chicken Products Revenue (billion) Forecast, by Application 2020 & 2033
- Table 37: Global Chicken Products Revenue billion Forecast, by Application 2020 & 2033
- Table 38: Global Chicken Products Revenue billion Forecast, by Type 2020 & 2033
- Table 39: Global Chicken Products Revenue billion Forecast, by Country 2020 & 2033
- Table 40: China Chicken Products Revenue (billion) Forecast, by Application 2020 & 2033
- Table 41: India Chicken Products Revenue (billion) Forecast, by Application 2020 & 2033
- Table 42: Japan Chicken Products Revenue (billion) Forecast, by Application 2020 & 2033
- Table 43: South Korea Chicken Products Revenue (billion) Forecast, by Application 2020 & 2033
- Table 44: ASEAN Chicken Products Revenue (billion) Forecast, by Application 2020 & 2033
- Table 45: Oceania Chicken Products Revenue (billion) Forecast, by Application 2020 & 2033
- Table 46: Rest of Asia Pacific Chicken Products Revenue (billion) Forecast, by Application 2020 & 2033
Frequently Asked Questions
1. What is the projected Compound Annual Growth Rate (CAGR) of the Chicken Products?
The projected CAGR is approximately 8.9%.
2. Which companies are prominent players in the Chicken Products?
Key companies in the market include Cargill Meat Solutions, Tyson, OSI Group, Hormel, Perdue Farms, Koch Foods, Sanderson Farm, Keystone Foods, JBS USA Holdings, BRF S.A., Mountaire Farms, Shangdong Xiantan, Minhe Animal Husbandry, Sunner Development, DaChan Food.
3. What are the main segments of the Chicken Products?
The market segments include Application, Type.
4. Can you provide details about the market size?
The market size is estimated to be USD 50.5 billion as of 2022.
5. What are some drivers contributing to market growth?
N/A
6. What are the notable trends driving market growth?
N/A
7. Are there any restraints impacting market growth?
N/A
8. Can you provide examples of recent developments in the market?
N/A
9. What pricing options are available for accessing the report?
Pricing options include single-user, multi-user, and enterprise licenses priced at USD 2900.00, USD 4350.00, and USD 5800.00 respectively.
10. Is the market size provided in terms of value or volume?
The market size is provided in terms of value, measured in billion.
11. Are there any specific market keywords associated with the report?
Yes, the market keyword associated with the report is "Chicken Products," which aids in identifying and referencing the specific market segment covered.
12. How do I determine which pricing option suits my needs best?
The pricing options vary based on user requirements and access needs. Individual users may opt for single-user licenses, while businesses requiring broader access may choose multi-user or enterprise licenses for cost-effective access to the report.
13. Are there any additional resources or data provided in the Chicken Products report?
While the report offers comprehensive insights, it's advisable to review the specific contents or supplementary materials provided to ascertain if additional resources or data are available.
14. How can I stay updated on further developments or reports in the Chicken Products?
To stay informed about further developments, trends, and reports in the Chicken Products, consider subscribing to industry newsletters, following relevant companies and organizations, or regularly checking reputable industry news sources and publications.
Methodology
Step 1 - Identification of Relevant Samples Size from Population Database


Step 2 - Approaches for Defining Global Market Size (Value, Volume* & Price*)

Note*: In applicable scenarios
Step 3 - Data Sources
Primary Research
- Web Analytics
- Survey Reports
- Research Institute
- Latest Research Reports
- Opinion Leaders
Secondary Research
- Annual Reports
- White Paper
- Latest Press Release
- Industry Association
- Paid Database
- Investor Presentations

Step 4 - Data Triangulation
Involves using different sources of information in order to increase the validity of a study
These sources are likely to be stakeholders in a program - participants, other researchers, program staff, other community members, and so on.
Then we put all data in single framework & apply various statistical tools to find out the dynamic on the market.
During the analysis stage, feedback from the stakeholder groups would be compared to determine areas of agreement as well as areas of divergence