

Key Insights
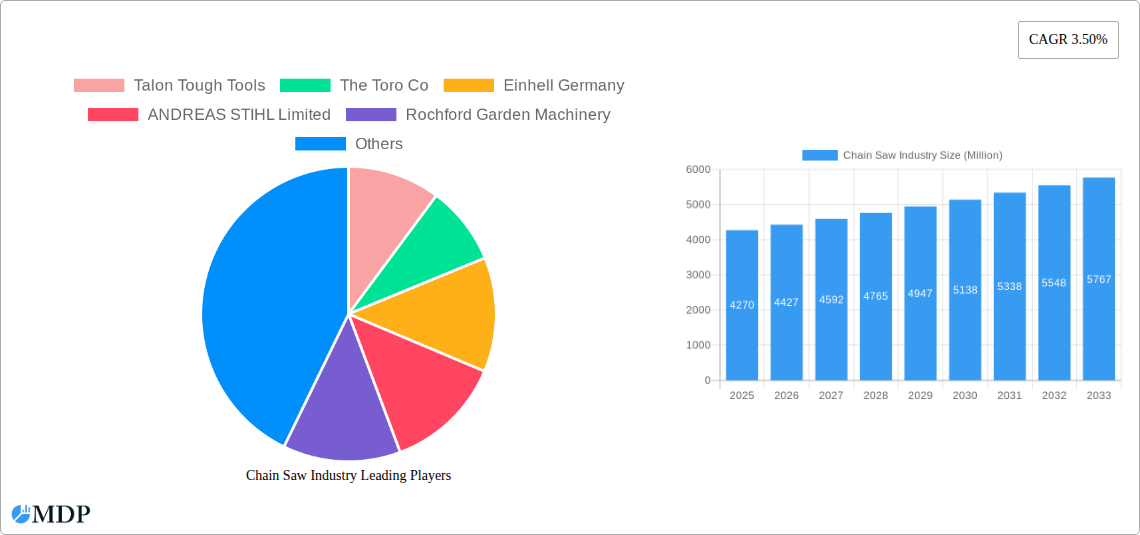
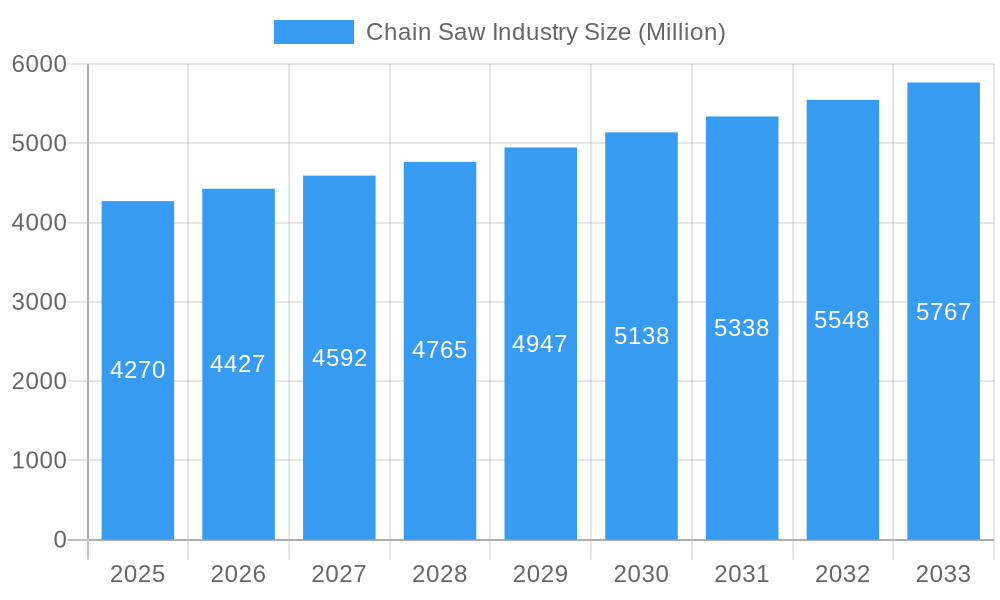
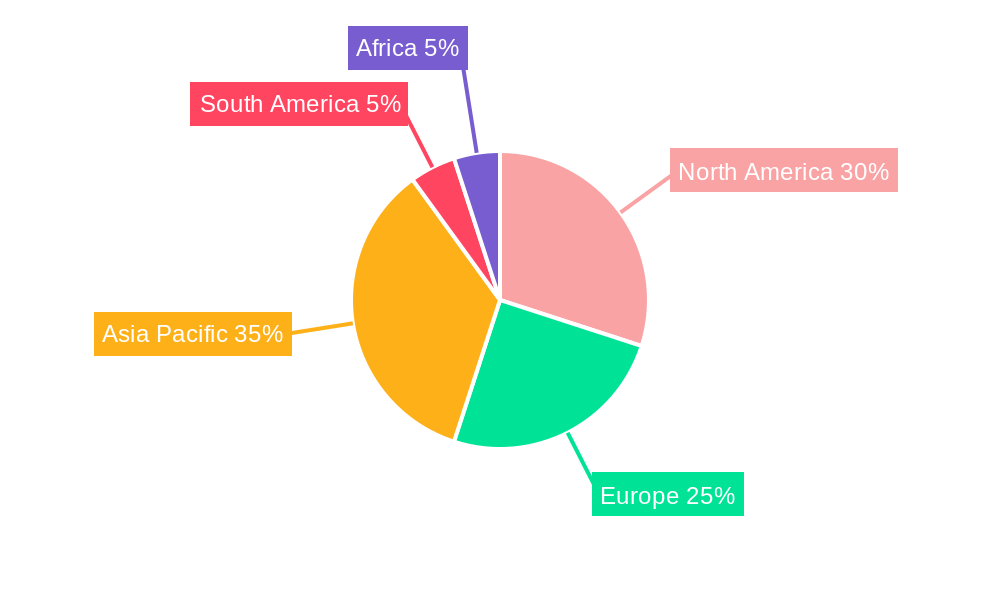
The global chainsaw market, valued at $4.27 billion in 2025, is projected to experience steady growth, driven by a Compound Annual Growth Rate (CAGR) of 3.5% from 2025 to 2033. This growth is fueled by several key factors. Increasing urbanization and infrastructure development, particularly in developing economies, are boosting demand for chainsaws in construction and forestry. Simultaneously, rising consumer interest in landscaping and home improvement projects contributes to the residential segment's expansion. The shift towards more efficient and environmentally friendly power sources, like electric and battery-powered chainsaws, is another significant driver. These models offer reduced emissions and quieter operation, appealing to environmentally conscious consumers and those in noise-sensitive areas. However, the market also faces restraints, including fluctuating raw material prices (particularly for steel and plastics used in manufacturing) and stringent environmental regulations concerning emissions and noise pollution in various regions. Market segmentation reveals a strong preference for gas-powered chainsaws in professional and industrial applications, due to their power and durability. However, the electric and battery-powered segments are experiencing rapid growth, driven by technological advancements leading to improved performance and longer battery life. The Asia-Pacific region, fueled by significant infrastructure projects and a growing middle class, is expected to showcase substantial growth in chainsaw demand. North America and Europe, while exhibiting mature markets, will continue contributing steadily to overall sales, bolstered by consistent demand from professional users and ongoing home improvement projects.
Chain Saw Industry Market Size (In Billion)
The competitive landscape is characterized by a mix of established international players and regional manufacturers. Major companies like Stihl, Husqvarna, and Toro dominate the market through their strong brand recognition, extensive distribution networks, and continuous innovation in product design and technology. However, several regional players are gaining traction by offering competitive pricing and catering to specific regional needs. Future growth will depend on companies’ ability to adapt to evolving consumer preferences, such as focusing on lightweight designs, enhanced safety features, and improved ergonomics. Strategic partnerships, technological advancements, and expansion into emerging markets will play a crucial role in shaping the competitive landscape of the coming decade. Focus on sustainability and eco-friendly production processes will become increasingly important, shaping the future of the chainsaw industry.
Chain Saw Industry Company Market Share
Chain Saw Industry Market Report: 2019-2033
This comprehensive report provides a detailed analysis of the global chain saw industry, covering market dynamics, leading players, technological advancements, and future growth prospects. The study period spans from 2019 to 2033, with a base year of 2025 and a forecast period from 2025 to 2033. The report is essential for industry stakeholders, investors, and businesses seeking to understand the current landscape and future trends of this dynamic market, which is projected to be worth xx Million by 2033.
Chain Saw Industry Market Dynamics & Concentration
The global chain saw market is characterized by a moderately concentrated landscape, with a few major players holding significant market share. Market concentration is influenced by factors including brand recognition, technological innovation, and global distribution networks. The market share of the top five players is estimated to be around xx%, with Andreas Stihl and Husqvarna holding the largest shares. Innovation, driven by the need for increased efficiency, reduced emissions, and enhanced safety features, is a key driver. Stringent environmental regulations concerning emissions and noise levels are shaping the industry's trajectory. The market also faces competition from alternative tools for tree trimming and woodcutting. Consolidation through mergers and acquisitions (M&A) is another noticeable trend, with xx M&A deals recorded between 2019 and 2024.
- Market Concentration: Top 5 players hold approximately xx% market share.
- Innovation Drivers: Demand for higher efficiency, reduced emissions, improved safety.
- Regulatory Frameworks: Stringent environmental regulations impacting product design and emissions.
- Product Substitutes: Alternative tree trimming and woodcutting tools pose competitive pressure.
- End-User Trends: Growing preference for battery-powered and lightweight chainsaws.
- M&A Activities: xx M&A deals recorded between 2019 and 2024, indicating industry consolidation.
Chain Saw Industry Industry Trends & Analysis
The chain saw market is experiencing robust and sustained growth, propelled by the accelerating pace of urbanization, a surge in demand for comprehensive construction and landscaping services, and a pronounced consumer shift towards the convenience and environmental benefits of cordless models. This sector is undergoing a significant technological transformation, marked by the introduction of advanced battery-powered chainsaws that rival, and in some cases surpass, the performance of traditional gas-powered counterparts, all while offering reduced emissions. Consumers are increasingly prioritizing lighter, quieter, and more eco-conscious alternatives. The competitive landscape remains dynamic and intense, with industry leaders strategically focusing on product differentiation through pioneering technological innovations, the integration of enhanced safety features, and the pursuit of an optimized user experience. For the projected forecast period of 2025-2033, the market is expected to achieve a Compound Annual Growth Rate (CAGR) of [Insert Specific CAGR Here]%, with battery-powered chainsaws anticipated to capture the highest market penetration rate due to their compelling advantages.
Leading Markets & Segments in Chain Saw Industry
Currently, the North American region spearheads the global chain saw market, largely attributed to its flourishing construction industry and extensive landscaping activities. Among product categories, gas-powered chainsaws continue to hold a dominant position due to their inherent superior power output. However, the battery-powered chainsaw segment is exhibiting the most accelerated growth trajectory, fueled by significant advancements in battery technology and a growing collective awareness of environmental imperatives. In terms of applications, the residential sector commands the largest market share, while the industrial segment demonstrates promising moderate growth potential.
- Key Drivers for North American Dominance: A thriving construction industry, a substantial residential market, and high levels of disposable income contribute significantly to this region's leadership.
- Gas-powered Chainsaws: Their unparalleled power output ensures their continued market dominance in applications requiring maximum performance.
- Battery-powered Chainsaws: This segment is experiencing the most rapid expansion, driven by cutting-edge technological developments and increasing environmental consciousness.
- Residential Application: This segment is the largest due to consistent consumer demand for home improvement, gardening, and landscaping projects.
- Industrial Application: Steady growth is observed in this segment, primarily driven by ongoing activities in forestry management and large-scale construction projects.
Chain Saw Industry Product Developments
Recent product innovations include the integration of advanced battery technology, improved safety features like chain brakes and kickback reduction systems, and the development of quieter and more environmentally friendly engines. These advancements target a growing consumer preference for lighter, easier-to-use, and environmentally responsible equipment. The incorporation of smart features, such as Bluetooth connectivity for monitoring and maintenance, is becoming increasingly common.
Key Drivers of Chain Saw Industry Growth
The chain saw industry's expansion is being propelled by a confluence of powerful factors. Ongoing technological breakthroughs in battery technology, coupled with refined engine designs, are consistently yielding chainsaws that are not only more efficient and powerful but also demonstrably more environmentally friendly. The robust growth witnessed in the construction and landscaping sectors directly translates into increased demand for chain saw equipment. Furthermore, a heightened consumer interest in undertaking home improvement projects and engaging in outdoor recreational activities is proving to be a substantial catalyst for market growth. Complementing these trends, government mandates and initiatives that champion sustainable practices are further bolstering the industry's upward trajectory.
Challenges in the Chain Saw Industry Market
The chain saw industry faces various challenges, including increasing raw material costs, fluctuations in global supply chains, stringent environmental regulations leading to higher production costs, and intense competition from established and emerging players. These factors can impact profit margins and product pricing, demanding manufacturers' agility and innovation to navigate the market effectively. The approximate impact of these challenges on the industry is predicted to be a reduction of xx Million in revenue by 2033.
Emerging Opportunities in Chain Saw Industry
Significant long-term growth potential exists in the chain saw industry. The expansion of the battery-powered segment, driven by continuous innovation, offers a substantial opportunity. Strategic partnerships for technological collaborations, along with targeted market expansion into developing economies, represent additional avenues for growth.
Leading Players in the Chain Saw Industry Sector
- ANDREAS STIHL Limited
- Husqvarna AB
- The Toro Co
- Robert Bosch GmbH
- Stanley Black & Decker Inc
- Hitachi Ltd
- Talon Tough Tools
- Einhell Germany
- Rochford Garden Machinery
- SUMEC Group Corporation
- AL-KO Kober
- STIGA SpA
- Emak SPA
- Yamabiko Corp
- Blount International Inc
Key Milestones in Chain Saw Industry Industry
- April 2023: Husqvarna made a significant technological leap with the launch of the T542i XP® and 542i XP®, the world's first battery-powered chainsaws equipped with a clutch. This innovation represents a pivotal advancement in battery technology, directly challenging the long-standing dominance of gas-powered models.
- May 2023: Robert Bosch GmbH enhanced its cordless offerings by introducing the AdvancedChain 36V-35-40, a new, sophisticated cordless chainsaw. This launch further intensifies competition within the rapidly evolving cordless segment of the market.
Strategic Outlook for Chain Saw Industry Market
The chain saw market is poised for substantial future expansion, fueled by persistent technological innovation, a broadening spectrum of demand across diverse industries, and the escalating adoption rates of advanced battery-powered models. To effectively capitalize on these growth opportunities and maximize market potential in the coming years, strategic investments in research and development, meticulously crafted marketing campaigns that emphasize sustainability and user-centric benefits, and proactive expansion into burgeoning emerging markets will be paramount for all stakeholders within the industry.
Chain Saw Industry Segmentation
- 1. Production Analysis
- 2. Consumption Analysis
- 3. Import Market Analysis (Value & Volume)
- 4. Export Market Analysis (Value & Volume)
- 5. Price Trend Analysis
Chain Saw Industry Segmentation By Geography
-
1. North America
- 1.1. United States
- 1.2. Canada
- 1.3. Mexico
-
2. South America
- 2.1. Brazil
- 2.2. Argentina
- 2.3. Rest of South America
-
3. Europe
- 3.1. United Kingdom
- 3.2. Germany
- 3.3. France
- 3.4. Italy
- 3.5. Spain
- 3.6. Russia
- 3.7. Benelux
- 3.8. Nordics
- 3.9. Rest of Europe
-
4. Middle East & Africa
- 4.1. Turkey
- 4.2. Israel
- 4.3. GCC
- 4.4. North Africa
- 4.5. South Africa
- 4.6. Rest of Middle East & Africa
-
5. Asia Pacific
- 5.1. China
- 5.2. India
- 5.3. Japan
- 5.4. South Korea
- 5.5. ASEAN
- 5.6. Oceania
- 5.7. Rest of Asia Pacific
Chain Saw Industry Regional Market Share
Geographic Coverage of Chain Saw Industry
Chain Saw Industry REPORT HIGHLIGHTS
| Aspects | Details |
|---|---|
| Study Period | 2020-2034 |
| Base Year | 2025 |
| Estimated Year | 2026 |
| Forecast Period | 2026-2034 |
| Historical Period | 2020-2025 |
| Growth Rate | CAGR of 3.50% from 2020-2034 |
| Segmentation |
|
Table of Contents
- 1. Introduction
- 1.1. Research Scope
- 1.2. Market Segmentation
- 1.3. Research Objective
- 1.4. Definitions and Assumptions
- 2. Executive Summary
- 2.1. Market Snapshot
- 3. Market Dynamics
- 3.1. Market Drivers
- 3.2. Market Restrains
- 3.3. Market Trends
- 3.4. Market Opportunities
- 4. Market Factor Analysis
- 4.1. Porters Five Forces
- 4.1.1. Bargaining Power of Suppliers
- 4.1.2. Bargaining Power of Buyers
- 4.1.3. Threat of New Entrants
- 4.1.4. Threat of Substitutes
- 4.1.5. Competitive Rivalry
- 4.2. PESTEL analysis
- 4.3. BCG Analysis
- 4.3.1. Stars (High Growth, High Market Share)
- 4.3.2. Cash Cows (Low Growth, High Market Share)
- 4.3.3. Question Mark (High Growth, Low Market Share)
- 4.3.4. Dogs (Low Growth, Low Market Share)
- 4.4. Ansoff Matrix Analysis
- 4.5. Supply Chain Analysis
- 4.6. Regulatory Landscape
- 4.7. Current Market Potential and Opportunity Assessment (TAM–SAM–SOM Framework)
- 4.8. MDP Analyst Note
- 4.1. Porters Five Forces
- 5. Market Analysis, Insights and Forecast 2021-2033
- 5.1. Market Analysis, Insights and Forecast - by Production Analysis
- 5.2. Market Analysis, Insights and Forecast - by Consumption Analysis
- 5.3. Market Analysis, Insights and Forecast - by Import Market Analysis (Value & Volume)
- 5.4. Market Analysis, Insights and Forecast - by Export Market Analysis (Value & Volume)
- 5.5. Market Analysis, Insights and Forecast - by Price Trend Analysis
- 5.6. Market Analysis, Insights and Forecast - by Region
- 5.6.1. North America
- 5.6.2. South America
- 5.6.3. Europe
- 5.6.4. Middle East & Africa
- 5.6.5. Asia Pacific
- 6. Global Chain Saw Industry Analysis, Insights and Forecast, 2021-2033
- 6.1. Market Analysis, Insights and Forecast - by Production Analysis
- 6.2. Market Analysis, Insights and Forecast - by Consumption Analysis
- 6.3. Market Analysis, Insights and Forecast - by Import Market Analysis (Value & Volume)
- 6.4. Market Analysis, Insights and Forecast - by Export Market Analysis (Value & Volume)
- 6.5. Market Analysis, Insights and Forecast - by Price Trend Analysis
- 7. North America Chain Saw Industry Analysis, Insights and Forecast, 2020-2032
- 7.1. Market Analysis, Insights and Forecast - by Production Analysis
- 7.2. Market Analysis, Insights and Forecast - by Consumption Analysis
- 7.3. Market Analysis, Insights and Forecast - by Import Market Analysis (Value & Volume)
- 7.4. Market Analysis, Insights and Forecast - by Export Market Analysis (Value & Volume)
- 7.5. Market Analysis, Insights and Forecast - by Price Trend Analysis
- 8. South America Chain Saw Industry Analysis, Insights and Forecast, 2020-2032
- 8.1. Market Analysis, Insights and Forecast - by Production Analysis
- 8.2. Market Analysis, Insights and Forecast - by Consumption Analysis
- 8.3. Market Analysis, Insights and Forecast - by Import Market Analysis (Value & Volume)
- 8.4. Market Analysis, Insights and Forecast - by Export Market Analysis (Value & Volume)
- 8.5. Market Analysis, Insights and Forecast - by Price Trend Analysis
- 9. Europe Chain Saw Industry Analysis, Insights and Forecast, 2020-2032
- 9.1. Market Analysis, Insights and Forecast - by Production Analysis
- 9.2. Market Analysis, Insights and Forecast - by Consumption Analysis
- 9.3. Market Analysis, Insights and Forecast - by Import Market Analysis (Value & Volume)
- 9.4. Market Analysis, Insights and Forecast - by Export Market Analysis (Value & Volume)
- 9.5. Market Analysis, Insights and Forecast - by Price Trend Analysis
- 10. Middle East & Africa Chain Saw Industry Analysis, Insights and Forecast, 2020-2032
- 10.1. Market Analysis, Insights and Forecast - by Production Analysis
- 10.2. Market Analysis, Insights and Forecast - by Consumption Analysis
- 10.3. Market Analysis, Insights and Forecast - by Import Market Analysis (Value & Volume)
- 10.4. Market Analysis, Insights and Forecast - by Export Market Analysis (Value & Volume)
- 10.5. Market Analysis, Insights and Forecast - by Price Trend Analysis
- 11. Asia Pacific Chain Saw Industry Analysis, Insights and Forecast, 2020-2032
- 11.1. Market Analysis, Insights and Forecast - by Production Analysis
- 11.2. Market Analysis, Insights and Forecast - by Consumption Analysis
- 11.3. Market Analysis, Insights and Forecast - by Import Market Analysis (Value & Volume)
- 11.4. Market Analysis, Insights and Forecast - by Export Market Analysis (Value & Volume)
- 11.5. Market Analysis, Insights and Forecast - by Price Trend Analysis
- 12. Competitive Analysis
- 12.1. Company Profiles
- 12.1.1 Talon Tough Tools
- 12.1.1.1. Company Overview
- 12.1.1.2. Products
- 12.1.1.3. Company Financials
- 12.1.1.4. SWOT Analysis
- 12.1.2 The Toro Co
- 12.1.2.1. Company Overview
- 12.1.2.2. Products
- 12.1.2.3. Company Financials
- 12.1.2.4. SWOT Analysis
- 12.1.3 Einhell Germany
- 12.1.3.1. Company Overview
- 12.1.3.2. Products
- 12.1.3.3. Company Financials
- 12.1.3.4. SWOT Analysis
- 12.1.4 ANDREAS STIHL Limited
- 12.1.4.1. Company Overview
- 12.1.4.2. Products
- 12.1.4.3. Company Financials
- 12.1.4.4. SWOT Analysis
- 12.1.5 Rochford Garden Machinery
- 12.1.5.1. Company Overview
- 12.1.5.2. Products
- 12.1.5.3. Company Financials
- 12.1.5.4. SWOT Analysis
- 12.1.6 Robert Bosch GmbH
- 12.1.6.1. Company Overview
- 12.1.6.2. Products
- 12.1.6.3. Company Financials
- 12.1.6.4. SWOT Analysis
- 12.1.7 SUMEC Group Corporation
- 12.1.7.1. Company Overview
- 12.1.7.2. Products
- 12.1.7.3. Company Financials
- 12.1.7.4. SWOT Analysis
- 12.1.8 AL-KO Kober
- 12.1.8.1. Company Overview
- 12.1.8.2. Products
- 12.1.8.3. Company Financials
- 12.1.8.4. SWOT Analysis
- 12.1.9 STIGA SpA
- 12.1.9.1. Company Overview
- 12.1.9.2. Products
- 12.1.9.3. Company Financials
- 12.1.9.4. SWOT Analysis
- 12.1.10 Emak SPA
- 12.1.10.1. Company Overview
- 12.1.10.2. Products
- 12.1.10.3. Company Financials
- 12.1.10.4. SWOT Analysis
- 12.1.11 Yamabiko Corp
- 12.1.11.1. Company Overview
- 12.1.11.2. Products
- 12.1.11.3. Company Financials
- 12.1.11.4. SWOT Analysis
- 12.1.12 Stanley Black & Decker Inc
- 12.1.12.1. Company Overview
- 12.1.12.2. Products
- 12.1.12.3. Company Financials
- 12.1.12.4. SWOT Analysis
- 12.1.13 Hitachi Ltd
- 12.1.13.1. Company Overview
- 12.1.13.2. Products
- 12.1.13.3. Company Financials
- 12.1.13.4. SWOT Analysis
- 12.1.14 Husqvarna AB
- 12.1.14.1. Company Overview
- 12.1.14.2. Products
- 12.1.14.3. Company Financials
- 12.1.14.4. SWOT Analysis
- 12.1.15 Blount International Inc
- 12.1.15.1. Company Overview
- 12.1.15.2. Products
- 12.1.15.3. Company Financials
- 12.1.15.4. SWOT Analysis
- 12.1.1 Talon Tough Tools
- 12.2. Market Entropy
- 12.2.1 Company's Key Areas Served
- 12.2.2 Recent Developments
- 12.3. Company Market Share Analysis 2025
- 12.3.1 Top 5 Companies Market Share Analysis
- 12.3.2 Top 3 Companies Market Share Analysis
- 12.4. List of Potential Customers
- 13. Research Methodology
List of Figures
- Figure 1: Global Chain Saw Industry Revenue Breakdown (Million, %) by Region 2025 & 2033
- Figure 2: Global Chain Saw Industry Volume Breakdown (Kiloton, %) by Region 2025 & 2033
- Figure 3: North America Chain Saw Industry Revenue (Million), by Production Analysis 2025 & 2033
- Figure 4: North America Chain Saw Industry Volume (Kiloton), by Production Analysis 2025 & 2033
- Figure 5: North America Chain Saw Industry Revenue Share (%), by Production Analysis 2025 & 2033
- Figure 6: North America Chain Saw Industry Volume Share (%), by Production Analysis 2025 & 2033
- Figure 7: North America Chain Saw Industry Revenue (Million), by Consumption Analysis 2025 & 2033
- Figure 8: North America Chain Saw Industry Volume (Kiloton), by Consumption Analysis 2025 & 2033
- Figure 9: North America Chain Saw Industry Revenue Share (%), by Consumption Analysis 2025 & 2033
- Figure 10: North America Chain Saw Industry Volume Share (%), by Consumption Analysis 2025 & 2033
- Figure 11: North America Chain Saw Industry Revenue (Million), by Import Market Analysis (Value & Volume) 2025 & 2033
- Figure 12: North America Chain Saw Industry Volume (Kiloton), by Import Market Analysis (Value & Volume) 2025 & 2033
- Figure 13: North America Chain Saw Industry Revenue Share (%), by Import Market Analysis (Value & Volume) 2025 & 2033
- Figure 14: North America Chain Saw Industry Volume Share (%), by Import Market Analysis (Value & Volume) 2025 & 2033
- Figure 15: North America Chain Saw Industry Revenue (Million), by Export Market Analysis (Value & Volume) 2025 & 2033
- Figure 16: North America Chain Saw Industry Volume (Kiloton), by Export Market Analysis (Value & Volume) 2025 & 2033
- Figure 17: North America Chain Saw Industry Revenue Share (%), by Export Market Analysis (Value & Volume) 2025 & 2033
- Figure 18: North America Chain Saw Industry Volume Share (%), by Export Market Analysis (Value & Volume) 2025 & 2033
- Figure 19: North America Chain Saw Industry Revenue (Million), by Price Trend Analysis 2025 & 2033
- Figure 20: North America Chain Saw Industry Volume (Kiloton), by Price Trend Analysis 2025 & 2033
- Figure 21: North America Chain Saw Industry Revenue Share (%), by Price Trend Analysis 2025 & 2033
- Figure 22: North America Chain Saw Industry Volume Share (%), by Price Trend Analysis 2025 & 2033
- Figure 23: North America Chain Saw Industry Revenue (Million), by Country 2025 & 2033
- Figure 24: North America Chain Saw Industry Volume (Kiloton), by Country 2025 & 2033
- Figure 25: North America Chain Saw Industry Revenue Share (%), by Country 2025 & 2033
- Figure 26: North America Chain Saw Industry Volume Share (%), by Country 2025 & 2033
- Figure 27: South America Chain Saw Industry Revenue (Million), by Production Analysis 2025 & 2033
- Figure 28: South America Chain Saw Industry Volume (Kiloton), by Production Analysis 2025 & 2033
- Figure 29: South America Chain Saw Industry Revenue Share (%), by Production Analysis 2025 & 2033
- Figure 30: South America Chain Saw Industry Volume Share (%), by Production Analysis 2025 & 2033
- Figure 31: South America Chain Saw Industry Revenue (Million), by Consumption Analysis 2025 & 2033
- Figure 32: South America Chain Saw Industry Volume (Kiloton), by Consumption Analysis 2025 & 2033
- Figure 33: South America Chain Saw Industry Revenue Share (%), by Consumption Analysis 2025 & 2033
- Figure 34: South America Chain Saw Industry Volume Share (%), by Consumption Analysis 2025 & 2033
- Figure 35: South America Chain Saw Industry Revenue (Million), by Import Market Analysis (Value & Volume) 2025 & 2033
- Figure 36: South America Chain Saw Industry Volume (Kiloton), by Import Market Analysis (Value & Volume) 2025 & 2033
- Figure 37: South America Chain Saw Industry Revenue Share (%), by Import Market Analysis (Value & Volume) 2025 & 2033
- Figure 38: South America Chain Saw Industry Volume Share (%), by Import Market Analysis (Value & Volume) 2025 & 2033
- Figure 39: South America Chain Saw Industry Revenue (Million), by Export Market Analysis (Value & Volume) 2025 & 2033
- Figure 40: South America Chain Saw Industry Volume (Kiloton), by Export Market Analysis (Value & Volume) 2025 & 2033
- Figure 41: South America Chain Saw Industry Revenue Share (%), by Export Market Analysis (Value & Volume) 2025 & 2033
- Figure 42: South America Chain Saw Industry Volume Share (%), by Export Market Analysis (Value & Volume) 2025 & 2033
- Figure 43: South America Chain Saw Industry Revenue (Million), by Price Trend Analysis 2025 & 2033
- Figure 44: South America Chain Saw Industry Volume (Kiloton), by Price Trend Analysis 2025 & 2033
- Figure 45: South America Chain Saw Industry Revenue Share (%), by Price Trend Analysis 2025 & 2033
- Figure 46: South America Chain Saw Industry Volume Share (%), by Price Trend Analysis 2025 & 2033
- Figure 47: South America Chain Saw Industry Revenue (Million), by Country 2025 & 2033
- Figure 48: South America Chain Saw Industry Volume (Kiloton), by Country 2025 & 2033
- Figure 49: South America Chain Saw Industry Revenue Share (%), by Country 2025 & 2033
- Figure 50: South America Chain Saw Industry Volume Share (%), by Country 2025 & 2033
- Figure 51: Europe Chain Saw Industry Revenue (Million), by Production Analysis 2025 & 2033
- Figure 52: Europe Chain Saw Industry Volume (Kiloton), by Production Analysis 2025 & 2033
- Figure 53: Europe Chain Saw Industry Revenue Share (%), by Production Analysis 2025 & 2033
- Figure 54: Europe Chain Saw Industry Volume Share (%), by Production Analysis 2025 & 2033
- Figure 55: Europe Chain Saw Industry Revenue (Million), by Consumption Analysis 2025 & 2033
- Figure 56: Europe Chain Saw Industry Volume (Kiloton), by Consumption Analysis 2025 & 2033
- Figure 57: Europe Chain Saw Industry Revenue Share (%), by Consumption Analysis 2025 & 2033
- Figure 58: Europe Chain Saw Industry Volume Share (%), by Consumption Analysis 2025 & 2033
- Figure 59: Europe Chain Saw Industry Revenue (Million), by Import Market Analysis (Value & Volume) 2025 & 2033
- Figure 60: Europe Chain Saw Industry Volume (Kiloton), by Import Market Analysis (Value & Volume) 2025 & 2033
- Figure 61: Europe Chain Saw Industry Revenue Share (%), by Import Market Analysis (Value & Volume) 2025 & 2033
- Figure 62: Europe Chain Saw Industry Volume Share (%), by Import Market Analysis (Value & Volume) 2025 & 2033
- Figure 63: Europe Chain Saw Industry Revenue (Million), by Export Market Analysis (Value & Volume) 2025 & 2033
- Figure 64: Europe Chain Saw Industry Volume (Kiloton), by Export Market Analysis (Value & Volume) 2025 & 2033
- Figure 65: Europe Chain Saw Industry Revenue Share (%), by Export Market Analysis (Value & Volume) 2025 & 2033
- Figure 66: Europe Chain Saw Industry Volume Share (%), by Export Market Analysis (Value & Volume) 2025 & 2033
- Figure 67: Europe Chain Saw Industry Revenue (Million), by Price Trend Analysis 2025 & 2033
- Figure 68: Europe Chain Saw Industry Volume (Kiloton), by Price Trend Analysis 2025 & 2033
- Figure 69: Europe Chain Saw Industry Revenue Share (%), by Price Trend Analysis 2025 & 2033
- Figure 70: Europe Chain Saw Industry Volume Share (%), by Price Trend Analysis 2025 & 2033
- Figure 71: Europe Chain Saw Industry Revenue (Million), by Country 2025 & 2033
- Figure 72: Europe Chain Saw Industry Volume (Kiloton), by Country 2025 & 2033
- Figure 73: Europe Chain Saw Industry Revenue Share (%), by Country 2025 & 2033
- Figure 74: Europe Chain Saw Industry Volume Share (%), by Country 2025 & 2033
- Figure 75: Middle East & Africa Chain Saw Industry Revenue (Million), by Production Analysis 2025 & 2033
- Figure 76: Middle East & Africa Chain Saw Industry Volume (Kiloton), by Production Analysis 2025 & 2033
- Figure 77: Middle East & Africa Chain Saw Industry Revenue Share (%), by Production Analysis 2025 & 2033
- Figure 78: Middle East & Africa Chain Saw Industry Volume Share (%), by Production Analysis 2025 & 2033
- Figure 79: Middle East & Africa Chain Saw Industry Revenue (Million), by Consumption Analysis 2025 & 2033
- Figure 80: Middle East & Africa Chain Saw Industry Volume (Kiloton), by Consumption Analysis 2025 & 2033
- Figure 81: Middle East & Africa Chain Saw Industry Revenue Share (%), by Consumption Analysis 2025 & 2033
- Figure 82: Middle East & Africa Chain Saw Industry Volume Share (%), by Consumption Analysis 2025 & 2033
- Figure 83: Middle East & Africa Chain Saw Industry Revenue (Million), by Import Market Analysis (Value & Volume) 2025 & 2033
- Figure 84: Middle East & Africa Chain Saw Industry Volume (Kiloton), by Import Market Analysis (Value & Volume) 2025 & 2033
- Figure 85: Middle East & Africa Chain Saw Industry Revenue Share (%), by Import Market Analysis (Value & Volume) 2025 & 2033
- Figure 86: Middle East & Africa Chain Saw Industry Volume Share (%), by Import Market Analysis (Value & Volume) 2025 & 2033
- Figure 87: Middle East & Africa Chain Saw Industry Revenue (Million), by Export Market Analysis (Value & Volume) 2025 & 2033
- Figure 88: Middle East & Africa Chain Saw Industry Volume (Kiloton), by Export Market Analysis (Value & Volume) 2025 & 2033
- Figure 89: Middle East & Africa Chain Saw Industry Revenue Share (%), by Export Market Analysis (Value & Volume) 2025 & 2033
- Figure 90: Middle East & Africa Chain Saw Industry Volume Share (%), by Export Market Analysis (Value & Volume) 2025 & 2033
- Figure 91: Middle East & Africa Chain Saw Industry Revenue (Million), by Price Trend Analysis 2025 & 2033
- Figure 92: Middle East & Africa Chain Saw Industry Volume (Kiloton), by Price Trend Analysis 2025 & 2033
- Figure 93: Middle East & Africa Chain Saw Industry Revenue Share (%), by Price Trend Analysis 2025 & 2033
- Figure 94: Middle East & Africa Chain Saw Industry Volume Share (%), by Price Trend Analysis 2025 & 2033
- Figure 95: Middle East & Africa Chain Saw Industry Revenue (Million), by Country 2025 & 2033
- Figure 96: Middle East & Africa Chain Saw Industry Volume (Kiloton), by Country 2025 & 2033
- Figure 97: Middle East & Africa Chain Saw Industry Revenue Share (%), by Country 2025 & 2033
- Figure 98: Middle East & Africa Chain Saw Industry Volume Share (%), by Country 2025 & 2033
- Figure 99: Asia Pacific Chain Saw Industry Revenue (Million), by Production Analysis 2025 & 2033
- Figure 100: Asia Pacific Chain Saw Industry Volume (Kiloton), by Production Analysis 2025 & 2033
- Figure 101: Asia Pacific Chain Saw Industry Revenue Share (%), by Production Analysis 2025 & 2033
- Figure 102: Asia Pacific Chain Saw Industry Volume Share (%), by Production Analysis 2025 & 2033
- Figure 103: Asia Pacific Chain Saw Industry Revenue (Million), by Consumption Analysis 2025 & 2033
- Figure 104: Asia Pacific Chain Saw Industry Volume (Kiloton), by Consumption Analysis 2025 & 2033
- Figure 105: Asia Pacific Chain Saw Industry Revenue Share (%), by Consumption Analysis 2025 & 2033
- Figure 106: Asia Pacific Chain Saw Industry Volume Share (%), by Consumption Analysis 2025 & 2033
- Figure 107: Asia Pacific Chain Saw Industry Revenue (Million), by Import Market Analysis (Value & Volume) 2025 & 2033
- Figure 108: Asia Pacific Chain Saw Industry Volume (Kiloton), by Import Market Analysis (Value & Volume) 2025 & 2033
- Figure 109: Asia Pacific Chain Saw Industry Revenue Share (%), by Import Market Analysis (Value & Volume) 2025 & 2033
- Figure 110: Asia Pacific Chain Saw Industry Volume Share (%), by Import Market Analysis (Value & Volume) 2025 & 2033
- Figure 111: Asia Pacific Chain Saw Industry Revenue (Million), by Export Market Analysis (Value & Volume) 2025 & 2033
- Figure 112: Asia Pacific Chain Saw Industry Volume (Kiloton), by Export Market Analysis (Value & Volume) 2025 & 2033
- Figure 113: Asia Pacific Chain Saw Industry Revenue Share (%), by Export Market Analysis (Value & Volume) 2025 & 2033
- Figure 114: Asia Pacific Chain Saw Industry Volume Share (%), by Export Market Analysis (Value & Volume) 2025 & 2033
- Figure 115: Asia Pacific Chain Saw Industry Revenue (Million), by Price Trend Analysis 2025 & 2033
- Figure 116: Asia Pacific Chain Saw Industry Volume (Kiloton), by Price Trend Analysis 2025 & 2033
- Figure 117: Asia Pacific Chain Saw Industry Revenue Share (%), by Price Trend Analysis 2025 & 2033
- Figure 118: Asia Pacific Chain Saw Industry Volume Share (%), by Price Trend Analysis 2025 & 2033
- Figure 119: Asia Pacific Chain Saw Industry Revenue (Million), by Country 2025 & 2033
- Figure 120: Asia Pacific Chain Saw Industry Volume (Kiloton), by Country 2025 & 2033
- Figure 121: Asia Pacific Chain Saw Industry Revenue Share (%), by Country 2025 & 2033
- Figure 122: Asia Pacific Chain Saw Industry Volume Share (%), by Country 2025 & 2033
List of Tables
- Table 1: Global Chain Saw Industry Revenue Million Forecast, by Production Analysis 2020 & 2033
- Table 2: Global Chain Saw Industry Volume Kiloton Forecast, by Production Analysis 2020 & 2033
- Table 3: Global Chain Saw Industry Revenue Million Forecast, by Consumption Analysis 2020 & 2033
- Table 4: Global Chain Saw Industry Volume Kiloton Forecast, by Consumption Analysis 2020 & 2033
- Table 5: Global Chain Saw Industry Revenue Million Forecast, by Import Market Analysis (Value & Volume) 2020 & 2033
- Table 6: Global Chain Saw Industry Volume Kiloton Forecast, by Import Market Analysis (Value & Volume) 2020 & 2033
- Table 7: Global Chain Saw Industry Revenue Million Forecast, by Export Market Analysis (Value & Volume) 2020 & 2033
- Table 8: Global Chain Saw Industry Volume Kiloton Forecast, by Export Market Analysis (Value & Volume) 2020 & 2033
- Table 9: Global Chain Saw Industry Revenue Million Forecast, by Price Trend Analysis 2020 & 2033
- Table 10: Global Chain Saw Industry Volume Kiloton Forecast, by Price Trend Analysis 2020 & 2033
- Table 11: Global Chain Saw Industry Revenue Million Forecast, by Region 2020 & 2033
- Table 12: Global Chain Saw Industry Volume Kiloton Forecast, by Region 2020 & 2033
- Table 13: Global Chain Saw Industry Revenue Million Forecast, by Production Analysis 2020 & 2033
- Table 14: Global Chain Saw Industry Volume Kiloton Forecast, by Production Analysis 2020 & 2033
- Table 15: Global Chain Saw Industry Revenue Million Forecast, by Consumption Analysis 2020 & 2033
- Table 16: Global Chain Saw Industry Volume Kiloton Forecast, by Consumption Analysis 2020 & 2033
- Table 17: Global Chain Saw Industry Revenue Million Forecast, by Import Market Analysis (Value & Volume) 2020 & 2033
- Table 18: Global Chain Saw Industry Volume Kiloton Forecast, by Import Market Analysis (Value & Volume) 2020 & 2033
- Table 19: Global Chain Saw Industry Revenue Million Forecast, by Export Market Analysis (Value & Volume) 2020 & 2033
- Table 20: Global Chain Saw Industry Volume Kiloton Forecast, by Export Market Analysis (Value & Volume) 2020 & 2033
- Table 21: Global Chain Saw Industry Revenue Million Forecast, by Price Trend Analysis 2020 & 2033
- Table 22: Global Chain Saw Industry Volume Kiloton Forecast, by Price Trend Analysis 2020 & 2033
- Table 23: Global Chain Saw Industry Revenue Million Forecast, by Country 2020 & 2033
- Table 24: Global Chain Saw Industry Volume Kiloton Forecast, by Country 2020 & 2033
- Table 25: United States Chain Saw Industry Revenue (Million) Forecast, by Application 2020 & 2033
- Table 26: United States Chain Saw Industry Volume (Kiloton) Forecast, by Application 2020 & 2033
- Table 27: Canada Chain Saw Industry Revenue (Million) Forecast, by Application 2020 & 2033
- Table 28: Canada Chain Saw Industry Volume (Kiloton) Forecast, by Application 2020 & 2033
- Table 29: Mexico Chain Saw Industry Revenue (Million) Forecast, by Application 2020 & 2033
- Table 30: Mexico Chain Saw Industry Volume (Kiloton) Forecast, by Application 2020 & 2033
- Table 31: Global Chain Saw Industry Revenue Million Forecast, by Production Analysis 2020 & 2033
- Table 32: Global Chain Saw Industry Volume Kiloton Forecast, by Production Analysis 2020 & 2033
- Table 33: Global Chain Saw Industry Revenue Million Forecast, by Consumption Analysis 2020 & 2033
- Table 34: Global Chain Saw Industry Volume Kiloton Forecast, by Consumption Analysis 2020 & 2033
- Table 35: Global Chain Saw Industry Revenue Million Forecast, by Import Market Analysis (Value & Volume) 2020 & 2033
- Table 36: Global Chain Saw Industry Volume Kiloton Forecast, by Import Market Analysis (Value & Volume) 2020 & 2033
- Table 37: Global Chain Saw Industry Revenue Million Forecast, by Export Market Analysis (Value & Volume) 2020 & 2033
- Table 38: Global Chain Saw Industry Volume Kiloton Forecast, by Export Market Analysis (Value & Volume) 2020 & 2033
- Table 39: Global Chain Saw Industry Revenue Million Forecast, by Price Trend Analysis 2020 & 2033
- Table 40: Global Chain Saw Industry Volume Kiloton Forecast, by Price Trend Analysis 2020 & 2033
- Table 41: Global Chain Saw Industry Revenue Million Forecast, by Country 2020 & 2033
- Table 42: Global Chain Saw Industry Volume Kiloton Forecast, by Country 2020 & 2033
- Table 43: Brazil Chain Saw Industry Revenue (Million) Forecast, by Application 2020 & 2033
- Table 44: Brazil Chain Saw Industry Volume (Kiloton) Forecast, by Application 2020 & 2033
- Table 45: Argentina Chain Saw Industry Revenue (Million) Forecast, by Application 2020 & 2033
- Table 46: Argentina Chain Saw Industry Volume (Kiloton) Forecast, by Application 2020 & 2033
- Table 47: Rest of South America Chain Saw Industry Revenue (Million) Forecast, by Application 2020 & 2033
- Table 48: Rest of South America Chain Saw Industry Volume (Kiloton) Forecast, by Application 2020 & 2033
- Table 49: Global Chain Saw Industry Revenue Million Forecast, by Production Analysis 2020 & 2033
- Table 50: Global Chain Saw Industry Volume Kiloton Forecast, by Production Analysis 2020 & 2033
- Table 51: Global Chain Saw Industry Revenue Million Forecast, by Consumption Analysis 2020 & 2033
- Table 52: Global Chain Saw Industry Volume Kiloton Forecast, by Consumption Analysis 2020 & 2033
- Table 53: Global Chain Saw Industry Revenue Million Forecast, by Import Market Analysis (Value & Volume) 2020 & 2033
- Table 54: Global Chain Saw Industry Volume Kiloton Forecast, by Import Market Analysis (Value & Volume) 2020 & 2033
- Table 55: Global Chain Saw Industry Revenue Million Forecast, by Export Market Analysis (Value & Volume) 2020 & 2033
- Table 56: Global Chain Saw Industry Volume Kiloton Forecast, by Export Market Analysis (Value & Volume) 2020 & 2033
- Table 57: Global Chain Saw Industry Revenue Million Forecast, by Price Trend Analysis 2020 & 2033
- Table 58: Global Chain Saw Industry Volume Kiloton Forecast, by Price Trend Analysis 2020 & 2033
- Table 59: Global Chain Saw Industry Revenue Million Forecast, by Country 2020 & 2033
- Table 60: Global Chain Saw Industry Volume Kiloton Forecast, by Country 2020 & 2033
- Table 61: United Kingdom Chain Saw Industry Revenue (Million) Forecast, by Application 2020 & 2033
- Table 62: United Kingdom Chain Saw Industry Volume (Kiloton) Forecast, by Application 2020 & 2033
- Table 63: Germany Chain Saw Industry Revenue (Million) Forecast, by Application 2020 & 2033
- Table 64: Germany Chain Saw Industry Volume (Kiloton) Forecast, by Application 2020 & 2033
- Table 65: France Chain Saw Industry Revenue (Million) Forecast, by Application 2020 & 2033
- Table 66: France Chain Saw Industry Volume (Kiloton) Forecast, by Application 2020 & 2033
- Table 67: Italy Chain Saw Industry Revenue (Million) Forecast, by Application 2020 & 2033
- Table 68: Italy Chain Saw Industry Volume (Kiloton) Forecast, by Application 2020 & 2033
- Table 69: Spain Chain Saw Industry Revenue (Million) Forecast, by Application 2020 & 2033
- Table 70: Spain Chain Saw Industry Volume (Kiloton) Forecast, by Application 2020 & 2033
- Table 71: Russia Chain Saw Industry Revenue (Million) Forecast, by Application 2020 & 2033
- Table 72: Russia Chain Saw Industry Volume (Kiloton) Forecast, by Application 2020 & 2033
- Table 73: Benelux Chain Saw Industry Revenue (Million) Forecast, by Application 2020 & 2033
- Table 74: Benelux Chain Saw Industry Volume (Kiloton) Forecast, by Application 2020 & 2033
- Table 75: Nordics Chain Saw Industry Revenue (Million) Forecast, by Application 2020 & 2033
- Table 76: Nordics Chain Saw Industry Volume (Kiloton) Forecast, by Application 2020 & 2033
- Table 77: Rest of Europe Chain Saw Industry Revenue (Million) Forecast, by Application 2020 & 2033
- Table 78: Rest of Europe Chain Saw Industry Volume (Kiloton) Forecast, by Application 2020 & 2033
- Table 79: Global Chain Saw Industry Revenue Million Forecast, by Production Analysis 2020 & 2033
- Table 80: Global Chain Saw Industry Volume Kiloton Forecast, by Production Analysis 2020 & 2033
- Table 81: Global Chain Saw Industry Revenue Million Forecast, by Consumption Analysis 2020 & 2033
- Table 82: Global Chain Saw Industry Volume Kiloton Forecast, by Consumption Analysis 2020 & 2033
- Table 83: Global Chain Saw Industry Revenue Million Forecast, by Import Market Analysis (Value & Volume) 2020 & 2033
- Table 84: Global Chain Saw Industry Volume Kiloton Forecast, by Import Market Analysis (Value & Volume) 2020 & 2033
- Table 85: Global Chain Saw Industry Revenue Million Forecast, by Export Market Analysis (Value & Volume) 2020 & 2033
- Table 86: Global Chain Saw Industry Volume Kiloton Forecast, by Export Market Analysis (Value & Volume) 2020 & 2033
- Table 87: Global Chain Saw Industry Revenue Million Forecast, by Price Trend Analysis 2020 & 2033
- Table 88: Global Chain Saw Industry Volume Kiloton Forecast, by Price Trend Analysis 2020 & 2033
- Table 89: Global Chain Saw Industry Revenue Million Forecast, by Country 2020 & 2033
- Table 90: Global Chain Saw Industry Volume Kiloton Forecast, by Country 2020 & 2033
- Table 91: Turkey Chain Saw Industry Revenue (Million) Forecast, by Application 2020 & 2033
- Table 92: Turkey Chain Saw Industry Volume (Kiloton) Forecast, by Application 2020 & 2033
- Table 93: Israel Chain Saw Industry Revenue (Million) Forecast, by Application 2020 & 2033
- Table 94: Israel Chain Saw Industry Volume (Kiloton) Forecast, by Application 2020 & 2033
- Table 95: GCC Chain Saw Industry Revenue (Million) Forecast, by Application 2020 & 2033
- Table 96: GCC Chain Saw Industry Volume (Kiloton) Forecast, by Application 2020 & 2033
- Table 97: North Africa Chain Saw Industry Revenue (Million) Forecast, by Application 2020 & 2033
- Table 98: North Africa Chain Saw Industry Volume (Kiloton) Forecast, by Application 2020 & 2033
- Table 99: South Africa Chain Saw Industry Revenue (Million) Forecast, by Application 2020 & 2033
- Table 100: South Africa Chain Saw Industry Volume (Kiloton) Forecast, by Application 2020 & 2033
- Table 101: Rest of Middle East & Africa Chain Saw Industry Revenue (Million) Forecast, by Application 2020 & 2033
- Table 102: Rest of Middle East & Africa Chain Saw Industry Volume (Kiloton) Forecast, by Application 2020 & 2033
- Table 103: Global Chain Saw Industry Revenue Million Forecast, by Production Analysis 2020 & 2033
- Table 104: Global Chain Saw Industry Volume Kiloton Forecast, by Production Analysis 2020 & 2033
- Table 105: Global Chain Saw Industry Revenue Million Forecast, by Consumption Analysis 2020 & 2033
- Table 106: Global Chain Saw Industry Volume Kiloton Forecast, by Consumption Analysis 2020 & 2033
- Table 107: Global Chain Saw Industry Revenue Million Forecast, by Import Market Analysis (Value & Volume) 2020 & 2033
- Table 108: Global Chain Saw Industry Volume Kiloton Forecast, by Import Market Analysis (Value & Volume) 2020 & 2033
- Table 109: Global Chain Saw Industry Revenue Million Forecast, by Export Market Analysis (Value & Volume) 2020 & 2033
- Table 110: Global Chain Saw Industry Volume Kiloton Forecast, by Export Market Analysis (Value & Volume) 2020 & 2033
- Table 111: Global Chain Saw Industry Revenue Million Forecast, by Price Trend Analysis 2020 & 2033
- Table 112: Global Chain Saw Industry Volume Kiloton Forecast, by Price Trend Analysis 2020 & 2033
- Table 113: Global Chain Saw Industry Revenue Million Forecast, by Country 2020 & 2033
- Table 114: Global Chain Saw Industry Volume Kiloton Forecast, by Country 2020 & 2033
- Table 115: China Chain Saw Industry Revenue (Million) Forecast, by Application 2020 & 2033
- Table 116: China Chain Saw Industry Volume (Kiloton) Forecast, by Application 2020 & 2033
- Table 117: India Chain Saw Industry Revenue (Million) Forecast, by Application 2020 & 2033
- Table 118: India Chain Saw Industry Volume (Kiloton) Forecast, by Application 2020 & 2033
- Table 119: Japan Chain Saw Industry Revenue (Million) Forecast, by Application 2020 & 2033
- Table 120: Japan Chain Saw Industry Volume (Kiloton) Forecast, by Application 2020 & 2033
- Table 121: South Korea Chain Saw Industry Revenue (Million) Forecast, by Application 2020 & 2033
- Table 122: South Korea Chain Saw Industry Volume (Kiloton) Forecast, by Application 2020 & 2033
- Table 123: ASEAN Chain Saw Industry Revenue (Million) Forecast, by Application 2020 & 2033
- Table 124: ASEAN Chain Saw Industry Volume (Kiloton) Forecast, by Application 2020 & 2033
- Table 125: Oceania Chain Saw Industry Revenue (Million) Forecast, by Application 2020 & 2033
- Table 126: Oceania Chain Saw Industry Volume (Kiloton) Forecast, by Application 2020 & 2033
- Table 127: Rest of Asia Pacific Chain Saw Industry Revenue (Million) Forecast, by Application 2020 & 2033
- Table 128: Rest of Asia Pacific Chain Saw Industry Volume (Kiloton) Forecast, by Application 2020 & 2033
Frequently Asked Questions
1. What is the projected Compound Annual Growth Rate (CAGR) of the Chain Saw Industry?
The projected CAGR is approximately 3.50%.
2. Which companies are prominent players in the Chain Saw Industry?
Key companies in the market include Talon Tough Tools, The Toro Co, Einhell Germany, ANDREAS STIHL Limited, Rochford Garden Machinery, Robert Bosch GmbH, SUMEC Group Corporation, AL-KO Kober, STIGA SpA, Emak SPA, Yamabiko Corp, Stanley Black & Decker Inc, Hitachi Ltd, Husqvarna AB, Blount International Inc.
3. What are the main segments of the Chain Saw Industry?
The market segments include Production Analysis, Consumption Analysis, Import Market Analysis (Value & Volume), Export Market Analysis (Value & Volume), Price Trend Analysis.
4. Can you provide details about the market size?
The market size is estimated to be USD 4.27 Million as of 2022.
5. What are some drivers contributing to market growth?
Decreasing Per Capita Arable Land; Increased Demand for Food.
6. What are the notable trends driving market growth?
Increasing Deforestation and Demand for Commodities and Shelter.
7. Are there any restraints impacting market growth?
High Initial Investments; Requirement of Precision Agriculture.
8. Can you provide examples of recent developments in the market?
April 2023: Husqvarna launched T542i XP® and 542i XP®, which the company claims to be the world's first battery chainsaws with a clutch, offering a kick-start of energy at the beginning of every cut and the familiar feel of gas-powered counterparts
9. What pricing options are available for accessing the report?
Pricing options include single-user, multi-user, and enterprise licenses priced at USD 4750, USD 5250, and USD 8750 respectively.
10. Is the market size provided in terms of value or volume?
The market size is provided in terms of value, measured in Million and volume, measured in Kiloton.
11. Are there any specific market keywords associated with the report?
Yes, the market keyword associated with the report is "Chain Saw Industry," which aids in identifying and referencing the specific market segment covered.
12. How do I determine which pricing option suits my needs best?
The pricing options vary based on user requirements and access needs. Individual users may opt for single-user licenses, while businesses requiring broader access may choose multi-user or enterprise licenses for cost-effective access to the report.
13. Are there any additional resources or data provided in the Chain Saw Industry report?
While the report offers comprehensive insights, it's advisable to review the specific contents or supplementary materials provided to ascertain if additional resources or data are available.
14. How can I stay updated on further developments or reports in the Chain Saw Industry?
To stay informed about further developments, trends, and reports in the Chain Saw Industry, consider subscribing to industry newsletters, following relevant companies and organizations, or regularly checking reputable industry news sources and publications.
Methodology
Step 1 - Identification of Relevant Samples Size from Population Database


Step 2 - Approaches for Defining Global Market Size (Value, Volume* & Price*)

Note*: In applicable scenarios
Step 3 - Data Sources
Primary Research
- Web Analytics
- Survey Reports
- Research Institute
- Latest Research Reports
- Opinion Leaders
Secondary Research
- Annual Reports
- White Paper
- Latest Press Release
- Industry Association
- Paid Database
- Investor Presentations

Step 4 - Data Triangulation
Involves using different sources of information in order to increase the validity of a study
These sources are likely to be stakeholders in a program - participants, other researchers, program staff, other community members, and so on.
Then we put all data in single framework & apply various statistical tools to find out the dynamic on the market.
During the analysis stage, feedback from the stakeholder groups would be compared to determine areas of agreement as well as areas of divergence