

Key Insights
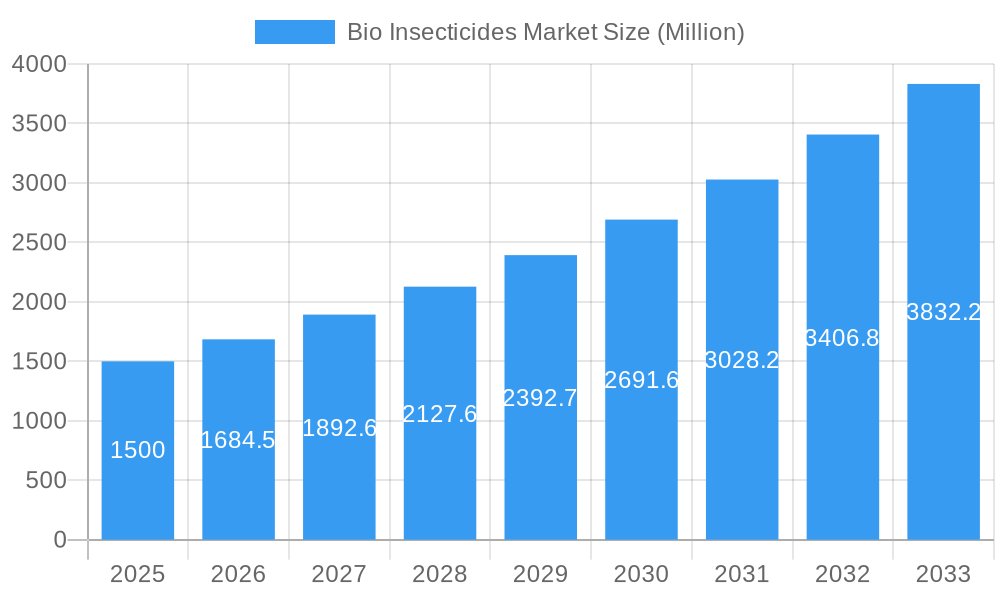
The global bio insecticides market is experiencing robust growth, projected to reach a substantial size by 2033. A compound annual growth rate (CAGR) of 12.30% from 2025 to 2033 signifies a significant upward trajectory driven by increasing consumer demand for eco-friendly agricultural practices and stringent regulations on synthetic pesticides. The rising awareness of the detrimental effects of chemical pesticides on human health and the environment is a major catalyst. Growing concerns about pesticide residues in food and the emergence of pesticide-resistant pests are further propelling the adoption of bio insecticides. Key application segments like grains & cereals, pulses & oilseeds, and fruits & vegetables are experiencing significant growth, reflecting the broad applicability of these solutions across various agricultural sectors. Leading players like Marrone Bio Innovations, Bayer CropScience AG, and others are investing heavily in research and development, expanding their product portfolios, and adopting innovative marketing strategies to capitalize on this burgeoning market. Geographical expansion into emerging markets in Asia-Pacific and Africa, characterized by substantial agricultural production and a growing need for sustainable pest management, offers significant growth potential. While challenges such as higher initial costs compared to conventional pesticides and inconsistent efficacy across different pest types and environmental conditions exist, the overall market outlook remains positive, fueled by a growing preference for environmentally sustainable agricultural practices.
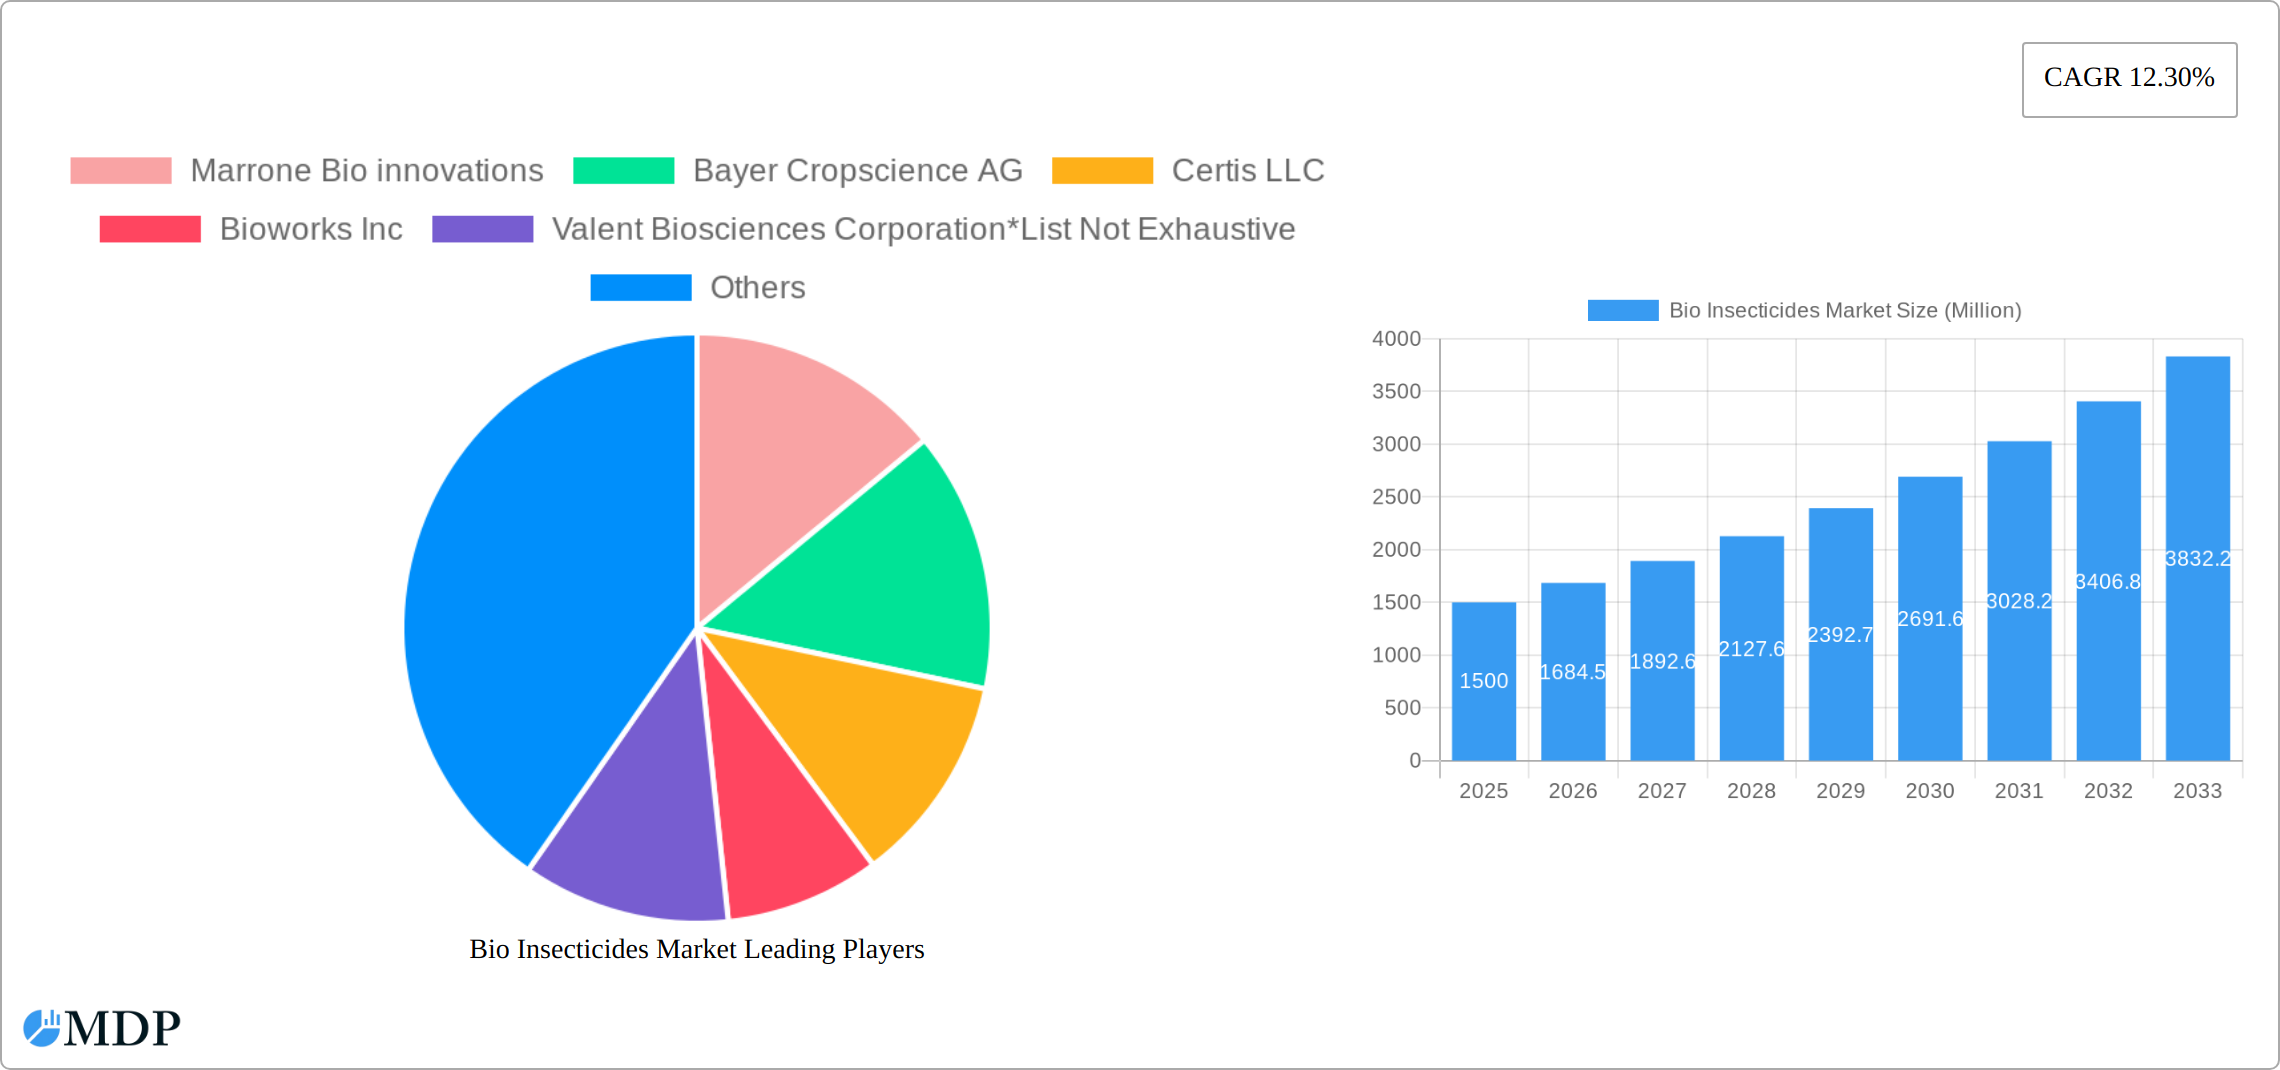
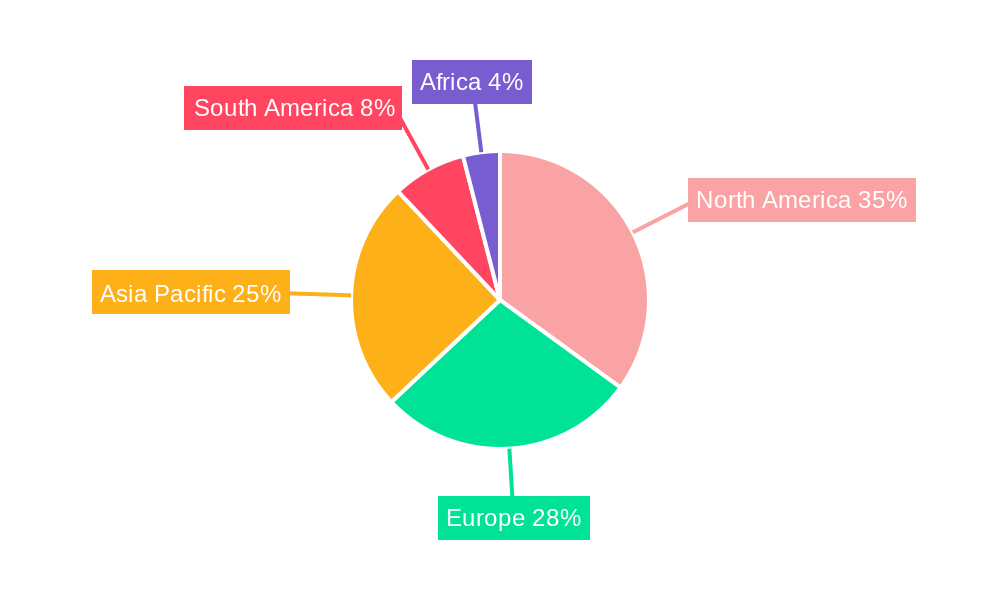
Bio Insecticides Market Market Size (In Billion)
The market segmentation highlights the strong demand across various agricultural applications. The grains & cereals segment is likely the largest, given its significant acreage and susceptibility to pests. The pulses & oilseeds segment is experiencing rapid growth due to increasing global demand for pulses as a sustainable protein source. Fruit & vegetable production, with its focus on high-quality produce and consumer preference for pesticide-free options, is also a significant driver of bio insecticide demand. North America and Europe currently hold a larger market share due to established agricultural practices and regulatory frameworks that favor bio-based solutions. However, the Asia-Pacific region, with its vast agricultural landscape and expanding consumer base, is expected to show the most significant growth in the coming years. The competitive landscape is characterized by a mix of established players and emerging companies, fostering innovation and driving down costs, making bio insecticides progressively more accessible to a broader range of farmers.
Bio Insecticides Market Company Market Share
Bio Insecticides Market: A Comprehensive Report (2019-2033)
Unlock the potential of the booming bio insecticides market with this in-depth analysis, projecting a robust CAGR of xx% from 2025 to 2033. This comprehensive report provides a detailed examination of market dynamics, industry trends, leading players, and future opportunities within the bio insecticides sector. The study period covers 2019-2033, with 2025 as the base and estimated year.
Bio Insecticides Market Market Dynamics & Concentration
The bio insecticides market is experiencing significant growth, driven by increasing consumer demand for eco-friendly agricultural practices and stringent regulations against synthetic pesticides. Market concentration is moderate, with several key players holding substantial market share but a considerable number of smaller companies contributing to innovation. The market share of the top 5 companies is estimated at xx% in 2025. Innovation is fueled by the ongoing development of novel biopesticides with enhanced efficacy and improved application methods. Regulatory frameworks, varying across different regions, significantly influence market dynamics. The substitution of traditional chemical pesticides with bio-based alternatives is a key driver. Consumer preferences towards organically produced food are increasingly influencing market demand. The market has witnessed a moderate level of M&A activity in recent years, with an estimated xx M&A deals in the historical period (2019-2024).
- Key Players: Marrone Bio Innovations, Bayer CropScience AG, Certis LLC, Bioworks Inc, Valent Biosciences Corporation, Isagro Spa, Corteva Agriscience, Novozymes AS, Koppert Biological Systems, BASF SE (List not exhaustive).
- Market Concentration: Moderate, with top 5 players holding xx% market share in 2025.
- M&A Activity: xx deals between 2019 and 2024.
- Regulatory landscape: Varies significantly by region influencing market penetration.
Bio Insecticides Market Industry Trends & Analysis
The bio insecticides market is experiencing substantial growth, propelled by several factors. The rising global population and increasing demand for food are driving the need for efficient and sustainable pest management solutions. Technological advancements in biopesticide development, leading to more effective and targeted products, are also contributing to market expansion. Consumer awareness of the environmental and health impacts of synthetic pesticides is fueling demand for bio-based alternatives. The market witnesses a high level of competition among established players and emerging companies. The global bio insecticides market is expected to reach USD xx Million by 2033, exhibiting a CAGR of xx% during the forecast period (2025-2033). Market penetration in key regions like North America and Europe is relatively high, while emerging economies present substantial growth opportunities.
Leading Markets & Segments in Bio Insecticides Market
The bio insecticides market is a dynamic sector experiencing robust growth, fueled by a confluence of factors. The Fruits & Vegetables segment currently commands the largest market share within application-based segmentation. This dominance is attributable to the high value of these crops and the escalating consumer demand for organically produced food. North America and Europe remain leading regions for bio insecticide adoption, primarily due to stringent regulations governing synthetic pesticide use and heightened consumer awareness of environmental and health impacts. However, the Asia-Pacific region presents a compelling growth opportunity, driven by its rapidly expanding agricultural sector and increasing consumer disposable incomes.
- Fruits & Vegetables Segment: A Deep Dive
- Unwavering Consumer Demand: The preference for organic produce continues to surge, driving substantial demand for bio insecticides in this segment.
- Regulatory Stringency: Stricter regulations on synthetic pesticides are compelling a shift towards safer alternatives.
- Profitability: The relatively high profitability associated with fruits and vegetables makes bio insecticide adoption more economically feasible.
- North America and Europe: Established Leaders
- Robust Regulatory Frameworks: Supportive regulatory environments actively encourage the adoption of biopesticides.
- Elevated Consumer Awareness: Consumers are increasingly informed about the detrimental effects of synthetic pesticides on human health and the environment.
- Mature Distribution Channels: Well-established distribution networks facilitate efficient market penetration.
- Asia-Pacific: A Region Poised for Expansion The burgeoning agricultural sector, coupled with rising disposable incomes, positions Asia-Pacific as a significant growth engine for the bio insecticides market in the coming years. This presents substantial opportunities for manufacturers to expand their reach and capture significant market share.
Bio Insecticides Market Product Developments
Recent product innovations focus on enhancing the efficacy and expanding the application range of bio insecticides. Companies are developing novel formulations to improve shelf life, increase the speed of action, and reduce environmental impact. Technological trends such as precision agriculture and the integration of biopesticides with other sustainable agricultural practices are driving product development. This is leading to increased market fit and better solutions for farmers.
Key Drivers of Bio Insecticides Market Growth
The bio insecticides market is experiencing rapid growth primarily due to growing environmental concerns regarding synthetic pesticides, coupled with increasing consumer preference for organically grown food. Stringent government regulations promoting sustainable agricultural practices further bolster market expansion. Technological advancements leading to more effective and targeted bio-pesticides are also significant drivers. The increasing awareness of the health risks associated with synthetic pesticides is driving demand for safer alternatives.
Challenges in the Bio Insecticides Market Market
Despite the considerable growth potential, the bio insecticides market faces challenges, such as the comparatively higher cost of biopesticides compared to synthetic alternatives, limiting adoption in price-sensitive markets. Inconsistent efficacy across different biopesticides and environmental conditions presents another challenge. The longer time required for biopesticides to achieve the same level of pest control as synthetic options can also hinder widespread adoption. Supply chain complexities can affect availability and affordability.
Emerging Opportunities in Bio Insecticides Market
The bio insecticides market presents significant long-term growth opportunities driven by advancements in biotechnology and the development of new, highly effective formulations. Strategic partnerships between biopesticide manufacturers and agricultural technology companies are creating synergies that are driving innovation and market penetration. Expansion into emerging markets with a growing demand for sustainable agricultural practices presents significant opportunities for market expansion.
Leading Players in the Bio Insecticides Market Sector
Key Milestones in Bio Insecticides Market Industry
- 2020: Launch of a new biopesticide with enhanced efficacy by Company X.
- 2022: Acquisition of a smaller biopesticide company by a major agrochemical corporation.
- 2023: Introduction of a new regulatory framework promoting the use of biopesticides in a major agricultural region.
- 2024: Successful field trials demonstrating the superior efficacy of a novel biopesticide formulation.
Strategic Outlook for Bio Insecticides Market Market
The bio insecticides market is poised for continued growth, driven by increasing environmental awareness, stricter regulations on synthetic pesticides, and technological advancements leading to more effective and sustainable pest control solutions. Strategic partnerships and investments in research and development will further drive market expansion. Companies that focus on innovation and sustainability will be well-positioned to capitalize on the significant growth opportunities in this dynamic market.
Bio Insecticides Market Segmentation
- 1. Production Analysis
- 2. Consumption Analysis
- 3. Import Market Analysis (Value & Volume)
- 4. Export Market Analysis (Value & Volume)
- 5. Price Trend Analysis
Bio Insecticides Market Segmentation By Geography
-
1. North America
- 1.1. United States
- 1.2. Canada
- 1.3. Mexico
-
2. South America
- 2.1. Brazil
- 2.2. Argentina
- 2.3. Rest of South America
-
3. Europe
- 3.1. United Kingdom
- 3.2. Germany
- 3.3. France
- 3.4. Italy
- 3.5. Spain
- 3.6. Russia
- 3.7. Benelux
- 3.8. Nordics
- 3.9. Rest of Europe
-
4. Middle East & Africa
- 4.1. Turkey
- 4.2. Israel
- 4.3. GCC
- 4.4. North Africa
- 4.5. South Africa
- 4.6. Rest of Middle East & Africa
-
5. Asia Pacific
- 5.1. China
- 5.2. India
- 5.3. Japan
- 5.4. South Korea
- 5.5. ASEAN
- 5.6. Oceania
- 5.7. Rest of Asia Pacific
Bio Insecticides Market Regional Market Share
Geographic Coverage of Bio Insecticides Market
Bio Insecticides Market REPORT HIGHLIGHTS
| Aspects | Details |
|---|---|
| Study Period | 2020-2034 |
| Base Year | 2025 |
| Estimated Year | 2026 |
| Forecast Period | 2026-2034 |
| Historical Period | 2020-2025 |
| Growth Rate | CAGR of 14.6% from 2020-2034 |
| Segmentation |
|
Table of Contents
- 1. Introduction
- 1.1. Research Scope
- 1.2. Market Segmentation
- 1.3. Research Objective
- 1.4. Definitions and Assumptions
- 2. Executive Summary
- 2.1. Market Snapshot
- 3. Market Dynamics
- 3.1. Market Drivers
- 3.2. Market Restrains
- 3.3. Market Trends
- 3.4. Market Opportunities
- 4. Market Factor Analysis
- 4.1. Porters Five Forces
- 4.1.1. Bargaining Power of Suppliers
- 4.1.2. Bargaining Power of Buyers
- 4.1.3. Threat of New Entrants
- 4.1.4. Threat of Substitutes
- 4.1.5. Competitive Rivalry
- 4.2. PESTEL analysis
- 4.3. BCG Analysis
- 4.3.1. Stars (High Growth, High Market Share)
- 4.3.2. Cash Cows (Low Growth, High Market Share)
- 4.3.3. Question Mark (High Growth, Low Market Share)
- 4.3.4. Dogs (Low Growth, Low Market Share)
- 4.4. Ansoff Matrix Analysis
- 4.5. Supply Chain Analysis
- 4.6. Regulatory Landscape
- 4.7. Current Market Potential and Opportunity Assessment (TAM–SAM–SOM Framework)
- 4.8. MDP Analyst Note
- 4.1. Porters Five Forces
- 5. Market Analysis, Insights and Forecast 2021-2033
- 5.1. Market Analysis, Insights and Forecast - by Production Analysis
- 5.2. Market Analysis, Insights and Forecast - by Consumption Analysis
- 5.3. Market Analysis, Insights and Forecast - by Import Market Analysis (Value & Volume)
- 5.4. Market Analysis, Insights and Forecast - by Export Market Analysis (Value & Volume)
- 5.5. Market Analysis, Insights and Forecast - by Price Trend Analysis
- 5.6. Market Analysis, Insights and Forecast - by Region
- 5.6.1. North America
- 5.6.2. South America
- 5.6.3. Europe
- 5.6.4. Middle East & Africa
- 5.6.5. Asia Pacific
- 6. Global Bio Insecticides Market Analysis, Insights and Forecast, 2021-2033
- 6.1. Market Analysis, Insights and Forecast - by Production Analysis
- 6.2. Market Analysis, Insights and Forecast - by Consumption Analysis
- 6.3. Market Analysis, Insights and Forecast - by Import Market Analysis (Value & Volume)
- 6.4. Market Analysis, Insights and Forecast - by Export Market Analysis (Value & Volume)
- 6.5. Market Analysis, Insights and Forecast - by Price Trend Analysis
- 7. North America Bio Insecticides Market Analysis, Insights and Forecast, 2020-2032
- 7.1. Market Analysis, Insights and Forecast - by Production Analysis
- 7.2. Market Analysis, Insights and Forecast - by Consumption Analysis
- 7.3. Market Analysis, Insights and Forecast - by Import Market Analysis (Value & Volume)
- 7.4. Market Analysis, Insights and Forecast - by Export Market Analysis (Value & Volume)
- 7.5. Market Analysis, Insights and Forecast - by Price Trend Analysis
- 8. South America Bio Insecticides Market Analysis, Insights and Forecast, 2020-2032
- 8.1. Market Analysis, Insights and Forecast - by Production Analysis
- 8.2. Market Analysis, Insights and Forecast - by Consumption Analysis
- 8.3. Market Analysis, Insights and Forecast - by Import Market Analysis (Value & Volume)
- 8.4. Market Analysis, Insights and Forecast - by Export Market Analysis (Value & Volume)
- 8.5. Market Analysis, Insights and Forecast - by Price Trend Analysis
- 9. Europe Bio Insecticides Market Analysis, Insights and Forecast, 2020-2032
- 9.1. Market Analysis, Insights and Forecast - by Production Analysis
- 9.2. Market Analysis, Insights and Forecast - by Consumption Analysis
- 9.3. Market Analysis, Insights and Forecast - by Import Market Analysis (Value & Volume)
- 9.4. Market Analysis, Insights and Forecast - by Export Market Analysis (Value & Volume)
- 9.5. Market Analysis, Insights and Forecast - by Price Trend Analysis
- 10. Middle East & Africa Bio Insecticides Market Analysis, Insights and Forecast, 2020-2032
- 10.1. Market Analysis, Insights and Forecast - by Production Analysis
- 10.2. Market Analysis, Insights and Forecast - by Consumption Analysis
- 10.3. Market Analysis, Insights and Forecast - by Import Market Analysis (Value & Volume)
- 10.4. Market Analysis, Insights and Forecast - by Export Market Analysis (Value & Volume)
- 10.5. Market Analysis, Insights and Forecast - by Price Trend Analysis
- 11. Asia Pacific Bio Insecticides Market Analysis, Insights and Forecast, 2020-2032
- 11.1. Market Analysis, Insights and Forecast - by Production Analysis
- 11.2. Market Analysis, Insights and Forecast - by Consumption Analysis
- 11.3. Market Analysis, Insights and Forecast - by Import Market Analysis (Value & Volume)
- 11.4. Market Analysis, Insights and Forecast - by Export Market Analysis (Value & Volume)
- 11.5. Market Analysis, Insights and Forecast - by Price Trend Analysis
- 12. Competitive Analysis
- 12.1. Company Profiles
- 12.1.1 Marrone Bio innovations
- 12.1.1.1. Company Overview
- 12.1.1.2. Products
- 12.1.1.3. Company Financials
- 12.1.1.4. SWOT Analysis
- 12.1.2 Bayer Cropscience AG
- 12.1.2.1. Company Overview
- 12.1.2.2. Products
- 12.1.2.3. Company Financials
- 12.1.2.4. SWOT Analysis
- 12.1.3 Certis LLC
- 12.1.3.1. Company Overview
- 12.1.3.2. Products
- 12.1.3.3. Company Financials
- 12.1.3.4. SWOT Analysis
- 12.1.4 Bioworks Inc
- 12.1.4.1. Company Overview
- 12.1.4.2. Products
- 12.1.4.3. Company Financials
- 12.1.4.4. SWOT Analysis
- 12.1.5 Valent Biosciences Corporation*List Not Exhaustive
- 12.1.5.1. Company Overview
- 12.1.5.2. Products
- 12.1.5.3. Company Financials
- 12.1.5.4. SWOT Analysis
- 12.1.6 Isagro Spa
- 12.1.6.1. Company Overview
- 12.1.6.2. Products
- 12.1.6.3. Company Financials
- 12.1.6.4. SWOT Analysis
- 12.1.7 Corteva Agriscience
- 12.1.7.1. Company Overview
- 12.1.7.2. Products
- 12.1.7.3. Company Financials
- 12.1.7.4. SWOT Analysis
- 12.1.8 Novozymes AS
- 12.1.8.1. Company Overview
- 12.1.8.2. Products
- 12.1.8.3. Company Financials
- 12.1.8.4. SWOT Analysis
- 12.1.9 Koppert Biological Systems
- 12.1.9.1. Company Overview
- 12.1.9.2. Products
- 12.1.9.3. Company Financials
- 12.1.9.4. SWOT Analysis
- 12.1.10 BASF SE
- 12.1.10.1. Company Overview
- 12.1.10.2. Products
- 12.1.10.3. Company Financials
- 12.1.10.4. SWOT Analysis
- 12.1.1 Marrone Bio innovations
- 12.2. Market Entropy
- 12.2.1 Company's Key Areas Served
- 12.2.2 Recent Developments
- 12.3. Company Market Share Analysis 2025
- 12.3.1 Top 5 Companies Market Share Analysis
- 12.3.2 Top 3 Companies Market Share Analysis
- 12.4. List of Potential Customers
- 13. Research Methodology
List of Figures
- Figure 1: Global Bio Insecticides Market Revenue Breakdown (undefined, %) by Region 2025 & 2033
- Figure 2: North America Bio Insecticides Market Revenue (undefined), by Production Analysis 2025 & 2033
- Figure 3: North America Bio Insecticides Market Revenue Share (%), by Production Analysis 2025 & 2033
- Figure 4: North America Bio Insecticides Market Revenue (undefined), by Consumption Analysis 2025 & 2033
- Figure 5: North America Bio Insecticides Market Revenue Share (%), by Consumption Analysis 2025 & 2033
- Figure 6: North America Bio Insecticides Market Revenue (undefined), by Import Market Analysis (Value & Volume) 2025 & 2033
- Figure 7: North America Bio Insecticides Market Revenue Share (%), by Import Market Analysis (Value & Volume) 2025 & 2033
- Figure 8: North America Bio Insecticides Market Revenue (undefined), by Export Market Analysis (Value & Volume) 2025 & 2033
- Figure 9: North America Bio Insecticides Market Revenue Share (%), by Export Market Analysis (Value & Volume) 2025 & 2033
- Figure 10: North America Bio Insecticides Market Revenue (undefined), by Price Trend Analysis 2025 & 2033
- Figure 11: North America Bio Insecticides Market Revenue Share (%), by Price Trend Analysis 2025 & 2033
- Figure 12: North America Bio Insecticides Market Revenue (undefined), by Country 2025 & 2033
- Figure 13: North America Bio Insecticides Market Revenue Share (%), by Country 2025 & 2033
- Figure 14: South America Bio Insecticides Market Revenue (undefined), by Production Analysis 2025 & 2033
- Figure 15: South America Bio Insecticides Market Revenue Share (%), by Production Analysis 2025 & 2033
- Figure 16: South America Bio Insecticides Market Revenue (undefined), by Consumption Analysis 2025 & 2033
- Figure 17: South America Bio Insecticides Market Revenue Share (%), by Consumption Analysis 2025 & 2033
- Figure 18: South America Bio Insecticides Market Revenue (undefined), by Import Market Analysis (Value & Volume) 2025 & 2033
- Figure 19: South America Bio Insecticides Market Revenue Share (%), by Import Market Analysis (Value & Volume) 2025 & 2033
- Figure 20: South America Bio Insecticides Market Revenue (undefined), by Export Market Analysis (Value & Volume) 2025 & 2033
- Figure 21: South America Bio Insecticides Market Revenue Share (%), by Export Market Analysis (Value & Volume) 2025 & 2033
- Figure 22: South America Bio Insecticides Market Revenue (undefined), by Price Trend Analysis 2025 & 2033
- Figure 23: South America Bio Insecticides Market Revenue Share (%), by Price Trend Analysis 2025 & 2033
- Figure 24: South America Bio Insecticides Market Revenue (undefined), by Country 2025 & 2033
- Figure 25: South America Bio Insecticides Market Revenue Share (%), by Country 2025 & 2033
- Figure 26: Europe Bio Insecticides Market Revenue (undefined), by Production Analysis 2025 & 2033
- Figure 27: Europe Bio Insecticides Market Revenue Share (%), by Production Analysis 2025 & 2033
- Figure 28: Europe Bio Insecticides Market Revenue (undefined), by Consumption Analysis 2025 & 2033
- Figure 29: Europe Bio Insecticides Market Revenue Share (%), by Consumption Analysis 2025 & 2033
- Figure 30: Europe Bio Insecticides Market Revenue (undefined), by Import Market Analysis (Value & Volume) 2025 & 2033
- Figure 31: Europe Bio Insecticides Market Revenue Share (%), by Import Market Analysis (Value & Volume) 2025 & 2033
- Figure 32: Europe Bio Insecticides Market Revenue (undefined), by Export Market Analysis (Value & Volume) 2025 & 2033
- Figure 33: Europe Bio Insecticides Market Revenue Share (%), by Export Market Analysis (Value & Volume) 2025 & 2033
- Figure 34: Europe Bio Insecticides Market Revenue (undefined), by Price Trend Analysis 2025 & 2033
- Figure 35: Europe Bio Insecticides Market Revenue Share (%), by Price Trend Analysis 2025 & 2033
- Figure 36: Europe Bio Insecticides Market Revenue (undefined), by Country 2025 & 2033
- Figure 37: Europe Bio Insecticides Market Revenue Share (%), by Country 2025 & 2033
- Figure 38: Middle East & Africa Bio Insecticides Market Revenue (undefined), by Production Analysis 2025 & 2033
- Figure 39: Middle East & Africa Bio Insecticides Market Revenue Share (%), by Production Analysis 2025 & 2033
- Figure 40: Middle East & Africa Bio Insecticides Market Revenue (undefined), by Consumption Analysis 2025 & 2033
- Figure 41: Middle East & Africa Bio Insecticides Market Revenue Share (%), by Consumption Analysis 2025 & 2033
- Figure 42: Middle East & Africa Bio Insecticides Market Revenue (undefined), by Import Market Analysis (Value & Volume) 2025 & 2033
- Figure 43: Middle East & Africa Bio Insecticides Market Revenue Share (%), by Import Market Analysis (Value & Volume) 2025 & 2033
- Figure 44: Middle East & Africa Bio Insecticides Market Revenue (undefined), by Export Market Analysis (Value & Volume) 2025 & 2033
- Figure 45: Middle East & Africa Bio Insecticides Market Revenue Share (%), by Export Market Analysis (Value & Volume) 2025 & 2033
- Figure 46: Middle East & Africa Bio Insecticides Market Revenue (undefined), by Price Trend Analysis 2025 & 2033
- Figure 47: Middle East & Africa Bio Insecticides Market Revenue Share (%), by Price Trend Analysis 2025 & 2033
- Figure 48: Middle East & Africa Bio Insecticides Market Revenue (undefined), by Country 2025 & 2033
- Figure 49: Middle East & Africa Bio Insecticides Market Revenue Share (%), by Country 2025 & 2033
- Figure 50: Asia Pacific Bio Insecticides Market Revenue (undefined), by Production Analysis 2025 & 2033
- Figure 51: Asia Pacific Bio Insecticides Market Revenue Share (%), by Production Analysis 2025 & 2033
- Figure 52: Asia Pacific Bio Insecticides Market Revenue (undefined), by Consumption Analysis 2025 & 2033
- Figure 53: Asia Pacific Bio Insecticides Market Revenue Share (%), by Consumption Analysis 2025 & 2033
- Figure 54: Asia Pacific Bio Insecticides Market Revenue (undefined), by Import Market Analysis (Value & Volume) 2025 & 2033
- Figure 55: Asia Pacific Bio Insecticides Market Revenue Share (%), by Import Market Analysis (Value & Volume) 2025 & 2033
- Figure 56: Asia Pacific Bio Insecticides Market Revenue (undefined), by Export Market Analysis (Value & Volume) 2025 & 2033
- Figure 57: Asia Pacific Bio Insecticides Market Revenue Share (%), by Export Market Analysis (Value & Volume) 2025 & 2033
- Figure 58: Asia Pacific Bio Insecticides Market Revenue (undefined), by Price Trend Analysis 2025 & 2033
- Figure 59: Asia Pacific Bio Insecticides Market Revenue Share (%), by Price Trend Analysis 2025 & 2033
- Figure 60: Asia Pacific Bio Insecticides Market Revenue (undefined), by Country 2025 & 2033
- Figure 61: Asia Pacific Bio Insecticides Market Revenue Share (%), by Country 2025 & 2033
List of Tables
- Table 1: Global Bio Insecticides Market Revenue undefined Forecast, by Production Analysis 2020 & 2033
- Table 2: Global Bio Insecticides Market Revenue undefined Forecast, by Consumption Analysis 2020 & 2033
- Table 3: Global Bio Insecticides Market Revenue undefined Forecast, by Import Market Analysis (Value & Volume) 2020 & 2033
- Table 4: Global Bio Insecticides Market Revenue undefined Forecast, by Export Market Analysis (Value & Volume) 2020 & 2033
- Table 5: Global Bio Insecticides Market Revenue undefined Forecast, by Price Trend Analysis 2020 & 2033
- Table 6: Global Bio Insecticides Market Revenue undefined Forecast, by Region 2020 & 2033
- Table 7: Global Bio Insecticides Market Revenue undefined Forecast, by Production Analysis 2020 & 2033
- Table 8: Global Bio Insecticides Market Revenue undefined Forecast, by Consumption Analysis 2020 & 2033
- Table 9: Global Bio Insecticides Market Revenue undefined Forecast, by Import Market Analysis (Value & Volume) 2020 & 2033
- Table 10: Global Bio Insecticides Market Revenue undefined Forecast, by Export Market Analysis (Value & Volume) 2020 & 2033
- Table 11: Global Bio Insecticides Market Revenue undefined Forecast, by Price Trend Analysis 2020 & 2033
- Table 12: Global Bio Insecticides Market Revenue undefined Forecast, by Country 2020 & 2033
- Table 13: United States Bio Insecticides Market Revenue (undefined) Forecast, by Application 2020 & 2033
- Table 14: Canada Bio Insecticides Market Revenue (undefined) Forecast, by Application 2020 & 2033
- Table 15: Mexico Bio Insecticides Market Revenue (undefined) Forecast, by Application 2020 & 2033
- Table 16: Global Bio Insecticides Market Revenue undefined Forecast, by Production Analysis 2020 & 2033
- Table 17: Global Bio Insecticides Market Revenue undefined Forecast, by Consumption Analysis 2020 & 2033
- Table 18: Global Bio Insecticides Market Revenue undefined Forecast, by Import Market Analysis (Value & Volume) 2020 & 2033
- Table 19: Global Bio Insecticides Market Revenue undefined Forecast, by Export Market Analysis (Value & Volume) 2020 & 2033
- Table 20: Global Bio Insecticides Market Revenue undefined Forecast, by Price Trend Analysis 2020 & 2033
- Table 21: Global Bio Insecticides Market Revenue undefined Forecast, by Country 2020 & 2033
- Table 22: Brazil Bio Insecticides Market Revenue (undefined) Forecast, by Application 2020 & 2033
- Table 23: Argentina Bio Insecticides Market Revenue (undefined) Forecast, by Application 2020 & 2033
- Table 24: Rest of South America Bio Insecticides Market Revenue (undefined) Forecast, by Application 2020 & 2033
- Table 25: Global Bio Insecticides Market Revenue undefined Forecast, by Production Analysis 2020 & 2033
- Table 26: Global Bio Insecticides Market Revenue undefined Forecast, by Consumption Analysis 2020 & 2033
- Table 27: Global Bio Insecticides Market Revenue undefined Forecast, by Import Market Analysis (Value & Volume) 2020 & 2033
- Table 28: Global Bio Insecticides Market Revenue undefined Forecast, by Export Market Analysis (Value & Volume) 2020 & 2033
- Table 29: Global Bio Insecticides Market Revenue undefined Forecast, by Price Trend Analysis 2020 & 2033
- Table 30: Global Bio Insecticides Market Revenue undefined Forecast, by Country 2020 & 2033
- Table 31: United Kingdom Bio Insecticides Market Revenue (undefined) Forecast, by Application 2020 & 2033
- Table 32: Germany Bio Insecticides Market Revenue (undefined) Forecast, by Application 2020 & 2033
- Table 33: France Bio Insecticides Market Revenue (undefined) Forecast, by Application 2020 & 2033
- Table 34: Italy Bio Insecticides Market Revenue (undefined) Forecast, by Application 2020 & 2033
- Table 35: Spain Bio Insecticides Market Revenue (undefined) Forecast, by Application 2020 & 2033
- Table 36: Russia Bio Insecticides Market Revenue (undefined) Forecast, by Application 2020 & 2033
- Table 37: Benelux Bio Insecticides Market Revenue (undefined) Forecast, by Application 2020 & 2033
- Table 38: Nordics Bio Insecticides Market Revenue (undefined) Forecast, by Application 2020 & 2033
- Table 39: Rest of Europe Bio Insecticides Market Revenue (undefined) Forecast, by Application 2020 & 2033
- Table 40: Global Bio Insecticides Market Revenue undefined Forecast, by Production Analysis 2020 & 2033
- Table 41: Global Bio Insecticides Market Revenue undefined Forecast, by Consumption Analysis 2020 & 2033
- Table 42: Global Bio Insecticides Market Revenue undefined Forecast, by Import Market Analysis (Value & Volume) 2020 & 2033
- Table 43: Global Bio Insecticides Market Revenue undefined Forecast, by Export Market Analysis (Value & Volume) 2020 & 2033
- Table 44: Global Bio Insecticides Market Revenue undefined Forecast, by Price Trend Analysis 2020 & 2033
- Table 45: Global Bio Insecticides Market Revenue undefined Forecast, by Country 2020 & 2033
- Table 46: Turkey Bio Insecticides Market Revenue (undefined) Forecast, by Application 2020 & 2033
- Table 47: Israel Bio Insecticides Market Revenue (undefined) Forecast, by Application 2020 & 2033
- Table 48: GCC Bio Insecticides Market Revenue (undefined) Forecast, by Application 2020 & 2033
- Table 49: North Africa Bio Insecticides Market Revenue (undefined) Forecast, by Application 2020 & 2033
- Table 50: South Africa Bio Insecticides Market Revenue (undefined) Forecast, by Application 2020 & 2033
- Table 51: Rest of Middle East & Africa Bio Insecticides Market Revenue (undefined) Forecast, by Application 2020 & 2033
- Table 52: Global Bio Insecticides Market Revenue undefined Forecast, by Production Analysis 2020 & 2033
- Table 53: Global Bio Insecticides Market Revenue undefined Forecast, by Consumption Analysis 2020 & 2033
- Table 54: Global Bio Insecticides Market Revenue undefined Forecast, by Import Market Analysis (Value & Volume) 2020 & 2033
- Table 55: Global Bio Insecticides Market Revenue undefined Forecast, by Export Market Analysis (Value & Volume) 2020 & 2033
- Table 56: Global Bio Insecticides Market Revenue undefined Forecast, by Price Trend Analysis 2020 & 2033
- Table 57: Global Bio Insecticides Market Revenue undefined Forecast, by Country 2020 & 2033
- Table 58: China Bio Insecticides Market Revenue (undefined) Forecast, by Application 2020 & 2033
- Table 59: India Bio Insecticides Market Revenue (undefined) Forecast, by Application 2020 & 2033
- Table 60: Japan Bio Insecticides Market Revenue (undefined) Forecast, by Application 2020 & 2033
- Table 61: South Korea Bio Insecticides Market Revenue (undefined) Forecast, by Application 2020 & 2033
- Table 62: ASEAN Bio Insecticides Market Revenue (undefined) Forecast, by Application 2020 & 2033
- Table 63: Oceania Bio Insecticides Market Revenue (undefined) Forecast, by Application 2020 & 2033
- Table 64: Rest of Asia Pacific Bio Insecticides Market Revenue (undefined) Forecast, by Application 2020 & 2033
Frequently Asked Questions
1. What is the projected Compound Annual Growth Rate (CAGR) of the Bio Insecticides Market?
The projected CAGR is approximately 14.6%.
2. Which companies are prominent players in the Bio Insecticides Market?
Key companies in the market include Marrone Bio innovations, Bayer Cropscience AG, Certis LLC, Bioworks Inc, Valent Biosciences Corporation*List Not Exhaustive, Isagro Spa, Corteva Agriscience, Novozymes AS, Koppert Biological Systems, BASF SE.
3. What are the main segments of the Bio Insecticides Market?
The market segments include Production Analysis, Consumption Analysis, Import Market Analysis (Value & Volume), Export Market Analysis (Value & Volume), Price Trend Analysis.
4. Can you provide details about the market size?
The market size is estimated to be USD XXX N/A as of 2022.
5. What are some drivers contributing to market growth?
Demand For Landscaping Maintenance; Adoption of Green Spaces and Green Roofs.
6. What are the notable trends driving market growth?
Fruits and Vegetables Occupy the Largest Share By Application.
7. Are there any restraints impacting market growth?
Shortage of Labor In Landscaping; High Maintenance Cost of Lawn Mowers.
8. Can you provide examples of recent developments in the market?
N/A
9. What pricing options are available for accessing the report?
Pricing options include single-user, multi-user, and enterprise licenses priced at USD 4750, USD 5250, and USD 8750 respectively.
10. Is the market size provided in terms of value or volume?
The market size is provided in terms of value, measured in N/A.
11. Are there any specific market keywords associated with the report?
Yes, the market keyword associated with the report is "Bio Insecticides Market," which aids in identifying and referencing the specific market segment covered.
12. How do I determine which pricing option suits my needs best?
The pricing options vary based on user requirements and access needs. Individual users may opt for single-user licenses, while businesses requiring broader access may choose multi-user or enterprise licenses for cost-effective access to the report.
13. Are there any additional resources or data provided in the Bio Insecticides Market report?
While the report offers comprehensive insights, it's advisable to review the specific contents or supplementary materials provided to ascertain if additional resources or data are available.
14. How can I stay updated on further developments or reports in the Bio Insecticides Market?
To stay informed about further developments, trends, and reports in the Bio Insecticides Market, consider subscribing to industry newsletters, following relevant companies and organizations, or regularly checking reputable industry news sources and publications.
Methodology
Step 1 - Identification of Relevant Samples Size from Population Database


Step 2 - Approaches for Defining Global Market Size (Value, Volume* & Price*)

Note*: In applicable scenarios
Step 3 - Data Sources
Primary Research
- Web Analytics
- Survey Reports
- Research Institute
- Latest Research Reports
- Opinion Leaders
Secondary Research
- Annual Reports
- White Paper
- Latest Press Release
- Industry Association
- Paid Database
- Investor Presentations

Step 4 - Data Triangulation
Involves using different sources of information in order to increase the validity of a study
These sources are likely to be stakeholders in a program - participants, other researchers, program staff, other community members, and so on.
Then we put all data in single framework & apply various statistical tools to find out the dynamic on the market.
During the analysis stage, feedback from the stakeholder groups would be compared to determine areas of agreement as well as areas of divergence