

Key Insights
The global Back Office Outsourcing market is poised for significant expansion, projected to reach $471,250 million by 2033, growing at a robust 7.2% CAGR. This substantial market size underscores the increasing reliance of businesses across various sectors on specialized external providers for their non-core operational functions. Key drivers fueling this growth include the relentless pursuit of cost efficiencies, the need for enhanced technological capabilities, and the strategic advantage gained by allowing organizations to focus on core competencies. Industries such as Banking, Manufacturing, and Logistics are leading the charge, leveraging back office outsourcing to streamline operations, improve service delivery, and adapt to evolving market demands. The market is segmented into Finance and Accounting Outsourcing (FAO), Human Resources Outsourcing (HRO), Customer Relationship Management (CRM), and Procurement Outsourcing (PO), each offering specialized solutions to meet diverse business needs. Emerging economies, particularly in the Asia Pacific region, are expected to witness accelerated growth due to increasing digitalization and a burgeoning pool of skilled talent.

Back Office Outsourcing Market Size (In Billion)
The competitive landscape is characterized by the presence of major global players like IBM, Accenture, HP, Infosys, and TCS, alongside specialized service providers such as Ariba and eClerx. These companies are continuously innovating, offering integrated solutions and leveraging advanced technologies like AI and automation to deliver greater value to their clients. Trends such as the rise of business process as a service (BPaaS) and a greater emphasis on data analytics and cybersecurity within outsourced operations are shaping the market's trajectory. However, challenges such as data security concerns, regulatory compliance complexities, and the potential for a loss of direct control over certain business functions present ongoing restraints. Despite these hurdles, the overarching benefits of agility, scalability, and access to specialized expertise are expected to propel the Back Office Outsourcing market to new heights in the coming years.

Back Office Outsourcing Company Market Share
Unveiling the Future: A Comprehensive Report on Back Office Outsourcing
Explore the transformative landscape of Back Office Outsourcing (BOO) with this in-depth market analysis. This report provides critical insights into market dynamics, industry trends, leading segments, and future growth opportunities for stakeholders across Banking, Manufacturing, Logistics, and other key sectors. Leveraging data from 2019–2033, including a 2025 base year, this report is your definitive guide to navigating the evolving world of FAO, HRO, CRM, and PO.
Back Office Outsourcing Market Dynamics & Concentration
The Back Office Outsourcing market is characterized by a dynamic interplay of innovation, regulatory evolution, and shifting end-user demands. Market concentration is evident, with major players like IBM, Accenture, HP, Infosys, TCS, and Capgemini holding significant market share, estimated at over 70% combined. The market is driven by a relentless pursuit of innovation, particularly in leveraging AI, automation, and cloud technologies to enhance efficiency and reduce costs. Regulatory frameworks, while sometimes posing compliance challenges, also foster standardization and trust, especially within the Banking sector. Product substitutes, such as in-house development and emerging AI-native solutions, are present but currently do not fully displace the comprehensive service offerings of established BOO providers. End-user trends lean towards a greater demand for specialized services, data analytics integration, and robust cybersecurity measures. M&A activities are robust, with an estimated 50 major deals in the historical period (2019-2024), indicating a consolidation trend aimed at expanding service portfolios and geographical reach. The total market value in the base year 2025 is projected to reach $500 million.
Back Office Outsourcing Industry Trends & Analysis
The Back Office Outsourcing industry is poised for significant expansion, with a projected CAGR of 12.5% from 2025 to 2033. This robust growth is fueled by a confluence of factors, including the escalating need for operational efficiency, cost optimization, and access to specialized expertise across diverse business functions. Technological disruptions are at the forefront, with the widespread adoption of Artificial Intelligence (AI), Robotic Process Automation (RPA), and Machine Learning (ML) transforming how back-office tasks are executed. These technologies are not only automating routine processes but also enabling advanced data analytics, predictive insights, and personalized customer experiences. Consumer preferences are shifting towards seamless, omnichannel interactions, driving demand for advanced Customer Relationship Management (CRM) outsourcing solutions that can manage complex customer journeys. Furthermore, the increasing complexity of global supply chains and financial regulations is pushing businesses in Manufacturing and Logistics to seek expert support through Procurement Outsourcing (PO) and Finance and Accounting Outsourcing (FAO). The competitive dynamics are intensifying, with established giants like Accenture and Infosys continuously innovating and smaller, niche players carving out specific market segments. Market penetration is expected to reach 65% of addressable businesses by 2030. The overall market size is estimated to grow from $500 million in 2025 to over $1,200 million by 2033.
Leading Markets & Segments in Back Office Outsourcing
The Banking sector stands as the dominant market within Back Office Outsourcing, driven by stringent regulatory compliance requirements, the imperative for secure data management, and the continuous need for efficient transaction processing. Within the Banking application, Finance and Accounting Outsourcing (FAO) commands the largest share, with an estimated 35% of the BOO market. This is followed closely by Human Resources Outsourcing (HRO), crucial for managing payroll, benefits, and talent acquisition in a highly regulated environment.
- Key Drivers for Banking Dominance:
- Stringent Regulatory Compliance: Adherence to global and local financial regulations necessitates specialized expertise and robust internal controls, which outsourcing partners can provide.
- Cost Optimization: Banks are under constant pressure to reduce operational costs, making outsourcing of non-core functions a strategic imperative.
- Technological Advancement: The adoption of FinTech solutions and the need for advanced data analytics for fraud detection and risk management drive demand for specialized IT and processing services.
- Customer Experience Enhancement: Outsourced CRM solutions enable banks to offer personalized services and manage a growing volume of customer interactions efficiently.
In terms of Type, Finance and Accounting Outsourcing (FAO) is the most prevalent segment across all applications, representing approximately 40% of the global BOO market. This is closely followed by Customer Relationship Management (CRM) at around 25%, driven by the universal need for effective customer engagement. Human Resources Outsourcing (HRO) accounts for 20%, while Procurement Outsourcing (PO), particularly significant in Manufacturing and Logistics, captures the remaining 15%.
- Dominance Analysis of Segments:
- FAO: The inherent complexity of financial operations, including accounting, bookkeeping, payroll processing, and tax compliance, makes it a prime candidate for outsourcing. Companies like eClerx and Birlasoft have built strong reputations in this domain.
- CRM: With the increasing focus on customer retention and loyalty, businesses across all sectors are investing in sophisticated CRM systems and require expert management of customer data, support, and sales processes.
- HRO: Managing employee lifecycle processes, from recruitment to offboarding, is time-consuming and requires specialized HR knowledge. Outsourcing allows companies to focus on strategic HR initiatives.
- PO: In industries like Manufacturing and Logistics, optimizing supply chains, managing vendor relationships, and ensuring cost-effective procurement are critical. Providers like Ariba and ICG Commerce specialize in these areas.
The overall market size for Back Office Outsourcing in 2025 is estimated at $500 million, with FAO expected to contribute $200 million and CRM $125 million.
Back Office Outsourcing Product Developments
Recent product developments in Back Office Outsourcing are heavily influenced by advancements in AI, automation, and cloud computing. Key innovations include intelligent automation platforms that offer end-to-end process management for FAO and HRO, predictive analytics for CRM to enhance customer engagement strategies, and blockchain-enabled solutions for secure and transparent procurement. These developments offer enhanced operational efficiency, cost savings estimated at 15-20%, and improved data accuracy, providing a significant competitive advantage to businesses leveraging these advanced solutions. The market fit is strong, addressing the growing need for agile, scalable, and intelligent back-office operations.
Key Drivers of Back Office Outsourcing Growth
The growth of the Back Office Outsourcing market is propelled by several key drivers. Technological advancements, particularly the integration of AI and RPA, are automating complex tasks and improving efficiency, leading to estimated cost savings of 20%. The escalating need for cost optimization and operational efficiency across industries like Banking and Manufacturing pushes businesses to leverage the economies of scale offered by outsourcing providers. Furthermore, evolving regulatory landscapes, especially in Finance and HR, create a demand for specialized expertise that BOO firms can readily provide, ensuring compliance and mitigating risks. The global trend towards digital transformation further amplifies the need for agile and scalable back-office solutions.
Challenges in the Back Office Outsourcing Market
Despite its robust growth, the Back Office Outsourcing market faces significant challenges. Regulatory hurdles remain a concern, with evolving data privacy laws (e.g., GDPR, CCPA) requiring constant adaptation and increased compliance costs. Cybersecurity threats are a persistent risk, demanding substantial investment in robust security infrastructure and protocols from outsourcing providers, with potential breach costs estimated in the millions. Intensifying competition from both established players and emerging niche providers can lead to price wars and pressure on profit margins. Furthermore, managing cross-cultural communication and time zone differences in global outsourcing models can impact service delivery and client satisfaction, potentially leading to project delays and cost overruns, estimated at 5% of project value.
Emerging Opportunities in Back Office Outsourcing
Emerging opportunities in the Back Office Outsourcing market are centered around the continued integration of cutting-edge technologies and strategic market expansion. The increasing maturity of AI and machine learning presents opportunities for hyper-automation of complex processes, offering deeper insights and predictive capabilities in FAO and CRM. Strategic partnerships with FinTech and InsurTech companies can unlock new service offerings for the Banking sector. Furthermore, the growing demand for specialized outsourcing in emerging economies, particularly in Asia-Pacific, represents a significant market expansion opportunity, with potential for 15% revenue growth in these regions. The focus on data analytics and business intelligence as a core BOO service will also drive significant growth.
Leading Players in the Back Office Outsourcing Sector
- IBM
- Accenture
- HP
- Infosys
- TCS
- HCL
- Ariba
- ICG Commerce
- eClerx
- Capgemini
- Birlasoft
Key Milestones in Back Office Outsourcing Industry
- 2019: Increased adoption of Robotic Process Automation (RPA) for routine back-office tasks, leading to efficiency gains.
- 2020: Surge in demand for cloud-based HR and Finance outsourcing solutions due to remote work trends.
- 2021: Significant investments in AI and machine learning by major players to enhance service offerings in CRM and FAO.
- 2022: Growing focus on data analytics and business intelligence as part of core outsourcing services.
- 2023: Increased M&A activity as companies consolidate to expand service portfolios and market reach, with over 20 deals exceeding $50 million each.
- 2024: Heightened emphasis on cybersecurity and data privacy compliance within outsourcing contracts, driven by global regulations.
Strategic Outlook for Back Office Outsourcing Market
The strategic outlook for the Back Office Outsourcing market is exceptionally positive, driven by accelerating digital transformation and the persistent need for operational agility and cost efficiency. The continued evolution and adoption of AI and automation will further enhance the value proposition of outsourcing providers, enabling them to offer more sophisticated analytics and predictive capabilities. Strategic partnerships and mergers will continue to shape the competitive landscape, leading to more integrated and comprehensive service offerings. The focus will shift towards specialized, outcome-based outsourcing models, particularly in sectors like Banking and Manufacturing, promising sustained growth and market expansion. The total market is projected to reach $1,200 million by 2033.
Back Office Outsourcing Segmentation
-
1. Application
- 1.1. Banking
- 1.2. Manufacturing
- 1.3. Logistics
- 1.4. Others
-
2. Type
- 2.1. Finance and Accounting Outsourcing(FAO)
- 2.2. Human Resources Outsourcing(HRO)
- 2.3. Customer Relationship Management(CRM)
- 2.4. Procurement Outsourcing(PO)
Back Office Outsourcing Segmentation By Geography
-
1. North America
- 1.1. United States
- 1.2. Canada
- 1.3. Mexico
-
2. South America
- 2.1. Brazil
- 2.2. Argentina
- 2.3. Rest of South America
-
3. Europe
- 3.1. United Kingdom
- 3.2. Germany
- 3.3. France
- 3.4. Italy
- 3.5. Spain
- 3.6. Russia
- 3.7. Benelux
- 3.8. Nordics
- 3.9. Rest of Europe
-
4. Middle East & Africa
- 4.1. Turkey
- 4.2. Israel
- 4.3. GCC
- 4.4. North Africa
- 4.5. South Africa
- 4.6. Rest of Middle East & Africa
-
5. Asia Pacific
- 5.1. China
- 5.2. India
- 5.3. Japan
- 5.4. South Korea
- 5.5. ASEAN
- 5.6. Oceania
- 5.7. Rest of Asia Pacific
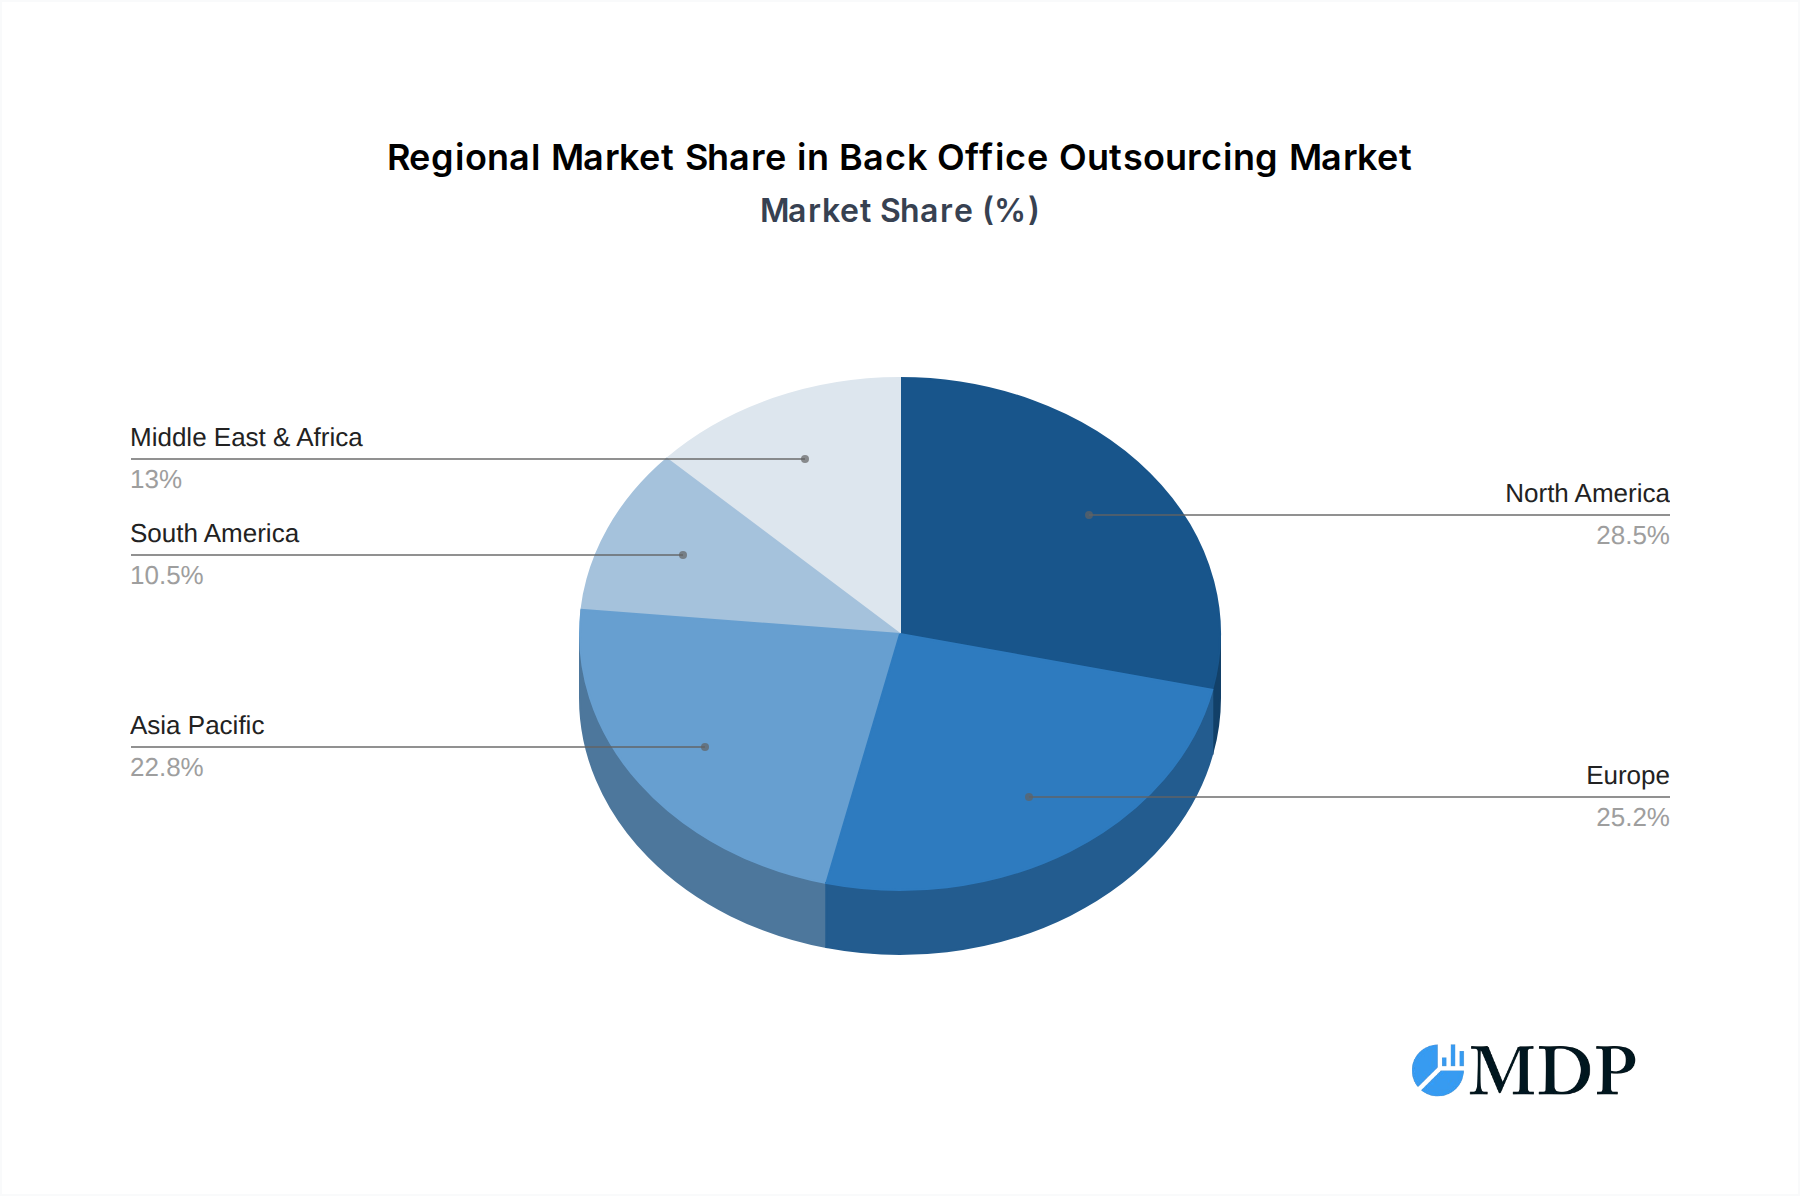
Back Office Outsourcing Regional Market Share
Geographic Coverage of Back Office Outsourcing
Back Office Outsourcing REPORT HIGHLIGHTS
| Aspects | Details |
|---|---|
| Study Period | 2020-2034 |
| Base Year | 2025 |
| Estimated Year | 2026 |
| Forecast Period | 2026-2034 |
| Historical Period | 2020-2025 |
| Growth Rate | CAGR of 7.2% from 2020-2034 |
| Segmentation |
|
Table of Contents
- 1. Introduction
- 1.1. Research Scope
- 1.2. Market Segmentation
- 1.3. Research Methodology
- 1.4. Definitions and Assumptions
- 2. Executive Summary
- 2.1. Introduction
- 3. Market Dynamics
- 3.1. Introduction
- 3.2. Market Drivers
- 3.3. Market Restrains
- 3.4. Market Trends
- 4. Market Factor Analysis
- 4.1. Porters Five Forces
- 4.2. Supply/Value Chain
- 4.3. PESTEL analysis
- 4.4. Market Entropy
- 4.5. Patent/Trademark Analysis
- 5. Global Back Office Outsourcing Analysis, Insights and Forecast, 2020-2032
- 5.1. Market Analysis, Insights and Forecast - by Application
- 5.1.1. Banking
- 5.1.2. Manufacturing
- 5.1.3. Logistics
- 5.1.4. Others
- 5.2. Market Analysis, Insights and Forecast - by Type
- 5.2.1. Finance and Accounting Outsourcing(FAO)
- 5.2.2. Human Resources Outsourcing(HRO)
- 5.2.3. Customer Relationship Management(CRM)
- 5.2.4. Procurement Outsourcing(PO)
- 5.3. Market Analysis, Insights and Forecast - by Region
- 5.3.1. North America
- 5.3.2. South America
- 5.3.3. Europe
- 5.3.4. Middle East & Africa
- 5.3.5. Asia Pacific
- 5.1. Market Analysis, Insights and Forecast - by Application
- 6. North America Back Office Outsourcing Analysis, Insights and Forecast, 2020-2032
- 6.1. Market Analysis, Insights and Forecast - by Application
- 6.1.1. Banking
- 6.1.2. Manufacturing
- 6.1.3. Logistics
- 6.1.4. Others
- 6.2. Market Analysis, Insights and Forecast - by Type
- 6.2.1. Finance and Accounting Outsourcing(FAO)
- 6.2.2. Human Resources Outsourcing(HRO)
- 6.2.3. Customer Relationship Management(CRM)
- 6.2.4. Procurement Outsourcing(PO)
- 6.1. Market Analysis, Insights and Forecast - by Application
- 7. South America Back Office Outsourcing Analysis, Insights and Forecast, 2020-2032
- 7.1. Market Analysis, Insights and Forecast - by Application
- 7.1.1. Banking
- 7.1.2. Manufacturing
- 7.1.3. Logistics
- 7.1.4. Others
- 7.2. Market Analysis, Insights and Forecast - by Type
- 7.2.1. Finance and Accounting Outsourcing(FAO)
- 7.2.2. Human Resources Outsourcing(HRO)
- 7.2.3. Customer Relationship Management(CRM)
- 7.2.4. Procurement Outsourcing(PO)
- 7.1. Market Analysis, Insights and Forecast - by Application
- 8. Europe Back Office Outsourcing Analysis, Insights and Forecast, 2020-2032
- 8.1. Market Analysis, Insights and Forecast - by Application
- 8.1.1. Banking
- 8.1.2. Manufacturing
- 8.1.3. Logistics
- 8.1.4. Others
- 8.2. Market Analysis, Insights and Forecast - by Type
- 8.2.1. Finance and Accounting Outsourcing(FAO)
- 8.2.2. Human Resources Outsourcing(HRO)
- 8.2.3. Customer Relationship Management(CRM)
- 8.2.4. Procurement Outsourcing(PO)
- 8.1. Market Analysis, Insights and Forecast - by Application
- 9. Middle East & Africa Back Office Outsourcing Analysis, Insights and Forecast, 2020-2032
- 9.1. Market Analysis, Insights and Forecast - by Application
- 9.1.1. Banking
- 9.1.2. Manufacturing
- 9.1.3. Logistics
- 9.1.4. Others
- 9.2. Market Analysis, Insights and Forecast - by Type
- 9.2.1. Finance and Accounting Outsourcing(FAO)
- 9.2.2. Human Resources Outsourcing(HRO)
- 9.2.3. Customer Relationship Management(CRM)
- 9.2.4. Procurement Outsourcing(PO)
- 9.1. Market Analysis, Insights and Forecast - by Application
- 10. Asia Pacific Back Office Outsourcing Analysis, Insights and Forecast, 2020-2032
- 10.1. Market Analysis, Insights and Forecast - by Application
- 10.1.1. Banking
- 10.1.2. Manufacturing
- 10.1.3. Logistics
- 10.1.4. Others
- 10.2. Market Analysis, Insights and Forecast - by Type
- 10.2.1. Finance and Accounting Outsourcing(FAO)
- 10.2.2. Human Resources Outsourcing(HRO)
- 10.2.3. Customer Relationship Management(CRM)
- 10.2.4. Procurement Outsourcing(PO)
- 10.1. Market Analysis, Insights and Forecast - by Application
- 11. Competitive Analysis
- 11.1. Global Market Share Analysis 2025
- 11.2. Company Profiles
- 11.2.1 IBM
- 11.2.1.1. Overview
- 11.2.1.2. Products
- 11.2.1.3. SWOT Analysis
- 11.2.1.4. Recent Developments
- 11.2.1.5. Financials (Based on Availability)
- 11.2.2 Accenture
- 11.2.2.1. Overview
- 11.2.2.2. Products
- 11.2.2.3. SWOT Analysis
- 11.2.2.4. Recent Developments
- 11.2.2.5. Financials (Based on Availability)
- 11.2.3 HP
- 11.2.3.1. Overview
- 11.2.3.2. Products
- 11.2.3.3. SWOT Analysis
- 11.2.3.4. Recent Developments
- 11.2.3.5. Financials (Based on Availability)
- 11.2.4 Infosys
- 11.2.4.1. Overview
- 11.2.4.2. Products
- 11.2.4.3. SWOT Analysis
- 11.2.4.4. Recent Developments
- 11.2.4.5. Financials (Based on Availability)
- 11.2.5 TCS
- 11.2.5.1. Overview
- 11.2.5.2. Products
- 11.2.5.3. SWOT Analysis
- 11.2.5.4. Recent Developments
- 11.2.5.5. Financials (Based on Availability)
- 11.2.6 HCL
- 11.2.6.1. Overview
- 11.2.6.2. Products
- 11.2.6.3. SWOT Analysis
- 11.2.6.4. Recent Developments
- 11.2.6.5. Financials (Based on Availability)
- 11.2.7 Ariba
- 11.2.7.1. Overview
- 11.2.7.2. Products
- 11.2.7.3. SWOT Analysis
- 11.2.7.4. Recent Developments
- 11.2.7.5. Financials (Based on Availability)
- 11.2.8 ICG Commerce
- 11.2.8.1. Overview
- 11.2.8.2. Products
- 11.2.8.3. SWOT Analysis
- 11.2.8.4. Recent Developments
- 11.2.8.5. Financials (Based on Availability)
- 11.2.9 eClerx
- 11.2.9.1. Overview
- 11.2.9.2. Products
- 11.2.9.3. SWOT Analysis
- 11.2.9.4. Recent Developments
- 11.2.9.5. Financials (Based on Availability)
- 11.2.10 Capgemini
- 11.2.10.1. Overview
- 11.2.10.2. Products
- 11.2.10.3. SWOT Analysis
- 11.2.10.4. Recent Developments
- 11.2.10.5. Financials (Based on Availability)
- 11.2.11 Birlasoft
- 11.2.11.1. Overview
- 11.2.11.2. Products
- 11.2.11.3. SWOT Analysis
- 11.2.11.4. Recent Developments
- 11.2.11.5. Financials (Based on Availability)
- 11.2.1 IBM
List of Figures
- Figure 1: Global Back Office Outsourcing Revenue Breakdown (million, %) by Region 2025 & 2033
- Figure 2: North America Back Office Outsourcing Revenue (million), by Application 2025 & 2033
- Figure 3: North America Back Office Outsourcing Revenue Share (%), by Application 2025 & 2033
- Figure 4: North America Back Office Outsourcing Revenue (million), by Type 2025 & 2033
- Figure 5: North America Back Office Outsourcing Revenue Share (%), by Type 2025 & 2033
- Figure 6: North America Back Office Outsourcing Revenue (million), by Country 2025 & 2033
- Figure 7: North America Back Office Outsourcing Revenue Share (%), by Country 2025 & 2033
- Figure 8: South America Back Office Outsourcing Revenue (million), by Application 2025 & 2033
- Figure 9: South America Back Office Outsourcing Revenue Share (%), by Application 2025 & 2033
- Figure 10: South America Back Office Outsourcing Revenue (million), by Type 2025 & 2033
- Figure 11: South America Back Office Outsourcing Revenue Share (%), by Type 2025 & 2033
- Figure 12: South America Back Office Outsourcing Revenue (million), by Country 2025 & 2033
- Figure 13: South America Back Office Outsourcing Revenue Share (%), by Country 2025 & 2033
- Figure 14: Europe Back Office Outsourcing Revenue (million), by Application 2025 & 2033
- Figure 15: Europe Back Office Outsourcing Revenue Share (%), by Application 2025 & 2033
- Figure 16: Europe Back Office Outsourcing Revenue (million), by Type 2025 & 2033
- Figure 17: Europe Back Office Outsourcing Revenue Share (%), by Type 2025 & 2033
- Figure 18: Europe Back Office Outsourcing Revenue (million), by Country 2025 & 2033
- Figure 19: Europe Back Office Outsourcing Revenue Share (%), by Country 2025 & 2033
- Figure 20: Middle East & Africa Back Office Outsourcing Revenue (million), by Application 2025 & 2033
- Figure 21: Middle East & Africa Back Office Outsourcing Revenue Share (%), by Application 2025 & 2033
- Figure 22: Middle East & Africa Back Office Outsourcing Revenue (million), by Type 2025 & 2033
- Figure 23: Middle East & Africa Back Office Outsourcing Revenue Share (%), by Type 2025 & 2033
- Figure 24: Middle East & Africa Back Office Outsourcing Revenue (million), by Country 2025 & 2033
- Figure 25: Middle East & Africa Back Office Outsourcing Revenue Share (%), by Country 2025 & 2033
- Figure 26: Asia Pacific Back Office Outsourcing Revenue (million), by Application 2025 & 2033
- Figure 27: Asia Pacific Back Office Outsourcing Revenue Share (%), by Application 2025 & 2033
- Figure 28: Asia Pacific Back Office Outsourcing Revenue (million), by Type 2025 & 2033
- Figure 29: Asia Pacific Back Office Outsourcing Revenue Share (%), by Type 2025 & 2033
- Figure 30: Asia Pacific Back Office Outsourcing Revenue (million), by Country 2025 & 2033
- Figure 31: Asia Pacific Back Office Outsourcing Revenue Share (%), by Country 2025 & 2033
List of Tables
- Table 1: Global Back Office Outsourcing Revenue million Forecast, by Application 2020 & 2033
- Table 2: Global Back Office Outsourcing Revenue million Forecast, by Type 2020 & 2033
- Table 3: Global Back Office Outsourcing Revenue million Forecast, by Region 2020 & 2033
- Table 4: Global Back Office Outsourcing Revenue million Forecast, by Application 2020 & 2033
- Table 5: Global Back Office Outsourcing Revenue million Forecast, by Type 2020 & 2033
- Table 6: Global Back Office Outsourcing Revenue million Forecast, by Country 2020 & 2033
- Table 7: United States Back Office Outsourcing Revenue (million) Forecast, by Application 2020 & 2033
- Table 8: Canada Back Office Outsourcing Revenue (million) Forecast, by Application 2020 & 2033
- Table 9: Mexico Back Office Outsourcing Revenue (million) Forecast, by Application 2020 & 2033
- Table 10: Global Back Office Outsourcing Revenue million Forecast, by Application 2020 & 2033
- Table 11: Global Back Office Outsourcing Revenue million Forecast, by Type 2020 & 2033
- Table 12: Global Back Office Outsourcing Revenue million Forecast, by Country 2020 & 2033
- Table 13: Brazil Back Office Outsourcing Revenue (million) Forecast, by Application 2020 & 2033
- Table 14: Argentina Back Office Outsourcing Revenue (million) Forecast, by Application 2020 & 2033
- Table 15: Rest of South America Back Office Outsourcing Revenue (million) Forecast, by Application 2020 & 2033
- Table 16: Global Back Office Outsourcing Revenue million Forecast, by Application 2020 & 2033
- Table 17: Global Back Office Outsourcing Revenue million Forecast, by Type 2020 & 2033
- Table 18: Global Back Office Outsourcing Revenue million Forecast, by Country 2020 & 2033
- Table 19: United Kingdom Back Office Outsourcing Revenue (million) Forecast, by Application 2020 & 2033
- Table 20: Germany Back Office Outsourcing Revenue (million) Forecast, by Application 2020 & 2033
- Table 21: France Back Office Outsourcing Revenue (million) Forecast, by Application 2020 & 2033
- Table 22: Italy Back Office Outsourcing Revenue (million) Forecast, by Application 2020 & 2033
- Table 23: Spain Back Office Outsourcing Revenue (million) Forecast, by Application 2020 & 2033
- Table 24: Russia Back Office Outsourcing Revenue (million) Forecast, by Application 2020 & 2033
- Table 25: Benelux Back Office Outsourcing Revenue (million) Forecast, by Application 2020 & 2033
- Table 26: Nordics Back Office Outsourcing Revenue (million) Forecast, by Application 2020 & 2033
- Table 27: Rest of Europe Back Office Outsourcing Revenue (million) Forecast, by Application 2020 & 2033
- Table 28: Global Back Office Outsourcing Revenue million Forecast, by Application 2020 & 2033
- Table 29: Global Back Office Outsourcing Revenue million Forecast, by Type 2020 & 2033
- Table 30: Global Back Office Outsourcing Revenue million Forecast, by Country 2020 & 2033
- Table 31: Turkey Back Office Outsourcing Revenue (million) Forecast, by Application 2020 & 2033
- Table 32: Israel Back Office Outsourcing Revenue (million) Forecast, by Application 2020 & 2033
- Table 33: GCC Back Office Outsourcing Revenue (million) Forecast, by Application 2020 & 2033
- Table 34: North Africa Back Office Outsourcing Revenue (million) Forecast, by Application 2020 & 2033
- Table 35: South Africa Back Office Outsourcing Revenue (million) Forecast, by Application 2020 & 2033
- Table 36: Rest of Middle East & Africa Back Office Outsourcing Revenue (million) Forecast, by Application 2020 & 2033
- Table 37: Global Back Office Outsourcing Revenue million Forecast, by Application 2020 & 2033
- Table 38: Global Back Office Outsourcing Revenue million Forecast, by Type 2020 & 2033
- Table 39: Global Back Office Outsourcing Revenue million Forecast, by Country 2020 & 2033
- Table 40: China Back Office Outsourcing Revenue (million) Forecast, by Application 2020 & 2033
- Table 41: India Back Office Outsourcing Revenue (million) Forecast, by Application 2020 & 2033
- Table 42: Japan Back Office Outsourcing Revenue (million) Forecast, by Application 2020 & 2033
- Table 43: South Korea Back Office Outsourcing Revenue (million) Forecast, by Application 2020 & 2033
- Table 44: ASEAN Back Office Outsourcing Revenue (million) Forecast, by Application 2020 & 2033
- Table 45: Oceania Back Office Outsourcing Revenue (million) Forecast, by Application 2020 & 2033
- Table 46: Rest of Asia Pacific Back Office Outsourcing Revenue (million) Forecast, by Application 2020 & 2033
Frequently Asked Questions
1. What is the projected Compound Annual Growth Rate (CAGR) of the Back Office Outsourcing?
The projected CAGR is approximately 7.2%.
2. Which companies are prominent players in the Back Office Outsourcing?
Key companies in the market include IBM, Accenture, HP, Infosys, TCS, HCL, Ariba, ICG Commerce, eClerx, Capgemini, Birlasoft.
3. What are the main segments of the Back Office Outsourcing?
The market segments include Application, Type.
4. Can you provide details about the market size?
The market size is estimated to be USD 471250 million as of 2022.
5. What are some drivers contributing to market growth?
N/A
6. What are the notable trends driving market growth?
N/A
7. Are there any restraints impacting market growth?
N/A
8. Can you provide examples of recent developments in the market?
N/A
9. What pricing options are available for accessing the report?
Pricing options include single-user, multi-user, and enterprise licenses priced at USD 3950.00, USD 5925.00, and USD 7900.00 respectively.
10. Is the market size provided in terms of value or volume?
The market size is provided in terms of value, measured in million.
11. Are there any specific market keywords associated with the report?
Yes, the market keyword associated with the report is "Back Office Outsourcing," which aids in identifying and referencing the specific market segment covered.
12. How do I determine which pricing option suits my needs best?
The pricing options vary based on user requirements and access needs. Individual users may opt for single-user licenses, while businesses requiring broader access may choose multi-user or enterprise licenses for cost-effective access to the report.
13. Are there any additional resources or data provided in the Back Office Outsourcing report?
While the report offers comprehensive insights, it's advisable to review the specific contents or supplementary materials provided to ascertain if additional resources or data are available.
14. How can I stay updated on further developments or reports in the Back Office Outsourcing?
To stay informed about further developments, trends, and reports in the Back Office Outsourcing, consider subscribing to industry newsletters, following relevant companies and organizations, or regularly checking reputable industry news sources and publications.
Methodology
Step 1 - Identification of Relevant Samples Size from Population Database


Step 2 - Approaches for Defining Global Market Size (Value, Volume* & Price*)

Note*: In applicable scenarios
Step 3 - Data Sources
Primary Research
- Web Analytics
- Survey Reports
- Research Institute
- Latest Research Reports
- Opinion Leaders
Secondary Research
- Annual Reports
- White Paper
- Latest Press Release
- Industry Association
- Paid Database
- Investor Presentations

Step 4 - Data Triangulation
Involves using different sources of information in order to increase the validity of a study
These sources are likely to be stakeholders in a program - participants, other researchers, program staff, other community members, and so on.
Then we put all data in single framework & apply various statistical tools to find out the dynamic on the market.
During the analysis stage, feedback from the stakeholder groups would be compared to determine areas of agreement as well as areas of divergence