

Key Insights
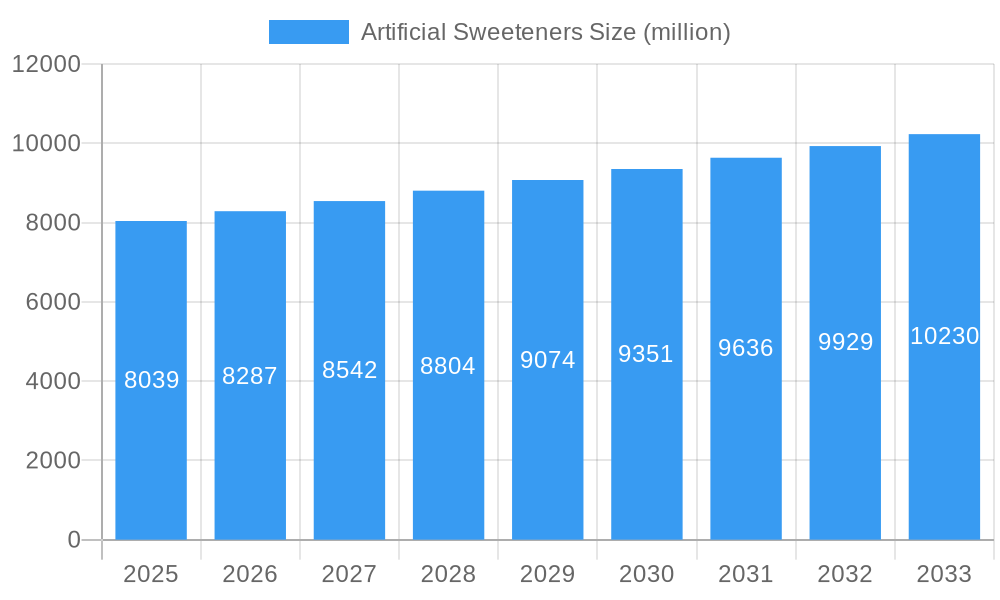
The global artificial sweeteners market is poised for significant expansion, projected to reach $27.61 billion by 2025, with a robust Compound Annual Growth Rate (CAGR) of 7.38% from 2025 to 2033. This upward trajectory is underpinned by a growing consumer emphasis on health and wellness. The escalating incidence of diabetes and obesity worldwide is a primary catalyst, driving demand for effective sugar substitutes among health-conscious individuals actively managing calorie intake and blood glucose levels. The expanding market for diet, sugar-free beverages, and processed foods further accentuates this trend. Continuous innovation in developing artificial sweeteners with enhanced taste and texture profiles, minimizing lingering aftertastes, is a key market driver. Moreover, increased consumer awareness regarding the adverse health impacts of excessive sugar consumption encourages the adoption of healthier alternatives, bolstering market growth.
Artificial Sweeteners Market Size (In Billion)
Despite the positive outlook, market growth faces certain headwinds. Lingering consumer concerns and scientific debate surrounding the potential long-term health implications of specific artificial sweeteners can influence purchasing behavior. Volatility in raw material costs and stringent regulatory frameworks for food additives across diverse geographic regions may affect market stability and manufacturer profitability. The burgeoning popularity of natural sweeteners, such as stevia and monk fruit, perceived as healthier alternatives, presents a competitive challenge to established artificial sweetener products. Nevertheless, concerted research and development efforts aimed at improving the safety and sensory appeal of artificial sweeteners are expected to address these challenges, ensuring sustained market expansion. Key industry players, including Cargill, Tate & Lyle, and Ajinomoto, are strategically investing in R&D and novel product launches to retain market dominance and align with evolving consumer preferences.
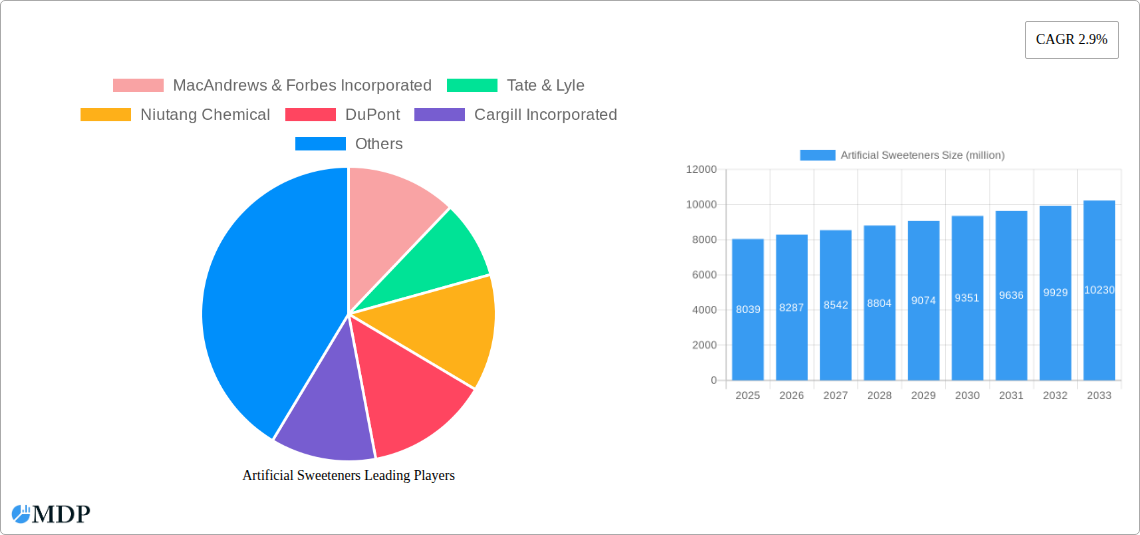
Artificial Sweeteners Company Market Share
Deep Dive into the Artificial Sweeteners Market: A Comprehensive 2019-2033 Forecast
This comprehensive report provides a detailed analysis of the global artificial sweeteners market, projecting a value exceeding $XX million by 2033. Leveraging data from 2019-2024 (historical period), with 2025 as the base and estimated year, this report forecasts market trends until 2033. It's a must-read for industry stakeholders, investors, and strategic decision-makers seeking actionable insights into this dynamic market. The report features in-depth analysis of key players like MacAndrews & Forbes Incorporated, Tate & Lyle, Niutang Chemical, DuPont, Cargill Incorporated, Ajinomoto, Archer Daniels Midland Company, Symrise, Nestle, Associated British Foods, Wilmar International, Ingredion Incorporated, Roquette Freres, and American Sugar Refining.
Artificial Sweeteners Market Dynamics & Concentration
This section analyzes the competitive landscape of the artificial sweeteners market, examining market concentration, innovation drivers, regulatory frameworks, product substitutes, end-user trends, and M&A activities. The global market exhibits a moderately concentrated structure, with the top five players holding approximately xx% market share in 2025. Innovation is primarily driven by the development of novel sweeteners with improved taste profiles and reduced aftertaste. Stringent regulatory frameworks concerning safety and labeling impact market dynamics. Competition from natural sweeteners and sugar alternatives shapes market penetration.
- Market Concentration: Top 5 players hold xx% market share in 2025.
- M&A Activity: Over the period 2019-2024, an estimated xx M&A deals occurred, primarily driven by consolidation and expansion strategies.
- Innovation: Focus on improved taste and reduced aftertaste.
- Regulatory Landscape: Stringent safety and labeling regulations vary across geographies.
Artificial Sweeteners Industry Trends & Analysis
This section explores the key trends shaping the artificial sweeteners market, including market growth drivers, technological disruptions, consumer preferences, and competitive dynamics. The market is projected to experience a CAGR of xx% during the forecast period (2025-2033), driven by increasing demand for low-calorie and sugar-free products. Technological advancements, such as the development of high-intensity sweeteners, are revolutionizing the industry. Consumer preferences are shifting towards healthier alternatives, further fueling market growth. Intense competition among established players and emerging entrants necessitates continuous innovation and strategic partnerships. Market penetration of artificial sweeteners in the food and beverage industry is expected to reach xx% by 2033.
Leading Markets & Segments in Artificial Sweeteners
This section identifies the leading regions, countries, and segments within the artificial sweeteners market. North America is projected to maintain its position as the dominant region throughout the forecast period, driven by high consumer demand and strong regulatory frameworks. The beverage segment is expected to dominate other segments, followed by the food sector.
Key Drivers of North American Dominance:
- High per capita consumption of processed foods and beverages.
- Strong consumer awareness of health and wellness.
- Favorable regulatory environment for artificial sweeteners.
European Market Analysis: The European market is also expected to display significant growth due to increasing health concerns and rising demand for sugar alternatives. However, stricter regulations could pose a challenge to market expansion.
Asia-Pacific Market Outlook: This region exhibits significant growth potential, driven by increasing disposable incomes and changing consumer lifestyles. However, the market's development is restrained by regulatory uncertainty and consumer perception in some key areas.
Artificial Sweeteners Product Developments
Recent advancements in artificial sweetener technology focus on developing novel sweeteners with improved taste profiles and reduced aftertaste. This includes the introduction of high-intensity sweeteners that provide similar sweetness at lower dosages. These developments aim to address consumer concerns about the potential side effects associated with certain artificial sweeteners and create more palatable products. The market is also witnessing increased applications in various segments, including food and beverages, pharmaceuticals, and personal care products.
Key Drivers of Artificial Sweeteners Growth
The growth of the artificial sweeteners market is propelled by several key factors. The increasing prevalence of obesity and diabetes globally fuels the demand for low-calorie and sugar-free options. The rising awareness of the detrimental health effects of excessive sugar consumption is further driving market expansion. Moreover, favorable government regulations and supportive policies related to the use of artificial sweeteners in certain products are facilitating market growth. Technological advancements leading to improved taste and reduced aftertaste of artificial sweeteners are also significant factors.
Challenges in the Artificial Sweeteners Market
Despite significant growth potential, several challenges hinder the expansion of the artificial sweeteners market. Regulatory hurdles and varying safety standards across different regions pose significant hurdles. Fluctuations in raw material prices and supply chain disruptions can impact production costs and profitability. Furthermore, the intense competition among established players and new entrants necessitates continuous innovation and strategic adaptation to maintain a competitive edge. Negative consumer perceptions and concerns over the long-term health effects of artificial sweeteners represent further challenges.
Emerging Opportunities in Artificial Sweeteners
The future of the artificial sweeteners market holds promising opportunities. Technological breakthroughs, such as the development of novel, high-intensity sweeteners with superior functional properties, could revolutionize the market. Strategic collaborations and partnerships between established players and emerging companies offer potential for innovation and market expansion. The increasing use of artificial sweeteners in new product applications in sectors like food and beverages, pharmaceuticals, and personal care products will create substantial opportunities for growth.
Leading Players in the Artificial Sweeteners Sector
- MacAndrews & Forbes Incorporated
- Tate & Lyle
- Niutang Chemical
- DuPont
- Cargill Incorporated
- Ajinomoto
- Archer Daniels Midland Company
- Symrise
- Nestle
- Associated British Foods
- Wilmar International
- Ingredion Incorporated
- Roquette Freres
- American Sugar Refining
Key Milestones in Artificial Sweeteners Industry
- 2020: Launch of a new high-intensity sweetener by Company X.
- 2021: Acquisition of Company Y by Company Z, leading to increased market consolidation.
- 2022: Implementation of stricter regulations regarding labeling and safety standards in Europe.
- 2023: Introduction of a new generation of stevia-based sweeteners.
- 2024: Significant investment in research and development for novel sweetener technologies.
Strategic Outlook for Artificial Sweeteners Market
The artificial sweeteners market presents a compelling investment opportunity with significant long-term growth potential. Continued innovation in sweetener technology, along with strategic partnerships and expansion into emerging markets, will drive future market dynamics. Companies can enhance their market position by focusing on product differentiation, targeted marketing campaigns, and regulatory compliance. The growing health-conscious consumer base and the rising demand for sugar-free options will propel the market forward, making it an attractive sector for investment and expansion.
Artificial Sweeteners Segmentation
-
1. Application
- 1.1. Food and Beverages
- 1.2. Pharmaceuticals
- 1.3. Direct Sales
- 1.4. Others
-
2. Type
- 2.1. Aspartame
- 2.2. Acesulfame k
- 2.3. Saccharin
- 2.4. Sucralose
- 2.5. Neotame
Artificial Sweeteners Segmentation By Geography
-
1. North America
- 1.1. United States
- 1.2. Canada
- 1.3. Mexico
-
2. South America
- 2.1. Brazil
- 2.2. Argentina
- 2.3. Rest of South America
-
3. Europe
- 3.1. United Kingdom
- 3.2. Germany
- 3.3. France
- 3.4. Italy
- 3.5. Spain
- 3.6. Russia
- 3.7. Benelux
- 3.8. Nordics
- 3.9. Rest of Europe
-
4. Middle East & Africa
- 4.1. Turkey
- 4.2. Israel
- 4.3. GCC
- 4.4. North Africa
- 4.5. South Africa
- 4.6. Rest of Middle East & Africa
-
5. Asia Pacific
- 5.1. China
- 5.2. India
- 5.3. Japan
- 5.4. South Korea
- 5.5. ASEAN
- 5.6. Oceania
- 5.7. Rest of Asia Pacific
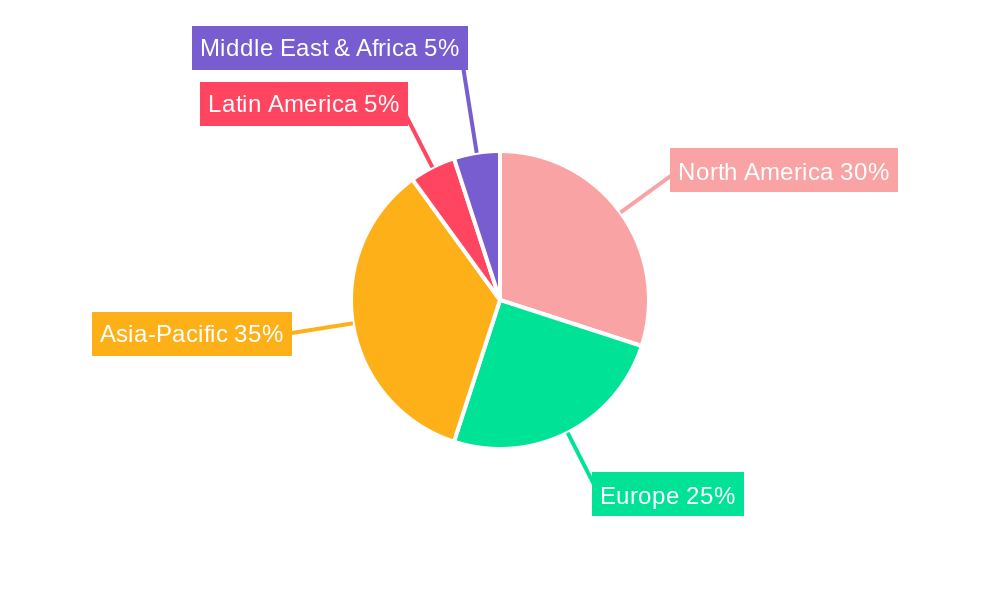
Artificial Sweeteners Regional Market Share
Geographic Coverage of Artificial Sweeteners
Artificial Sweeteners REPORT HIGHLIGHTS
| Aspects | Details |
|---|---|
| Study Period | 2020-2034 |
| Base Year | 2025 |
| Estimated Year | 2026 |
| Forecast Period | 2026-2034 |
| Historical Period | 2020-2025 |
| Growth Rate | CAGR of 7.38% from 2020-2034 |
| Segmentation |
|
Table of Contents
- 1. Introduction
- 1.1. Research Scope
- 1.2. Market Segmentation
- 1.3. Research Methodology
- 1.4. Definitions and Assumptions
- 2. Executive Summary
- 2.1. Introduction
- 3. Market Dynamics
- 3.1. Introduction
- 3.2. Market Drivers
- 3.3. Market Restrains
- 3.4. Market Trends
- 4. Market Factor Analysis
- 4.1. Porters Five Forces
- 4.2. Supply/Value Chain
- 4.3. PESTEL analysis
- 4.4. Market Entropy
- 4.5. Patent/Trademark Analysis
- 5. Global Artificial Sweeteners Analysis, Insights and Forecast, 2020-2032
- 5.1. Market Analysis, Insights and Forecast - by Application
- 5.1.1. Food and Beverages
- 5.1.2. Pharmaceuticals
- 5.1.3. Direct Sales
- 5.1.4. Others
- 5.2. Market Analysis, Insights and Forecast - by Type
- 5.2.1. Aspartame
- 5.2.2. Acesulfame k
- 5.2.3. Saccharin
- 5.2.4. Sucralose
- 5.2.5. Neotame
- 5.3. Market Analysis, Insights and Forecast - by Region
- 5.3.1. North America
- 5.3.2. South America
- 5.3.3. Europe
- 5.3.4. Middle East & Africa
- 5.3.5. Asia Pacific
- 5.1. Market Analysis, Insights and Forecast - by Application
- 6. North America Artificial Sweeteners Analysis, Insights and Forecast, 2020-2032
- 6.1. Market Analysis, Insights and Forecast - by Application
- 6.1.1. Food and Beverages
- 6.1.2. Pharmaceuticals
- 6.1.3. Direct Sales
- 6.1.4. Others
- 6.2. Market Analysis, Insights and Forecast - by Type
- 6.2.1. Aspartame
- 6.2.2. Acesulfame k
- 6.2.3. Saccharin
- 6.2.4. Sucralose
- 6.2.5. Neotame
- 6.1. Market Analysis, Insights and Forecast - by Application
- 7. South America Artificial Sweeteners Analysis, Insights and Forecast, 2020-2032
- 7.1. Market Analysis, Insights and Forecast - by Application
- 7.1.1. Food and Beverages
- 7.1.2. Pharmaceuticals
- 7.1.3. Direct Sales
- 7.1.4. Others
- 7.2. Market Analysis, Insights and Forecast - by Type
- 7.2.1. Aspartame
- 7.2.2. Acesulfame k
- 7.2.3. Saccharin
- 7.2.4. Sucralose
- 7.2.5. Neotame
- 7.1. Market Analysis, Insights and Forecast - by Application
- 8. Europe Artificial Sweeteners Analysis, Insights and Forecast, 2020-2032
- 8.1. Market Analysis, Insights and Forecast - by Application
- 8.1.1. Food and Beverages
- 8.1.2. Pharmaceuticals
- 8.1.3. Direct Sales
- 8.1.4. Others
- 8.2. Market Analysis, Insights and Forecast - by Type
- 8.2.1. Aspartame
- 8.2.2. Acesulfame k
- 8.2.3. Saccharin
- 8.2.4. Sucralose
- 8.2.5. Neotame
- 8.1. Market Analysis, Insights and Forecast - by Application
- 9. Middle East & Africa Artificial Sweeteners Analysis, Insights and Forecast, 2020-2032
- 9.1. Market Analysis, Insights and Forecast - by Application
- 9.1.1. Food and Beverages
- 9.1.2. Pharmaceuticals
- 9.1.3. Direct Sales
- 9.1.4. Others
- 9.2. Market Analysis, Insights and Forecast - by Type
- 9.2.1. Aspartame
- 9.2.2. Acesulfame k
- 9.2.3. Saccharin
- 9.2.4. Sucralose
- 9.2.5. Neotame
- 9.1. Market Analysis, Insights and Forecast - by Application
- 10. Asia Pacific Artificial Sweeteners Analysis, Insights and Forecast, 2020-2032
- 10.1. Market Analysis, Insights and Forecast - by Application
- 10.1.1. Food and Beverages
- 10.1.2. Pharmaceuticals
- 10.1.3. Direct Sales
- 10.1.4. Others
- 10.2. Market Analysis, Insights and Forecast - by Type
- 10.2.1. Aspartame
- 10.2.2. Acesulfame k
- 10.2.3. Saccharin
- 10.2.4. Sucralose
- 10.2.5. Neotame
- 10.1. Market Analysis, Insights and Forecast - by Application
- 11. Competitive Analysis
- 11.1. Global Market Share Analysis 2025
- 11.2. Company Profiles
- 11.2.1 MacAndrews & Forbes Incorporated
- 11.2.1.1. Overview
- 11.2.1.2. Products
- 11.2.1.3. SWOT Analysis
- 11.2.1.4. Recent Developments
- 11.2.1.5. Financials (Based on Availability)
- 11.2.2 Tate & Lyle
- 11.2.2.1. Overview
- 11.2.2.2. Products
- 11.2.2.3. SWOT Analysis
- 11.2.2.4. Recent Developments
- 11.2.2.5. Financials (Based on Availability)
- 11.2.3 Niutang Chemical
- 11.2.3.1. Overview
- 11.2.3.2. Products
- 11.2.3.3. SWOT Analysis
- 11.2.3.4. Recent Developments
- 11.2.3.5. Financials (Based on Availability)
- 11.2.4 DuPont
- 11.2.4.1. Overview
- 11.2.4.2. Products
- 11.2.4.3. SWOT Analysis
- 11.2.4.4. Recent Developments
- 11.2.4.5. Financials (Based on Availability)
- 11.2.5 Cargill Incorporated
- 11.2.5.1. Overview
- 11.2.5.2. Products
- 11.2.5.3. SWOT Analysis
- 11.2.5.4. Recent Developments
- 11.2.5.5. Financials (Based on Availability)
- 11.2.6 Ajinomoto
- 11.2.6.1. Overview
- 11.2.6.2. Products
- 11.2.6.3. SWOT Analysis
- 11.2.6.4. Recent Developments
- 11.2.6.5. Financials (Based on Availability)
- 11.2.7 Archer Daniels Midland Company
- 11.2.7.1. Overview
- 11.2.7.2. Products
- 11.2.7.3. SWOT Analysis
- 11.2.7.4. Recent Developments
- 11.2.7.5. Financials (Based on Availability)
- 11.2.8 Symrise
- 11.2.8.1. Overview
- 11.2.8.2. Products
- 11.2.8.3. SWOT Analysis
- 11.2.8.4. Recent Developments
- 11.2.8.5. Financials (Based on Availability)
- 11.2.9 Nestle
- 11.2.9.1. Overview
- 11.2.9.2. Products
- 11.2.9.3. SWOT Analysis
- 11.2.9.4. Recent Developments
- 11.2.9.5. Financials (Based on Availability)
- 11.2.10 Associated British Foods
- 11.2.10.1. Overview
- 11.2.10.2. Products
- 11.2.10.3. SWOT Analysis
- 11.2.10.4. Recent Developments
- 11.2.10.5. Financials (Based on Availability)
- 11.2.11 Wilmar International
- 11.2.11.1. Overview
- 11.2.11.2. Products
- 11.2.11.3. SWOT Analysis
- 11.2.11.4. Recent Developments
- 11.2.11.5. Financials (Based on Availability)
- 11.2.12 Ingredion Incorporated
- 11.2.12.1. Overview
- 11.2.12.2. Products
- 11.2.12.3. SWOT Analysis
- 11.2.12.4. Recent Developments
- 11.2.12.5. Financials (Based on Availability)
- 11.2.13 Roquette Freres
- 11.2.13.1. Overview
- 11.2.13.2. Products
- 11.2.13.3. SWOT Analysis
- 11.2.13.4. Recent Developments
- 11.2.13.5. Financials (Based on Availability)
- 11.2.14 American Sugar Refining
- 11.2.14.1. Overview
- 11.2.14.2. Products
- 11.2.14.3. SWOT Analysis
- 11.2.14.4. Recent Developments
- 11.2.14.5. Financials (Based on Availability)
- 11.2.1 MacAndrews & Forbes Incorporated
List of Figures
- Figure 1: Global Artificial Sweeteners Revenue Breakdown (billion, %) by Region 2025 & 2033
- Figure 2: Global Artificial Sweeteners Volume Breakdown (K, %) by Region 2025 & 2033
- Figure 3: North America Artificial Sweeteners Revenue (billion), by Application 2025 & 2033
- Figure 4: North America Artificial Sweeteners Volume (K), by Application 2025 & 2033
- Figure 5: North America Artificial Sweeteners Revenue Share (%), by Application 2025 & 2033
- Figure 6: North America Artificial Sweeteners Volume Share (%), by Application 2025 & 2033
- Figure 7: North America Artificial Sweeteners Revenue (billion), by Type 2025 & 2033
- Figure 8: North America Artificial Sweeteners Volume (K), by Type 2025 & 2033
- Figure 9: North America Artificial Sweeteners Revenue Share (%), by Type 2025 & 2033
- Figure 10: North America Artificial Sweeteners Volume Share (%), by Type 2025 & 2033
- Figure 11: North America Artificial Sweeteners Revenue (billion), by Country 2025 & 2033
- Figure 12: North America Artificial Sweeteners Volume (K), by Country 2025 & 2033
- Figure 13: North America Artificial Sweeteners Revenue Share (%), by Country 2025 & 2033
- Figure 14: North America Artificial Sweeteners Volume Share (%), by Country 2025 & 2033
- Figure 15: South America Artificial Sweeteners Revenue (billion), by Application 2025 & 2033
- Figure 16: South America Artificial Sweeteners Volume (K), by Application 2025 & 2033
- Figure 17: South America Artificial Sweeteners Revenue Share (%), by Application 2025 & 2033
- Figure 18: South America Artificial Sweeteners Volume Share (%), by Application 2025 & 2033
- Figure 19: South America Artificial Sweeteners Revenue (billion), by Type 2025 & 2033
- Figure 20: South America Artificial Sweeteners Volume (K), by Type 2025 & 2033
- Figure 21: South America Artificial Sweeteners Revenue Share (%), by Type 2025 & 2033
- Figure 22: South America Artificial Sweeteners Volume Share (%), by Type 2025 & 2033
- Figure 23: South America Artificial Sweeteners Revenue (billion), by Country 2025 & 2033
- Figure 24: South America Artificial Sweeteners Volume (K), by Country 2025 & 2033
- Figure 25: South America Artificial Sweeteners Revenue Share (%), by Country 2025 & 2033
- Figure 26: South America Artificial Sweeteners Volume Share (%), by Country 2025 & 2033
- Figure 27: Europe Artificial Sweeteners Revenue (billion), by Application 2025 & 2033
- Figure 28: Europe Artificial Sweeteners Volume (K), by Application 2025 & 2033
- Figure 29: Europe Artificial Sweeteners Revenue Share (%), by Application 2025 & 2033
- Figure 30: Europe Artificial Sweeteners Volume Share (%), by Application 2025 & 2033
- Figure 31: Europe Artificial Sweeteners Revenue (billion), by Type 2025 & 2033
- Figure 32: Europe Artificial Sweeteners Volume (K), by Type 2025 & 2033
- Figure 33: Europe Artificial Sweeteners Revenue Share (%), by Type 2025 & 2033
- Figure 34: Europe Artificial Sweeteners Volume Share (%), by Type 2025 & 2033
- Figure 35: Europe Artificial Sweeteners Revenue (billion), by Country 2025 & 2033
- Figure 36: Europe Artificial Sweeteners Volume (K), by Country 2025 & 2033
- Figure 37: Europe Artificial Sweeteners Revenue Share (%), by Country 2025 & 2033
- Figure 38: Europe Artificial Sweeteners Volume Share (%), by Country 2025 & 2033
- Figure 39: Middle East & Africa Artificial Sweeteners Revenue (billion), by Application 2025 & 2033
- Figure 40: Middle East & Africa Artificial Sweeteners Volume (K), by Application 2025 & 2033
- Figure 41: Middle East & Africa Artificial Sweeteners Revenue Share (%), by Application 2025 & 2033
- Figure 42: Middle East & Africa Artificial Sweeteners Volume Share (%), by Application 2025 & 2033
- Figure 43: Middle East & Africa Artificial Sweeteners Revenue (billion), by Type 2025 & 2033
- Figure 44: Middle East & Africa Artificial Sweeteners Volume (K), by Type 2025 & 2033
- Figure 45: Middle East & Africa Artificial Sweeteners Revenue Share (%), by Type 2025 & 2033
- Figure 46: Middle East & Africa Artificial Sweeteners Volume Share (%), by Type 2025 & 2033
- Figure 47: Middle East & Africa Artificial Sweeteners Revenue (billion), by Country 2025 & 2033
- Figure 48: Middle East & Africa Artificial Sweeteners Volume (K), by Country 2025 & 2033
- Figure 49: Middle East & Africa Artificial Sweeteners Revenue Share (%), by Country 2025 & 2033
- Figure 50: Middle East & Africa Artificial Sweeteners Volume Share (%), by Country 2025 & 2033
- Figure 51: Asia Pacific Artificial Sweeteners Revenue (billion), by Application 2025 & 2033
- Figure 52: Asia Pacific Artificial Sweeteners Volume (K), by Application 2025 & 2033
- Figure 53: Asia Pacific Artificial Sweeteners Revenue Share (%), by Application 2025 & 2033
- Figure 54: Asia Pacific Artificial Sweeteners Volume Share (%), by Application 2025 & 2033
- Figure 55: Asia Pacific Artificial Sweeteners Revenue (billion), by Type 2025 & 2033
- Figure 56: Asia Pacific Artificial Sweeteners Volume (K), by Type 2025 & 2033
- Figure 57: Asia Pacific Artificial Sweeteners Revenue Share (%), by Type 2025 & 2033
- Figure 58: Asia Pacific Artificial Sweeteners Volume Share (%), by Type 2025 & 2033
- Figure 59: Asia Pacific Artificial Sweeteners Revenue (billion), by Country 2025 & 2033
- Figure 60: Asia Pacific Artificial Sweeteners Volume (K), by Country 2025 & 2033
- Figure 61: Asia Pacific Artificial Sweeteners Revenue Share (%), by Country 2025 & 2033
- Figure 62: Asia Pacific Artificial Sweeteners Volume Share (%), by Country 2025 & 2033
List of Tables
- Table 1: Global Artificial Sweeteners Revenue billion Forecast, by Application 2020 & 2033
- Table 2: Global Artificial Sweeteners Volume K Forecast, by Application 2020 & 2033
- Table 3: Global Artificial Sweeteners Revenue billion Forecast, by Type 2020 & 2033
- Table 4: Global Artificial Sweeteners Volume K Forecast, by Type 2020 & 2033
- Table 5: Global Artificial Sweeteners Revenue billion Forecast, by Region 2020 & 2033
- Table 6: Global Artificial Sweeteners Volume K Forecast, by Region 2020 & 2033
- Table 7: Global Artificial Sweeteners Revenue billion Forecast, by Application 2020 & 2033
- Table 8: Global Artificial Sweeteners Volume K Forecast, by Application 2020 & 2033
- Table 9: Global Artificial Sweeteners Revenue billion Forecast, by Type 2020 & 2033
- Table 10: Global Artificial Sweeteners Volume K Forecast, by Type 2020 & 2033
- Table 11: Global Artificial Sweeteners Revenue billion Forecast, by Country 2020 & 2033
- Table 12: Global Artificial Sweeteners Volume K Forecast, by Country 2020 & 2033
- Table 13: United States Artificial Sweeteners Revenue (billion) Forecast, by Application 2020 & 2033
- Table 14: United States Artificial Sweeteners Volume (K) Forecast, by Application 2020 & 2033
- Table 15: Canada Artificial Sweeteners Revenue (billion) Forecast, by Application 2020 & 2033
- Table 16: Canada Artificial Sweeteners Volume (K) Forecast, by Application 2020 & 2033
- Table 17: Mexico Artificial Sweeteners Revenue (billion) Forecast, by Application 2020 & 2033
- Table 18: Mexico Artificial Sweeteners Volume (K) Forecast, by Application 2020 & 2033
- Table 19: Global Artificial Sweeteners Revenue billion Forecast, by Application 2020 & 2033
- Table 20: Global Artificial Sweeteners Volume K Forecast, by Application 2020 & 2033
- Table 21: Global Artificial Sweeteners Revenue billion Forecast, by Type 2020 & 2033
- Table 22: Global Artificial Sweeteners Volume K Forecast, by Type 2020 & 2033
- Table 23: Global Artificial Sweeteners Revenue billion Forecast, by Country 2020 & 2033
- Table 24: Global Artificial Sweeteners Volume K Forecast, by Country 2020 & 2033
- Table 25: Brazil Artificial Sweeteners Revenue (billion) Forecast, by Application 2020 & 2033
- Table 26: Brazil Artificial Sweeteners Volume (K) Forecast, by Application 2020 & 2033
- Table 27: Argentina Artificial Sweeteners Revenue (billion) Forecast, by Application 2020 & 2033
- Table 28: Argentina Artificial Sweeteners Volume (K) Forecast, by Application 2020 & 2033
- Table 29: Rest of South America Artificial Sweeteners Revenue (billion) Forecast, by Application 2020 & 2033
- Table 30: Rest of South America Artificial Sweeteners Volume (K) Forecast, by Application 2020 & 2033
- Table 31: Global Artificial Sweeteners Revenue billion Forecast, by Application 2020 & 2033
- Table 32: Global Artificial Sweeteners Volume K Forecast, by Application 2020 & 2033
- Table 33: Global Artificial Sweeteners Revenue billion Forecast, by Type 2020 & 2033
- Table 34: Global Artificial Sweeteners Volume K Forecast, by Type 2020 & 2033
- Table 35: Global Artificial Sweeteners Revenue billion Forecast, by Country 2020 & 2033
- Table 36: Global Artificial Sweeteners Volume K Forecast, by Country 2020 & 2033
- Table 37: United Kingdom Artificial Sweeteners Revenue (billion) Forecast, by Application 2020 & 2033
- Table 38: United Kingdom Artificial Sweeteners Volume (K) Forecast, by Application 2020 & 2033
- Table 39: Germany Artificial Sweeteners Revenue (billion) Forecast, by Application 2020 & 2033
- Table 40: Germany Artificial Sweeteners Volume (K) Forecast, by Application 2020 & 2033
- Table 41: France Artificial Sweeteners Revenue (billion) Forecast, by Application 2020 & 2033
- Table 42: France Artificial Sweeteners Volume (K) Forecast, by Application 2020 & 2033
- Table 43: Italy Artificial Sweeteners Revenue (billion) Forecast, by Application 2020 & 2033
- Table 44: Italy Artificial Sweeteners Volume (K) Forecast, by Application 2020 & 2033
- Table 45: Spain Artificial Sweeteners Revenue (billion) Forecast, by Application 2020 & 2033
- Table 46: Spain Artificial Sweeteners Volume (K) Forecast, by Application 2020 & 2033
- Table 47: Russia Artificial Sweeteners Revenue (billion) Forecast, by Application 2020 & 2033
- Table 48: Russia Artificial Sweeteners Volume (K) Forecast, by Application 2020 & 2033
- Table 49: Benelux Artificial Sweeteners Revenue (billion) Forecast, by Application 2020 & 2033
- Table 50: Benelux Artificial Sweeteners Volume (K) Forecast, by Application 2020 & 2033
- Table 51: Nordics Artificial Sweeteners Revenue (billion) Forecast, by Application 2020 & 2033
- Table 52: Nordics Artificial Sweeteners Volume (K) Forecast, by Application 2020 & 2033
- Table 53: Rest of Europe Artificial Sweeteners Revenue (billion) Forecast, by Application 2020 & 2033
- Table 54: Rest of Europe Artificial Sweeteners Volume (K) Forecast, by Application 2020 & 2033
- Table 55: Global Artificial Sweeteners Revenue billion Forecast, by Application 2020 & 2033
- Table 56: Global Artificial Sweeteners Volume K Forecast, by Application 2020 & 2033
- Table 57: Global Artificial Sweeteners Revenue billion Forecast, by Type 2020 & 2033
- Table 58: Global Artificial Sweeteners Volume K Forecast, by Type 2020 & 2033
- Table 59: Global Artificial Sweeteners Revenue billion Forecast, by Country 2020 & 2033
- Table 60: Global Artificial Sweeteners Volume K Forecast, by Country 2020 & 2033
- Table 61: Turkey Artificial Sweeteners Revenue (billion) Forecast, by Application 2020 & 2033
- Table 62: Turkey Artificial Sweeteners Volume (K) Forecast, by Application 2020 & 2033
- Table 63: Israel Artificial Sweeteners Revenue (billion) Forecast, by Application 2020 & 2033
- Table 64: Israel Artificial Sweeteners Volume (K) Forecast, by Application 2020 & 2033
- Table 65: GCC Artificial Sweeteners Revenue (billion) Forecast, by Application 2020 & 2033
- Table 66: GCC Artificial Sweeteners Volume (K) Forecast, by Application 2020 & 2033
- Table 67: North Africa Artificial Sweeteners Revenue (billion) Forecast, by Application 2020 & 2033
- Table 68: North Africa Artificial Sweeteners Volume (K) Forecast, by Application 2020 & 2033
- Table 69: South Africa Artificial Sweeteners Revenue (billion) Forecast, by Application 2020 & 2033
- Table 70: South Africa Artificial Sweeteners Volume (K) Forecast, by Application 2020 & 2033
- Table 71: Rest of Middle East & Africa Artificial Sweeteners Revenue (billion) Forecast, by Application 2020 & 2033
- Table 72: Rest of Middle East & Africa Artificial Sweeteners Volume (K) Forecast, by Application 2020 & 2033
- Table 73: Global Artificial Sweeteners Revenue billion Forecast, by Application 2020 & 2033
- Table 74: Global Artificial Sweeteners Volume K Forecast, by Application 2020 & 2033
- Table 75: Global Artificial Sweeteners Revenue billion Forecast, by Type 2020 & 2033
- Table 76: Global Artificial Sweeteners Volume K Forecast, by Type 2020 & 2033
- Table 77: Global Artificial Sweeteners Revenue billion Forecast, by Country 2020 & 2033
- Table 78: Global Artificial Sweeteners Volume K Forecast, by Country 2020 & 2033
- Table 79: China Artificial Sweeteners Revenue (billion) Forecast, by Application 2020 & 2033
- Table 80: China Artificial Sweeteners Volume (K) Forecast, by Application 2020 & 2033
- Table 81: India Artificial Sweeteners Revenue (billion) Forecast, by Application 2020 & 2033
- Table 82: India Artificial Sweeteners Volume (K) Forecast, by Application 2020 & 2033
- Table 83: Japan Artificial Sweeteners Revenue (billion) Forecast, by Application 2020 & 2033
- Table 84: Japan Artificial Sweeteners Volume (K) Forecast, by Application 2020 & 2033
- Table 85: South Korea Artificial Sweeteners Revenue (billion) Forecast, by Application 2020 & 2033
- Table 86: South Korea Artificial Sweeteners Volume (K) Forecast, by Application 2020 & 2033
- Table 87: ASEAN Artificial Sweeteners Revenue (billion) Forecast, by Application 2020 & 2033
- Table 88: ASEAN Artificial Sweeteners Volume (K) Forecast, by Application 2020 & 2033
- Table 89: Oceania Artificial Sweeteners Revenue (billion) Forecast, by Application 2020 & 2033
- Table 90: Oceania Artificial Sweeteners Volume (K) Forecast, by Application 2020 & 2033
- Table 91: Rest of Asia Pacific Artificial Sweeteners Revenue (billion) Forecast, by Application 2020 & 2033
- Table 92: Rest of Asia Pacific Artificial Sweeteners Volume (K) Forecast, by Application 2020 & 2033
Frequently Asked Questions
1. What is the projected Compound Annual Growth Rate (CAGR) of the Artificial Sweeteners?
The projected CAGR is approximately 7.38%.
2. Which companies are prominent players in the Artificial Sweeteners?
Key companies in the market include MacAndrews & Forbes Incorporated, Tate & Lyle, Niutang Chemical, DuPont, Cargill Incorporated, Ajinomoto, Archer Daniels Midland Company, Symrise, Nestle, Associated British Foods, Wilmar International, Ingredion Incorporated, Roquette Freres, American Sugar Refining.
3. What are the main segments of the Artificial Sweeteners?
The market segments include Application, Type.
4. Can you provide details about the market size?
The market size is estimated to be USD 27.61 billion as of 2022.
5. What are some drivers contributing to market growth?
N/A
6. What are the notable trends driving market growth?
N/A
7. Are there any restraints impacting market growth?
N/A
8. Can you provide examples of recent developments in the market?
N/A
9. What pricing options are available for accessing the report?
Pricing options include single-user, multi-user, and enterprise licenses priced at USD 3950.00, USD 5925.00, and USD 7900.00 respectively.
10. Is the market size provided in terms of value or volume?
The market size is provided in terms of value, measured in billion and volume, measured in K.
11. Are there any specific market keywords associated with the report?
Yes, the market keyword associated with the report is "Artificial Sweeteners," which aids in identifying and referencing the specific market segment covered.
12. How do I determine which pricing option suits my needs best?
The pricing options vary based on user requirements and access needs. Individual users may opt for single-user licenses, while businesses requiring broader access may choose multi-user or enterprise licenses for cost-effective access to the report.
13. Are there any additional resources or data provided in the Artificial Sweeteners report?
While the report offers comprehensive insights, it's advisable to review the specific contents or supplementary materials provided to ascertain if additional resources or data are available.
14. How can I stay updated on further developments or reports in the Artificial Sweeteners?
To stay informed about further developments, trends, and reports in the Artificial Sweeteners, consider subscribing to industry newsletters, following relevant companies and organizations, or regularly checking reputable industry news sources and publications.
Methodology
Step 1 - Identification of Relevant Samples Size from Population Database


Step 2 - Approaches for Defining Global Market Size (Value, Volume* & Price*)

Note*: In applicable scenarios
Step 3 - Data Sources
Primary Research
- Web Analytics
- Survey Reports
- Research Institute
- Latest Research Reports
- Opinion Leaders
Secondary Research
- Annual Reports
- White Paper
- Latest Press Release
- Industry Association
- Paid Database
- Investor Presentations

Step 4 - Data Triangulation
Involves using different sources of information in order to increase the validity of a study
These sources are likely to be stakeholders in a program - participants, other researchers, program staff, other community members, and so on.
Then we put all data in single framework & apply various statistical tools to find out the dynamic on the market.
During the analysis stage, feedback from the stakeholder groups would be compared to determine areas of agreement as well as areas of divergence