

Key Insights
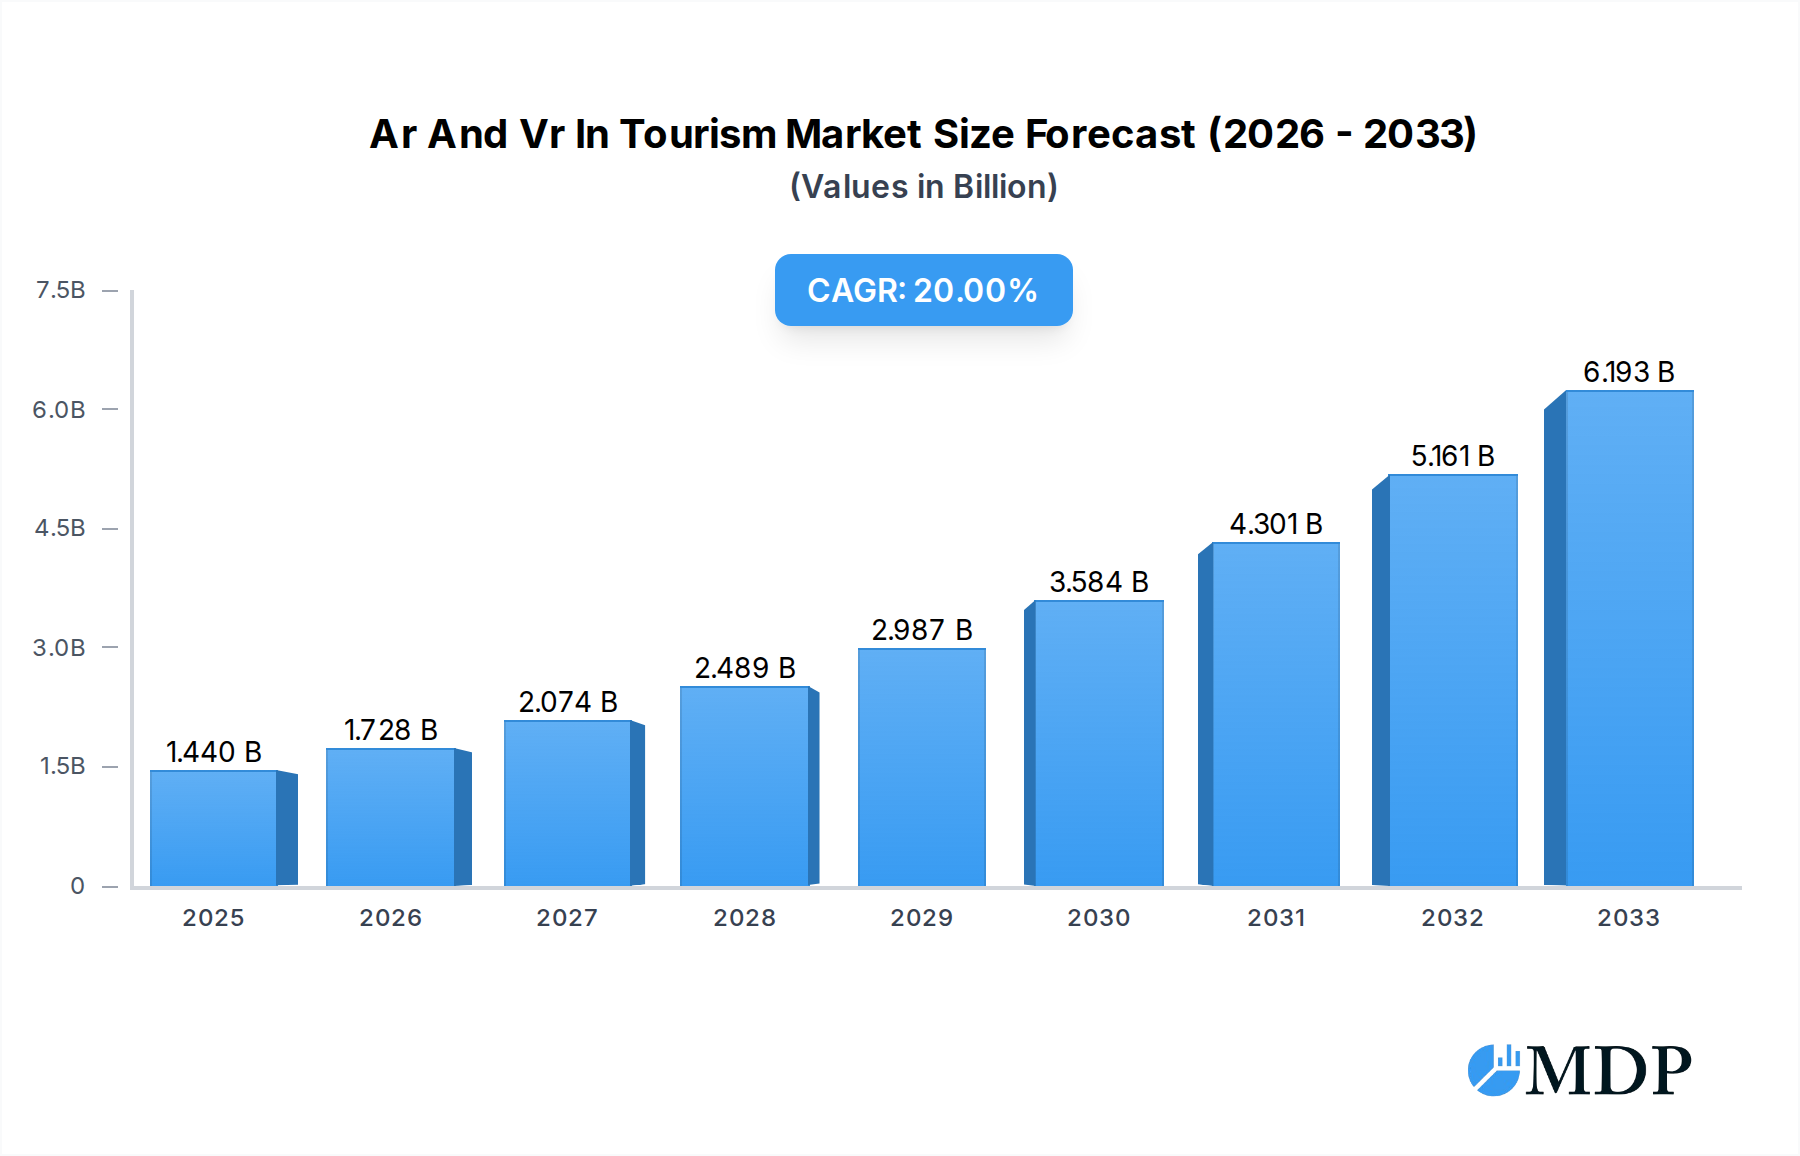
The Augmented Reality (AR) and Virtual Reality (VR) in Tourism market is poised for remarkable expansion, projected to reach an estimated $1.44 billion in 2025. This growth is fueled by a compelling CAGR of 20% during the forecast period of 2025-2033. The core drivers behind this surge include the increasing adoption of immersive technologies by travel and tourism providers to enhance customer experiences, offer virtual tours of destinations, and provide interactive pre-trip planning tools. AR overlays digital information onto the real world, enriching sightseeing with historical context, navigation aids, and localized recommendations. VR, on the other hand, allows potential travelers to virtually explore hotels, attractions, and entire cities before booking, significantly influencing decision-making. The application segments of 3D Modelling/Design and Training are expected to see substantial uptake as businesses invest in creating realistic virtual environments for destination marketing and staff development. The evolution of hardware, coupled with the growing comfort of consumers with immersive technologies, further solidifies this positive trajectory.

Ar And Vr In Tourism Market Size (In Billion)
The market's momentum is further propelled by a series of emerging trends, including the integration of AR/VR into personalized travel itineraries, the development of gamified tourism experiences, and the use of these technologies for remote exploration of heritage sites. While the market presents immense opportunities, certain restraints such as the initial high cost of VR hardware for consumers and the need for robust internet infrastructure in remote tourist locations could pose challenges. However, as technology becomes more accessible and integrated into mainstream platforms, these barriers are expected to diminish. Leading companies like HTC Corporation, Microsoft, Apple, and Google are actively investing in AR/VR development, creating a competitive landscape that fosters innovation. Geographically, North America and Europe are anticipated to lead the market in the near term due to early adoption rates and the presence of major technology players, while the Asia Pacific region is set to exhibit the fastest growth driven by increasing disposable incomes and a burgeoning tourism sector.
Ar And Vr In Tourism Company Market Share
Unleash the Future of Travel: AR and VR in Tourism Market Report 2019-2033
Unlock unparalleled insights into the booming Augmented Reality (AR) and Virtual Reality (VR) in Tourism market with this comprehensive, SEO-optimized report. Covering a critical study period from 2019 to 2033, with a base and estimated year of 2025 and a robust forecast period of 2025-2033, this report provides a billion-dollar view of market dynamics, trends, and strategic opportunities. Dive deep into the transformative potential of AR and VR across diverse tourism applications and segments, and gain a competitive edge in this rapidly evolving industry.
AR And VR In Tourism Market Dynamics & Concentration
The AR and VR in Tourism market is characterized by a moderate concentration with several key players driving innovation and adoption. Market share distribution indicates a significant presence of leading technology giants alongside specialized AR/VR solution providers. Innovation drivers are primarily fueled by advancements in hardware capabilities, such as higher resolution displays, wider fields of view, and more accurate spatial tracking, alongside sophisticated software development kits (SDKs) and content creation tools. Regulatory frameworks are still evolving, with a focus on data privacy and content standards, influencing the pace of adoption in certain regions. Product substitutes, while emerging in areas like advanced simulation and interactive digital content, are yet to fully replicate the immersive experiences offered by AR and VR. End-user trends show a growing demand for hyper-personalized travel experiences, interactive site explorations, and virtual tourism for accessibility and sustainability. Merger and Acquisition (M&A) activities have been instrumental in consolidating market share and fostering technological integration, with an estimated XX significant M&A deals recorded during the historical period.
AR And VR In Tourism Industry Trends & Analysis
The Augmented Reality (AR) and Virtual Reality (VR) in Tourism market is poised for exponential growth, driven by a confluence of technological advancements, shifting consumer preferences, and increasing industry investment. The estimated market size is projected to reach billions by the end of the forecast period, exhibiting a Compound Annual Growth Rate (CAGR) of approximately XX%. This robust growth is underpinned by significant market penetration across various tourism sub-sectors. Key market growth drivers include the escalating demand for immersive and interactive pre-travel planning experiences, where potential travelers can virtually explore destinations, hotels, and attractions before making booking decisions. Furthermore, VR is increasingly being utilized for virtual tours, offering access to remote or inaccessible locations and catering to individuals with mobility challenges, thereby expanding the reach of tourism.
Technological disruptions are at the forefront of this market expansion. The continuous improvement in AR/VR hardware, including lighter headsets, more affordable devices, and enhanced graphical rendering capabilities, is making these technologies more accessible to both businesses and consumers. The development of AI-powered personalized content generation further amplifies the appeal, allowing for tailored virtual experiences. Consumer preferences are aligning with these advancements, with a growing appetite for unique, engaging, and memorable travel experiences. Travelers are seeking novel ways to connect with destinations, and AR/VR offers precisely that, from augmented historical overlays at ancient sites to fully immersive virtual reality excursions into natural wonders.
Competitive dynamics within the AR/VR in Tourism sector are intensifying. Established technology companies are investing heavily in R&D, alongside agile startups specializing in AR/VR content creation and platform development. This competition is driving down costs and fostering innovation, making AR/VR solutions more viable for a wider range of tourism businesses, including hotels, tour operators, museums, and destination management organizations. The increasing adoption of AR for on-site enhancements, such as interactive navigation and real-time information overlays for tourists, is further accelerating market growth. The trend towards experiential tourism, where the journey and discovery are as important as the destination itself, is a powerful catalyst for AR and VR adoption. The seamless integration of these technologies with social media platforms for sharing virtual travel experiences also contributes to their viral adoption and market expansion. The increasing availability of 360-degree video content and photogrammetry techniques are also making it easier and more cost-effective to create high-quality virtual tourism experiences.
Leading Markets & Segments in AR And VR In Tourism
The Augmented Reality (VR) and Virtual Reality (AR) in Tourism market showcases distinct leadership across various geographical regions and application segments, reflecting diverse adoption rates and investment capacities. North America currently dominates the market, driven by a high concentration of technology-forward companies, significant disposable income for experiential travel, and robust investments in AR/VR research and development. The United States, in particular, is a major contributor due to its established tourism infrastructure and the presence of leading AR/VR technology developers.
Within the application segments, 3D Modelling/Design holds a significant share, primarily driven by the tourism industry's need for realistic pre-visualization of infrastructure projects, attraction designs, and hotel renovations. This segment allows for cost-effective planning and marketing by providing stakeholders with tangible virtual representations. The Monitoring/Maintenance segment, though nascent, is gaining traction, particularly in heritage site preservation and large-scale attraction management, where AR can assist with real-time structural analysis and operational efficiency.
The Training segment is another key area of dominance, with AR and VR proving invaluable for training tourism staff in customer service, safety protocols, and operational procedures in realistic, simulated environments. This leads to improved service quality and reduced training costs. The "Others" segment, encompassing areas like virtual tours, interactive storytelling, and augmented reality marketing campaigns, is experiencing rapid expansion due to its direct appeal to consumers and its effectiveness in driving bookings.
In terms of Type, the Solution segment, which includes hardware, software platforms, and integrated AR/VR systems, is leading the market. This is a foundational element enabling the widespread application of these technologies. The Services segment, encompassing content creation, custom application development, and consulting, is closely following, as businesses increasingly seek specialized expertise to leverage AR and VR effectively. Economic policies supporting technological innovation and infrastructure development, such as high-speed internet connectivity, are crucial enabling factors for this dominance. The increasing availability of affordable AR/VR devices and the growing comfort level of consumers with immersive technologies are also key drivers for the leading position of these segments.
AR And VR In Tourism Product Developments
Product innovations in AR and VR for tourism are rapidly transforming traveler engagement and operational efficiency. Companies are developing lightweight AR glasses offering real-time overlay of historical information on landmarks, interactive navigation guides, and personalized recommendation engines. VR platforms are enabling hyper-realistic virtual tours of hotels, destinations, and attractions, allowing potential visitors to experience the ambiance and offerings before physical arrival. These developments provide a significant competitive advantage by enhancing customer pre-purchase experience and post-visit engagement.
Key Drivers of AR And VR In Tourism Growth
The growth of AR and VR in tourism is propelled by several key factors. Technologically, continuous advancements in hardware (lighter headsets, better displays) and software (AI integration, enhanced graphics) are making immersive experiences more accessible and compelling. Economically, the increasing global tourism expenditure and the demand for unique, experiential travel are creating a fertile ground for AR/VR adoption. Regulatory support for technological innovation and digital transformation also plays a crucial role. Furthermore, the rising popularity of virtual travel for accessibility and sustainability purposes is a significant growth accelerator.
Challenges in the AR And VR In Tourism Market
Despite the promising growth, the AR and VR in Tourism market faces several challenges. High initial investment costs for hardware and content development can be a barrier for smaller tourism businesses. Regulatory hurdles related to data privacy and content moderation require careful navigation. Supply chain issues for advanced hardware components can impact availability and pricing. Furthermore, ensuring seamless user experience across diverse devices and overcoming user adoption inertia remain significant competitive pressures that need strategic addressing.
Emerging Opportunities in AR And VR In Tourism
Emerging opportunities in AR and VR for tourism are centered around fostering deeper engagement and expanding accessibility. Technological breakthroughs in haptic feedback and olfactory simulation can create even more immersive sensory experiences. Strategic partnerships between tech companies and tourism boards can lead to the co-creation of destination-specific AR/VR content, driving localized tourism. Market expansion into underserved demographics, such as the elderly or those with disabilities, through accessible virtual tourism solutions presents a significant untapped potential for long-term growth.
Leading Players in the Ar And VR In Tourism Sector
- HTC Corporation
- Microsoft
- Apple
- EON Reality
- Dell Technologies
- Barco
Key Milestones in Ar And VR In Tourism Industry
- 2019: Launch of advanced AR SDKs enabling richer mobile AR experiences for tourism apps.
- 2020: Increased adoption of VR for virtual tours during global travel restrictions, boosting market awareness.
- 2021: Introduction of more affordable and consumer-friendly VR headsets, expanding user base.
- 2022: Major hotel chains begin implementing AR-powered room previews and interactive guides.
- 2023: Emergence of AI-driven personalized AR content for enhanced destination discovery.
- 2024: Significant investment by tech giants in AR cloud infrastructure supporting widespread AR applications in public spaces.
Strategic Outlook for Ar And VR In Tourism Market
The strategic outlook for the AR and VR in Tourism market is exceptionally bright, driven by an ongoing convergence of technological sophistication and consumer demand for unparalleled travel experiences. Future growth will be accelerated by advancements in mixed reality, enabling seamless blending of digital and physical environments. The increasing focus on sustainable tourism will also see AR and VR play a pivotal role in virtual exploration, reducing the environmental impact of physical travel. Strategic opportunities lie in the development of integrated AR/VR platforms for end-to-end travel planning, booking, and on-site experiences, fostering a more connected and immersive journey for every traveler.
Ar And Vr In Tourism Segmentation
-
1. Application
- 1.1. 3D Modelling/Design
- 1.2. Monitoring/Maintenance
- 1.3. Training
- 1.4. Others
-
2. Type
- 2.1. Solution
- 2.2. Services
Ar And Vr In Tourism Segmentation By Geography
-
1. North America
- 1.1. United States
- 1.2. Canada
- 1.3. Mexico
-
2. South America
- 2.1. Brazil
- 2.2. Argentina
- 2.3. Rest of South America
-
3. Europe
- 3.1. United Kingdom
- 3.2. Germany
- 3.3. France
- 3.4. Italy
- 3.5. Spain
- 3.6. Russia
- 3.7. Benelux
- 3.8. Nordics
- 3.9. Rest of Europe
-
4. Middle East & Africa
- 4.1. Turkey
- 4.2. Israel
- 4.3. GCC
- 4.4. North Africa
- 4.5. South Africa
- 4.6. Rest of Middle East & Africa
-
5. Asia Pacific
- 5.1. China
- 5.2. India
- 5.3. Japan
- 5.4. South Korea
- 5.5. ASEAN
- 5.6. Oceania
- 5.7. Rest of Asia Pacific
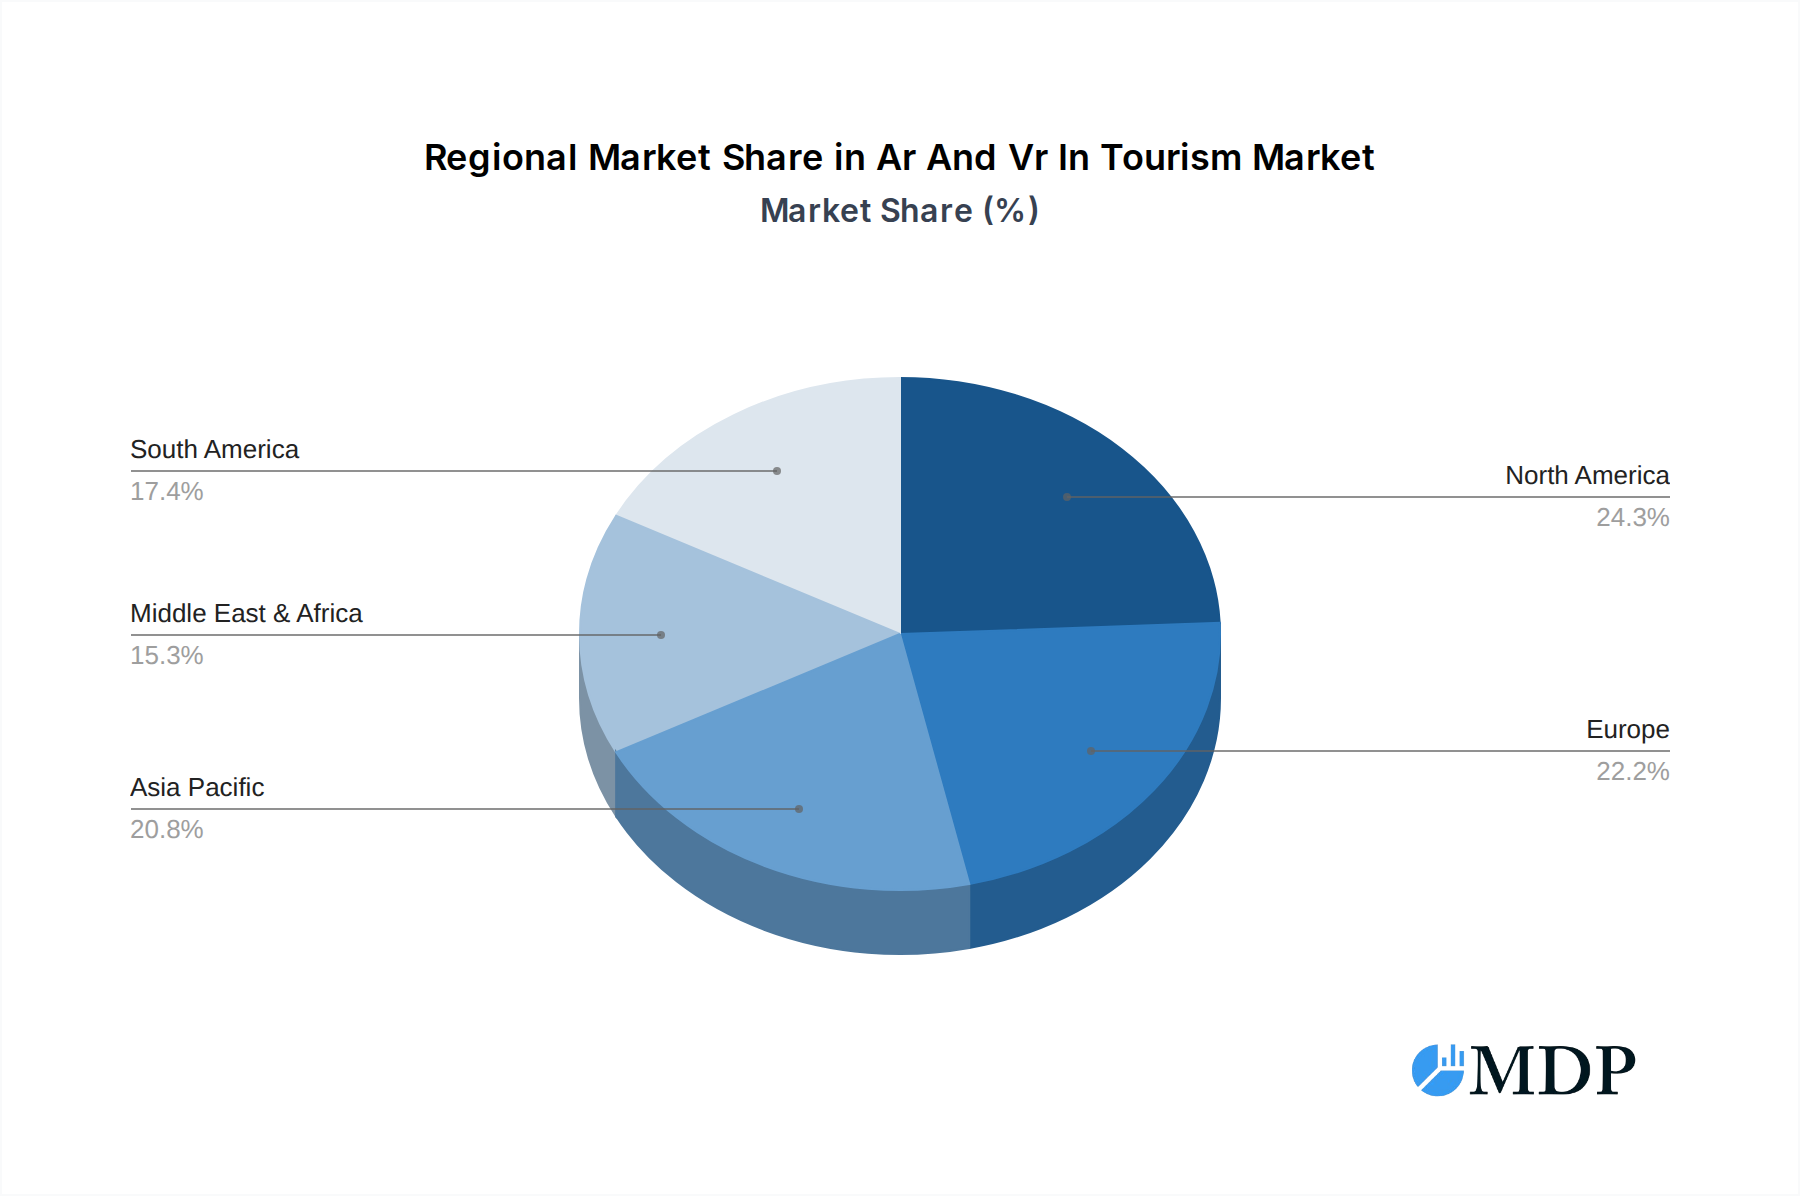
Ar And Vr In Tourism Regional Market Share
Geographic Coverage of Ar And Vr In Tourism
Ar And Vr In Tourism REPORT HIGHLIGHTS
| Aspects | Details |
|---|---|
| Study Period | 2020-2034 |
| Base Year | 2025 |
| Estimated Year | 2026 |
| Forecast Period | 2026-2034 |
| Historical Period | 2020-2025 |
| Growth Rate | CAGR of 20% from 2020-2034 |
| Segmentation |
|
Table of Contents
- 1. Introduction
- 1.1. Research Scope
- 1.2. Market Segmentation
- 1.3. Research Methodology
- 1.4. Definitions and Assumptions
- 2. Executive Summary
- 2.1. Introduction
- 3. Market Dynamics
- 3.1. Introduction
- 3.2. Market Drivers
- 3.3. Market Restrains
- 3.4. Market Trends
- 4. Market Factor Analysis
- 4.1. Porters Five Forces
- 4.2. Supply/Value Chain
- 4.3. PESTEL analysis
- 4.4. Market Entropy
- 4.5. Patent/Trademark Analysis
- 5. Global Ar And Vr In Tourism Analysis, Insights and Forecast, 2020-2032
- 5.1. Market Analysis, Insights and Forecast - by Application
- 5.1.1. 3D Modelling/Design
- 5.1.2. Monitoring/Maintenance
- 5.1.3. Training
- 5.1.4. Others
- 5.2. Market Analysis, Insights and Forecast - by Type
- 5.2.1. Solution
- 5.2.2. Services
- 5.3. Market Analysis, Insights and Forecast - by Region
- 5.3.1. North America
- 5.3.2. South America
- 5.3.3. Europe
- 5.3.4. Middle East & Africa
- 5.3.5. Asia Pacific
- 5.1. Market Analysis, Insights and Forecast - by Application
- 6. North America Ar And Vr In Tourism Analysis, Insights and Forecast, 2020-2032
- 6.1. Market Analysis, Insights and Forecast - by Application
- 6.1.1. 3D Modelling/Design
- 6.1.2. Monitoring/Maintenance
- 6.1.3. Training
- 6.1.4. Others
- 6.2. Market Analysis, Insights and Forecast - by Type
- 6.2.1. Solution
- 6.2.2. Services
- 6.1. Market Analysis, Insights and Forecast - by Application
- 7. South America Ar And Vr In Tourism Analysis, Insights and Forecast, 2020-2032
- 7.1. Market Analysis, Insights and Forecast - by Application
- 7.1.1. 3D Modelling/Design
- 7.1.2. Monitoring/Maintenance
- 7.1.3. Training
- 7.1.4. Others
- 7.2. Market Analysis, Insights and Forecast - by Type
- 7.2.1. Solution
- 7.2.2. Services
- 7.1. Market Analysis, Insights and Forecast - by Application
- 8. Europe Ar And Vr In Tourism Analysis, Insights and Forecast, 2020-2032
- 8.1. Market Analysis, Insights and Forecast - by Application
- 8.1.1. 3D Modelling/Design
- 8.1.2. Monitoring/Maintenance
- 8.1.3. Training
- 8.1.4. Others
- 8.2. Market Analysis, Insights and Forecast - by Type
- 8.2.1. Solution
- 8.2.2. Services
- 8.1. Market Analysis, Insights and Forecast - by Application
- 9. Middle East & Africa Ar And Vr In Tourism Analysis, Insights and Forecast, 2020-2032
- 9.1. Market Analysis, Insights and Forecast - by Application
- 9.1.1. 3D Modelling/Design
- 9.1.2. Monitoring/Maintenance
- 9.1.3. Training
- 9.1.4. Others
- 9.2. Market Analysis, Insights and Forecast - by Type
- 9.2.1. Solution
- 9.2.2. Services
- 9.1. Market Analysis, Insights and Forecast - by Application
- 10. Asia Pacific Ar And Vr In Tourism Analysis, Insights and Forecast, 2020-2032
- 10.1. Market Analysis, Insights and Forecast - by Application
- 10.1.1. 3D Modelling/Design
- 10.1.2. Monitoring/Maintenance
- 10.1.3. Training
- 10.1.4. Others
- 10.2. Market Analysis, Insights and Forecast - by Type
- 10.2.1. Solution
- 10.2.2. Services
- 10.1. Market Analysis, Insights and Forecast - by Application
- 11. Competitive Analysis
- 11.1. Global Market Share Analysis 2025
- 11.2. Company Profiles
- 11.2.1 HTC Corporation
- 11.2.1.1. Overview
- 11.2.1.2. Products
- 11.2.1.3. SWOT Analysis
- 11.2.1.4. Recent Developments
- 11.2.1.5. Financials (Based on Availability)
- 11.2.2 Microsoft
- 11.2.2.1. Overview
- 11.2.2.2. Products
- 11.2.2.3. SWOT Analysis
- 11.2.2.4. Recent Developments
- 11.2.2.5. Financials (Based on Availability)
- 11.2.3 Apple
- 11.2.3.1. Overview
- 11.2.3.2. Products
- 11.2.3.3. SWOT Analysis
- 11.2.3.4. Recent Developments
- 11.2.3.5. Financials (Based on Availability)
- 11.2.4 Google
- 11.2.4.1. Overview
- 11.2.4.2. Products
- 11.2.4.3. SWOT Analysis
- 11.2.4.4. Recent Developments
- 11.2.4.5. Financials (Based on Availability)
- 11.2.5 EON Reality
- 11.2.5.1. Overview
- 11.2.5.2. Products
- 11.2.5.3. SWOT Analysis
- 11.2.5.4. Recent Developments
- 11.2.5.5. Financials (Based on Availability)
- 11.2.6 Dell Technologies
- 11.2.6.1. Overview
- 11.2.6.2. Products
- 11.2.6.3. SWOT Analysis
- 11.2.6.4. Recent Developments
- 11.2.6.5. Financials (Based on Availability)
- 11.2.7 Barco
- 11.2.7.1. Overview
- 11.2.7.2. Products
- 11.2.7.3. SWOT Analysis
- 11.2.7.4. Recent Developments
- 11.2.7.5. Financials (Based on Availability)
- 11.2.1 HTC Corporation
List of Figures
- Figure 1: Global Ar And Vr In Tourism Revenue Breakdown (undefined, %) by Region 2025 & 2033
- Figure 2: North America Ar And Vr In Tourism Revenue (undefined), by Application 2025 & 2033
- Figure 3: North America Ar And Vr In Tourism Revenue Share (%), by Application 2025 & 2033
- Figure 4: North America Ar And Vr In Tourism Revenue (undefined), by Type 2025 & 2033
- Figure 5: North America Ar And Vr In Tourism Revenue Share (%), by Type 2025 & 2033
- Figure 6: North America Ar And Vr In Tourism Revenue (undefined), by Country 2025 & 2033
- Figure 7: North America Ar And Vr In Tourism Revenue Share (%), by Country 2025 & 2033
- Figure 8: South America Ar And Vr In Tourism Revenue (undefined), by Application 2025 & 2033
- Figure 9: South America Ar And Vr In Tourism Revenue Share (%), by Application 2025 & 2033
- Figure 10: South America Ar And Vr In Tourism Revenue (undefined), by Type 2025 & 2033
- Figure 11: South America Ar And Vr In Tourism Revenue Share (%), by Type 2025 & 2033
- Figure 12: South America Ar And Vr In Tourism Revenue (undefined), by Country 2025 & 2033
- Figure 13: South America Ar And Vr In Tourism Revenue Share (%), by Country 2025 & 2033
- Figure 14: Europe Ar And Vr In Tourism Revenue (undefined), by Application 2025 & 2033
- Figure 15: Europe Ar And Vr In Tourism Revenue Share (%), by Application 2025 & 2033
- Figure 16: Europe Ar And Vr In Tourism Revenue (undefined), by Type 2025 & 2033
- Figure 17: Europe Ar And Vr In Tourism Revenue Share (%), by Type 2025 & 2033
- Figure 18: Europe Ar And Vr In Tourism Revenue (undefined), by Country 2025 & 2033
- Figure 19: Europe Ar And Vr In Tourism Revenue Share (%), by Country 2025 & 2033
- Figure 20: Middle East & Africa Ar And Vr In Tourism Revenue (undefined), by Application 2025 & 2033
- Figure 21: Middle East & Africa Ar And Vr In Tourism Revenue Share (%), by Application 2025 & 2033
- Figure 22: Middle East & Africa Ar And Vr In Tourism Revenue (undefined), by Type 2025 & 2033
- Figure 23: Middle East & Africa Ar And Vr In Tourism Revenue Share (%), by Type 2025 & 2033
- Figure 24: Middle East & Africa Ar And Vr In Tourism Revenue (undefined), by Country 2025 & 2033
- Figure 25: Middle East & Africa Ar And Vr In Tourism Revenue Share (%), by Country 2025 & 2033
- Figure 26: Asia Pacific Ar And Vr In Tourism Revenue (undefined), by Application 2025 & 2033
- Figure 27: Asia Pacific Ar And Vr In Tourism Revenue Share (%), by Application 2025 & 2033
- Figure 28: Asia Pacific Ar And Vr In Tourism Revenue (undefined), by Type 2025 & 2033
- Figure 29: Asia Pacific Ar And Vr In Tourism Revenue Share (%), by Type 2025 & 2033
- Figure 30: Asia Pacific Ar And Vr In Tourism Revenue (undefined), by Country 2025 & 2033
- Figure 31: Asia Pacific Ar And Vr In Tourism Revenue Share (%), by Country 2025 & 2033
List of Tables
- Table 1: Global Ar And Vr In Tourism Revenue undefined Forecast, by Application 2020 & 2033
- Table 2: Global Ar And Vr In Tourism Revenue undefined Forecast, by Type 2020 & 2033
- Table 3: Global Ar And Vr In Tourism Revenue undefined Forecast, by Region 2020 & 2033
- Table 4: Global Ar And Vr In Tourism Revenue undefined Forecast, by Application 2020 & 2033
- Table 5: Global Ar And Vr In Tourism Revenue undefined Forecast, by Type 2020 & 2033
- Table 6: Global Ar And Vr In Tourism Revenue undefined Forecast, by Country 2020 & 2033
- Table 7: United States Ar And Vr In Tourism Revenue (undefined) Forecast, by Application 2020 & 2033
- Table 8: Canada Ar And Vr In Tourism Revenue (undefined) Forecast, by Application 2020 & 2033
- Table 9: Mexico Ar And Vr In Tourism Revenue (undefined) Forecast, by Application 2020 & 2033
- Table 10: Global Ar And Vr In Tourism Revenue undefined Forecast, by Application 2020 & 2033
- Table 11: Global Ar And Vr In Tourism Revenue undefined Forecast, by Type 2020 & 2033
- Table 12: Global Ar And Vr In Tourism Revenue undefined Forecast, by Country 2020 & 2033
- Table 13: Brazil Ar And Vr In Tourism Revenue (undefined) Forecast, by Application 2020 & 2033
- Table 14: Argentina Ar And Vr In Tourism Revenue (undefined) Forecast, by Application 2020 & 2033
- Table 15: Rest of South America Ar And Vr In Tourism Revenue (undefined) Forecast, by Application 2020 & 2033
- Table 16: Global Ar And Vr In Tourism Revenue undefined Forecast, by Application 2020 & 2033
- Table 17: Global Ar And Vr In Tourism Revenue undefined Forecast, by Type 2020 & 2033
- Table 18: Global Ar And Vr In Tourism Revenue undefined Forecast, by Country 2020 & 2033
- Table 19: United Kingdom Ar And Vr In Tourism Revenue (undefined) Forecast, by Application 2020 & 2033
- Table 20: Germany Ar And Vr In Tourism Revenue (undefined) Forecast, by Application 2020 & 2033
- Table 21: France Ar And Vr In Tourism Revenue (undefined) Forecast, by Application 2020 & 2033
- Table 22: Italy Ar And Vr In Tourism Revenue (undefined) Forecast, by Application 2020 & 2033
- Table 23: Spain Ar And Vr In Tourism Revenue (undefined) Forecast, by Application 2020 & 2033
- Table 24: Russia Ar And Vr In Tourism Revenue (undefined) Forecast, by Application 2020 & 2033
- Table 25: Benelux Ar And Vr In Tourism Revenue (undefined) Forecast, by Application 2020 & 2033
- Table 26: Nordics Ar And Vr In Tourism Revenue (undefined) Forecast, by Application 2020 & 2033
- Table 27: Rest of Europe Ar And Vr In Tourism Revenue (undefined) Forecast, by Application 2020 & 2033
- Table 28: Global Ar And Vr In Tourism Revenue undefined Forecast, by Application 2020 & 2033
- Table 29: Global Ar And Vr In Tourism Revenue undefined Forecast, by Type 2020 & 2033
- Table 30: Global Ar And Vr In Tourism Revenue undefined Forecast, by Country 2020 & 2033
- Table 31: Turkey Ar And Vr In Tourism Revenue (undefined) Forecast, by Application 2020 & 2033
- Table 32: Israel Ar And Vr In Tourism Revenue (undefined) Forecast, by Application 2020 & 2033
- Table 33: GCC Ar And Vr In Tourism Revenue (undefined) Forecast, by Application 2020 & 2033
- Table 34: North Africa Ar And Vr In Tourism Revenue (undefined) Forecast, by Application 2020 & 2033
- Table 35: South Africa Ar And Vr In Tourism Revenue (undefined) Forecast, by Application 2020 & 2033
- Table 36: Rest of Middle East & Africa Ar And Vr In Tourism Revenue (undefined) Forecast, by Application 2020 & 2033
- Table 37: Global Ar And Vr In Tourism Revenue undefined Forecast, by Application 2020 & 2033
- Table 38: Global Ar And Vr In Tourism Revenue undefined Forecast, by Type 2020 & 2033
- Table 39: Global Ar And Vr In Tourism Revenue undefined Forecast, by Country 2020 & 2033
- Table 40: China Ar And Vr In Tourism Revenue (undefined) Forecast, by Application 2020 & 2033
- Table 41: India Ar And Vr In Tourism Revenue (undefined) Forecast, by Application 2020 & 2033
- Table 42: Japan Ar And Vr In Tourism Revenue (undefined) Forecast, by Application 2020 & 2033
- Table 43: South Korea Ar And Vr In Tourism Revenue (undefined) Forecast, by Application 2020 & 2033
- Table 44: ASEAN Ar And Vr In Tourism Revenue (undefined) Forecast, by Application 2020 & 2033
- Table 45: Oceania Ar And Vr In Tourism Revenue (undefined) Forecast, by Application 2020 & 2033
- Table 46: Rest of Asia Pacific Ar And Vr In Tourism Revenue (undefined) Forecast, by Application 2020 & 2033
Frequently Asked Questions
1. What is the projected Compound Annual Growth Rate (CAGR) of the Ar And Vr In Tourism?
The projected CAGR is approximately 20%.
2. Which companies are prominent players in the Ar And Vr In Tourism?
Key companies in the market include HTC Corporation, Microsoft, Apple, Google, EON Reality, Dell Technologies, Barco.
3. What are the main segments of the Ar And Vr In Tourism?
The market segments include Application, Type.
4. Can you provide details about the market size?
The market size is estimated to be USD XXX N/A as of 2022.
5. What are some drivers contributing to market growth?
N/A
6. What are the notable trends driving market growth?
N/A
7. Are there any restraints impacting market growth?
N/A
8. Can you provide examples of recent developments in the market?
N/A
9. What pricing options are available for accessing the report?
Pricing options include single-user, multi-user, and enterprise licenses priced at USD 4250.00, USD 6375.00, and USD 8500.00 respectively.
10. Is the market size provided in terms of value or volume?
The market size is provided in terms of value, measured in N/A.
11. Are there any specific market keywords associated with the report?
Yes, the market keyword associated with the report is "Ar And Vr In Tourism," which aids in identifying and referencing the specific market segment covered.
12. How do I determine which pricing option suits my needs best?
The pricing options vary based on user requirements and access needs. Individual users may opt for single-user licenses, while businesses requiring broader access may choose multi-user or enterprise licenses for cost-effective access to the report.
13. Are there any additional resources or data provided in the Ar And Vr In Tourism report?
While the report offers comprehensive insights, it's advisable to review the specific contents or supplementary materials provided to ascertain if additional resources or data are available.
14. How can I stay updated on further developments or reports in the Ar And Vr In Tourism?
To stay informed about further developments, trends, and reports in the Ar And Vr In Tourism, consider subscribing to industry newsletters, following relevant companies and organizations, or regularly checking reputable industry news sources and publications.
Methodology
Step 1 - Identification of Relevant Samples Size from Population Database


Step 2 - Approaches for Defining Global Market Size (Value, Volume* & Price*)

Note*: In applicable scenarios
Step 3 - Data Sources
Primary Research
- Web Analytics
- Survey Reports
- Research Institute
- Latest Research Reports
- Opinion Leaders
Secondary Research
- Annual Reports
- White Paper
- Latest Press Release
- Industry Association
- Paid Database
- Investor Presentations

Step 4 - Data Triangulation
Involves using different sources of information in order to increase the validity of a study
These sources are likely to be stakeholders in a program - participants, other researchers, program staff, other community members, and so on.
Then we put all data in single framework & apply various statistical tools to find out the dynamic on the market.
During the analysis stage, feedback from the stakeholder groups would be compared to determine areas of agreement as well as areas of divergence