

Key Insights
The global aquaponics market, valued at $1.21 billion in 2025, is experiencing robust growth, projected to expand at a Compound Annual Growth Rate (CAGR) of 9.60% from 2025 to 2033. This expansion is driven by several key factors. Increasing consumer demand for sustainably produced food, coupled with growing awareness of the environmental benefits of aquaponics—reduced water usage and minimized reliance on chemical fertilizers—are significant drivers. Technological advancements in aquaponics systems, particularly in areas like automated monitoring and control, are also fueling market growth. Furthermore, the rising popularity of vertical farming and indoor agriculture, especially in urban environments, is creating new opportunities for aquaponic systems, which are particularly well-suited for these spaces. The increasing adoption of aquaponics by both large-scale commercial operations and smaller-scale home growers contributes to this upward trajectory. The market is segmented by various factors, including the type of ebb and flow systems (e.g., Nutrient Film Technique), facility type (e.g., greenhouses, vertical farms), fish species (e.g., tilapia, catfish), and growing systems. The diverse applications of aquaponics, spanning food production, education, and even aquaculture itself, further contribute to the market’s dynamism.
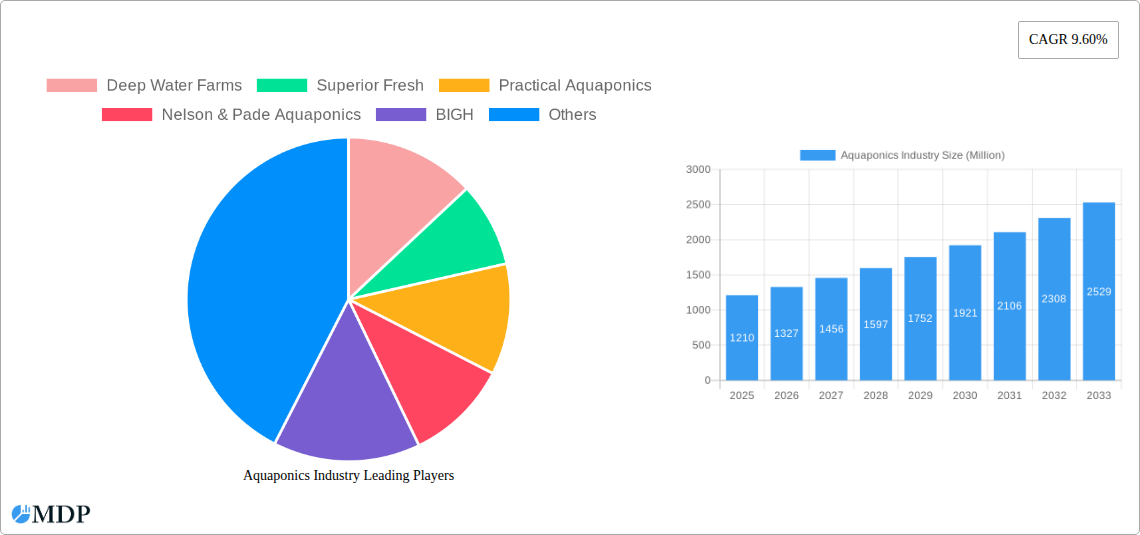
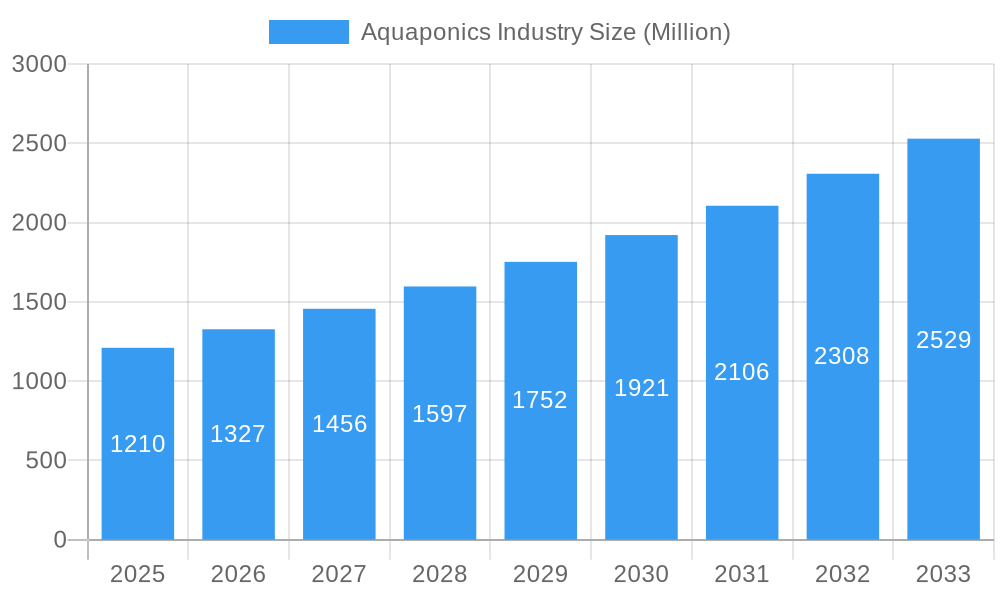
Aquaponics Industry Market Size (In Billion)
The geographical distribution of the market reveals significant regional variations. North America, currently holding a large market share, is expected to maintain strong growth, driven by high consumer awareness and technological advancements. The Asia-Pacific region is anticipated to witness considerable expansion due to rising populations, increasing urbanization, and growing demand for food security. Europe, while having a mature market, is likely to see steady growth, fueled by sustainability initiatives and a focus on environmentally friendly food production. The growth in other regions like South America and Africa will likely be more gradual, driven by factors such as infrastructure development and increasing adoption of sustainable agricultural practices. However, challenges remain, including the high initial investment costs associated with setting up aquaponic systems, and the need for skilled labor and technical expertise, potentially hindering broader adoption, especially in developing regions. Nevertheless, the overall outlook for the aquaponics market remains highly positive, promising continued expansion over the forecast period.
Aquaponics Industry Company Market Share
Aquaponics Industry Market Report: 2019-2033
This comprehensive report provides a detailed analysis of the Aquaponics industry, projecting a market valued at $XX Million by 2033. Leveraging data from the historical period (2019-2024), base year (2025), and forecast period (2025-2033), this report offers invaluable insights for industry stakeholders, investors, and entrepreneurs. Discover key trends, leading players, and emerging opportunities within this rapidly growing sector.
Aquaponics Industry Market Dynamics & Concentration
The global aquaponics market, estimated at $XX Million in 2025, is experiencing robust growth driven by increasing consumer demand for sustainably produced food, technological advancements in system design, and supportive government initiatives. Market concentration is currently moderate, with several key players holding significant shares. However, the market is characterized by a dynamic competitive landscape, marked by both organic growth and mergers & acquisitions (M&A) activity.
- Market Share: Deep Water Farms and Superior Fresh are estimated to hold a combined XX% market share in 2025, while smaller players like Practical Aquaponics and Nelson & Pade Aquaponics together account for another XX%. The remaining market share is distributed among numerous smaller regional players.
- M&A Activity: The number of M&A deals in the aquaponics sector increased significantly between 2019 and 2024, averaging XX deals per year. This trend is expected to continue as larger companies seek to expand their market reach and consolidate the industry.
- Innovation Drivers: Technological advancements in water purification, automated systems, and disease control are driving innovation and efficiency within the sector.
- Regulatory Frameworks: Government regulations regarding water usage, waste management, and food safety standards have a significant impact on the industry’s development.
- Product Substitutes: Traditional agriculture and hydroponics present competition to aquaponics; however, the unique advantages of aquaponics in sustainability and resource efficiency are creating a niche market.
- End-User Trends: The growing consumer preference for eco-friendly, locally sourced food is a primary driver of market growth.
Aquaponics Industry Industry Trends & Analysis
The aquaponics market is poised for significant expansion, with a projected Compound Annual Growth Rate (CAGR) of XX% during the forecast period (2025-2033). Several key factors contribute to this growth:
- Market Growth Drivers: The rising global population, increasing urbanization, and growing awareness of sustainable food production practices are major drivers. Moreover, advancements in vertical farming and indoor aquaponics systems are expanding market potential.
- Technological Disruptions: The integration of IoT sensors, AI-powered monitoring systems, and automation technologies are streamlining operations and improving efficiency.
- Consumer Preferences: Consumers are increasingly seeking healthier, more sustainably produced food, which is fueling demand for aquaponic produce.
- Competitive Dynamics: The market is becoming increasingly competitive, with both established players and new entrants vying for market share. Innovation and differentiation are key to success. Market penetration of aquaponics products is projected to reach XX% by 2033, up from XX% in 2025.
Leading Markets & Segments in Aquaponics Industry
The North American market currently dominates the global aquaponics landscape, driven by high consumer demand and strong government support. Within this market, specific segments are experiencing particularly strong growth:
Dominant Segments:
- Ebb and Flow (Flood and Drain): This segment holds a significant market share due to its relative simplicity and cost-effectiveness.
- Facility Type: Poly greenhouses are currently the most prevalent facility type due to their lower cost compared to glass greenhouses and indoor vertical farms. However, indoor vertical farms are witnessing rapid growth due to their potential for increased productivity and reduced environmental impact.
- Fish Type: Tilapia remains the most popular fish species due to its fast growth rate and adaptability to aquaponic systems.
- Growing System: Media-filled beds are widely used due to their ability to support a diverse range of plants and provide optimal growing conditions.
Key Drivers:
- Economic Policies: Government incentives and subsidies for sustainable agriculture are boosting market growth.
- Infrastructure: Improved infrastructure and access to technology are supporting the development of larger-scale aquaponic operations.
Aquaponics Industry Product Developments
Recent product innovations include automated water management systems, advanced sensor technologies for real-time monitoring, and improved nutrient delivery systems. These advancements are enhancing efficiency, productivity, and sustainability within aquaponic operations. The focus is shifting towards modular, scalable systems that can be easily adapted to various environments and production needs, improving market fit and competitive advantages.
Key Drivers of Aquaponics Industry Growth
The aquaponics industry's growth is propelled by several key factors: technological advancements leading to increased efficiency and yield; supportive government policies promoting sustainable agriculture; and rising consumer demand for sustainably produced, healthy food. The increasing adoption of vertical farming techniques and the development of more resilient and disease-resistant fish and plant varieties further contribute to this growth trajectory.
Challenges in the Aquaponics Industry Market
Significant challenges exist, including high initial investment costs for setting up aquaponic systems. Regulatory hurdles regarding water usage and waste disposal vary across regions, potentially impacting operational costs and scalability. Supply chain disruptions can also affect the availability of essential components and inputs. Furthermore, competition from established agricultural practices and emerging technologies necessitates continuous innovation and adaptation. These factors combined are estimated to reduce the market’s projected growth by approximately XX% by 2033.
Emerging Opportunities in Aquaponics Industry
The integration of advanced technologies like AI and machine learning into aquaponic systems promises to optimize resource management and enhance yield. Strategic partnerships between technology providers, growers, and food retailers are creating innovative distribution channels and strengthening market penetration. Expansion into new geographic markets and diversification of product offerings represent significant opportunities for long-term growth.
Leading Players in the Aquaponics Industry Sector
- Deep Water Farms
- Superior Fresh
- Practical Aquaponics
- Nelson & Pade Aquaponics
- BIGH
- ECF Farm Berli
- Garden City Aquaponics Inc
- Aquaponics USA
- Madhavi Farms
- Ouroboros Farms
- Pentair Aquatic Eco-System Inc (PAES)
Key Milestones in Aquaponics Industry Industry
- 2020: Introduction of a new automated water filtration system by Deep Water Farms.
- 2022: Superior Fresh launched a line of organic, aquaponically grown produce.
- 2023: Merger between two smaller aquaponics companies resulting in increased market share.
- 2024: Government funding initiatives supporting research and development in aquaponics technology.
Strategic Outlook for Aquaponics Industry Market
The aquaponics market holds substantial potential for growth, driven by the increasing global demand for sustainable food sources. The convergence of technological advancements and evolving consumer preferences creates a favorable environment for long-term expansion. Strategic partnerships, investments in research and development, and adoption of innovative business models will be crucial for capturing significant market share in the years to come. The market is expected to experience robust growth through strategic diversification, technological adoption, and sustainable practices.
Aquaponics Industry Segmentation
- 1. Production Analysis
- 2. Consumption Analysis
- 3. Import Market Analysis (Value & Volume)
- 4. Export Market Analysis (Value & Volume)
- 5. Price Trend Analysis
Aquaponics Industry Segmentation By Geography
-
1. North America
- 1.1. United States
- 1.2. Canada
- 1.3. Mexico
-
2. South America
- 2.1. Brazil
- 2.2. Argentina
- 2.3. Rest of South America
-
3. Europe
- 3.1. United Kingdom
- 3.2. Germany
- 3.3. France
- 3.4. Italy
- 3.5. Spain
- 3.6. Russia
- 3.7. Benelux
- 3.8. Nordics
- 3.9. Rest of Europe
-
4. Middle East & Africa
- 4.1. Turkey
- 4.2. Israel
- 4.3. GCC
- 4.4. North Africa
- 4.5. South Africa
- 4.6. Rest of Middle East & Africa
-
5. Asia Pacific
- 5.1. China
- 5.2. India
- 5.3. Japan
- 5.4. South Korea
- 5.5. ASEAN
- 5.6. Oceania
- 5.7. Rest of Asia Pacific
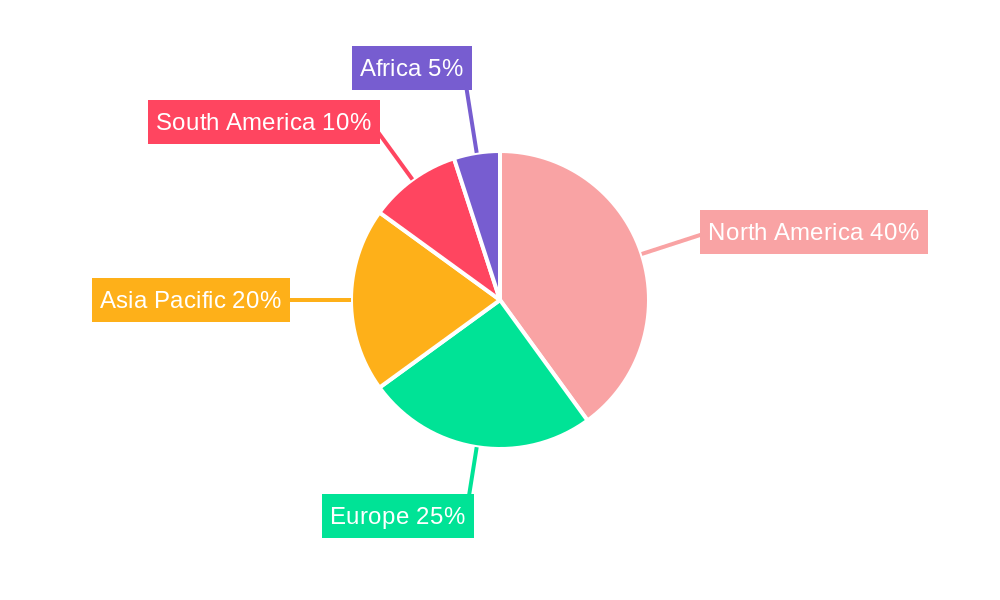
Aquaponics Industry Regional Market Share
Geographic Coverage of Aquaponics Industry
Aquaponics Industry REPORT HIGHLIGHTS
| Aspects | Details |
|---|---|
| Study Period | 2020-2034 |
| Base Year | 2025 |
| Estimated Year | 2026 |
| Forecast Period | 2026-2034 |
| Historical Period | 2020-2025 |
| Growth Rate | CAGR of 9.60% from 2020-2034 |
| Segmentation |
|
Table of Contents
- 1. Introduction
- 1.1. Research Scope
- 1.2. Market Segmentation
- 1.3. Research Objective
- 1.4. Definitions and Assumptions
- 2. Executive Summary
- 2.1. Market Snapshot
- 3. Market Dynamics
- 3.1. Market Drivers
- 3.2. Market Restrains
- 3.3. Market Trends
- 3.4. Market Opportunities
- 4. Market Factor Analysis
- 4.1. Porters Five Forces
- 4.1.1. Bargaining Power of Suppliers
- 4.1.2. Bargaining Power of Buyers
- 4.1.3. Threat of New Entrants
- 4.1.4. Threat of Substitutes
- 4.1.5. Competitive Rivalry
- 4.2. PESTEL analysis
- 4.3. BCG Analysis
- 4.3.1. Stars (High Growth, High Market Share)
- 4.3.2. Cash Cows (Low Growth, High Market Share)
- 4.3.3. Question Mark (High Growth, Low Market Share)
- 4.3.4. Dogs (Low Growth, Low Market Share)
- 4.4. Ansoff Matrix Analysis
- 4.5. Supply Chain Analysis
- 4.6. Regulatory Landscape
- 4.7. Current Market Potential and Opportunity Assessment (TAM–SAM–SOM Framework)
- 4.8. MDP Analyst Note
- 4.1. Porters Five Forces
- 5. Market Analysis, Insights and Forecast 2021-2033
- 5.1. Market Analysis, Insights and Forecast - by Production Analysis
- 5.2. Market Analysis, Insights and Forecast - by Consumption Analysis
- 5.3. Market Analysis, Insights and Forecast - by Import Market Analysis (Value & Volume)
- 5.4. Market Analysis, Insights and Forecast - by Export Market Analysis (Value & Volume)
- 5.5. Market Analysis, Insights and Forecast - by Price Trend Analysis
- 5.6. Market Analysis, Insights and Forecast - by Region
- 5.6.1. North America
- 5.6.2. South America
- 5.6.3. Europe
- 5.6.4. Middle East & Africa
- 5.6.5. Asia Pacific
- 6. Global Aquaponics Industry Analysis, Insights and Forecast, 2021-2033
- 6.1. Market Analysis, Insights and Forecast - by Production Analysis
- 6.2. Market Analysis, Insights and Forecast - by Consumption Analysis
- 6.3. Market Analysis, Insights and Forecast - by Import Market Analysis (Value & Volume)
- 6.4. Market Analysis, Insights and Forecast - by Export Market Analysis (Value & Volume)
- 6.5. Market Analysis, Insights and Forecast - by Price Trend Analysis
- 7. North America Aquaponics Industry Analysis, Insights and Forecast, 2020-2032
- 7.1. Market Analysis, Insights and Forecast - by Production Analysis
- 7.2. Market Analysis, Insights and Forecast - by Consumption Analysis
- 7.3. Market Analysis, Insights and Forecast - by Import Market Analysis (Value & Volume)
- 7.4. Market Analysis, Insights and Forecast - by Export Market Analysis (Value & Volume)
- 7.5. Market Analysis, Insights and Forecast - by Price Trend Analysis
- 8. South America Aquaponics Industry Analysis, Insights and Forecast, 2020-2032
- 8.1. Market Analysis, Insights and Forecast - by Production Analysis
- 8.2. Market Analysis, Insights and Forecast - by Consumption Analysis
- 8.3. Market Analysis, Insights and Forecast - by Import Market Analysis (Value & Volume)
- 8.4. Market Analysis, Insights and Forecast - by Export Market Analysis (Value & Volume)
- 8.5. Market Analysis, Insights and Forecast - by Price Trend Analysis
- 9. Europe Aquaponics Industry Analysis, Insights and Forecast, 2020-2032
- 9.1. Market Analysis, Insights and Forecast - by Production Analysis
- 9.2. Market Analysis, Insights and Forecast - by Consumption Analysis
- 9.3. Market Analysis, Insights and Forecast - by Import Market Analysis (Value & Volume)
- 9.4. Market Analysis, Insights and Forecast - by Export Market Analysis (Value & Volume)
- 9.5. Market Analysis, Insights and Forecast - by Price Trend Analysis
- 10. Middle East & Africa Aquaponics Industry Analysis, Insights and Forecast, 2020-2032
- 10.1. Market Analysis, Insights and Forecast - by Production Analysis
- 10.2. Market Analysis, Insights and Forecast - by Consumption Analysis
- 10.3. Market Analysis, Insights and Forecast - by Import Market Analysis (Value & Volume)
- 10.4. Market Analysis, Insights and Forecast - by Export Market Analysis (Value & Volume)
- 10.5. Market Analysis, Insights and Forecast - by Price Trend Analysis
- 11. Asia Pacific Aquaponics Industry Analysis, Insights and Forecast, 2020-2032
- 11.1. Market Analysis, Insights and Forecast - by Production Analysis
- 11.2. Market Analysis, Insights and Forecast - by Consumption Analysis
- 11.3. Market Analysis, Insights and Forecast - by Import Market Analysis (Value & Volume)
- 11.4. Market Analysis, Insights and Forecast - by Export Market Analysis (Value & Volume)
- 11.5. Market Analysis, Insights and Forecast - by Price Trend Analysis
- 12. Competitive Analysis
- 12.1. Company Profiles
- 12.1.1 Deep Water Farms
- 12.1.1.1. Company Overview
- 12.1.1.2. Products
- 12.1.1.3. Company Financials
- 12.1.1.4. SWOT Analysis
- 12.1.2 Superior Fresh
- 12.1.2.1. Company Overview
- 12.1.2.2. Products
- 12.1.2.3. Company Financials
- 12.1.2.4. SWOT Analysis
- 12.1.3 Practical Aquaponics
- 12.1.3.1. Company Overview
- 12.1.3.2. Products
- 12.1.3.3. Company Financials
- 12.1.3.4. SWOT Analysis
- 12.1.4 Nelson & Pade Aquaponics
- 12.1.4.1. Company Overview
- 12.1.4.2. Products
- 12.1.4.3. Company Financials
- 12.1.4.4. SWOT Analysis
- 12.1.5 BIGH
- 12.1.5.1. Company Overview
- 12.1.5.2. Products
- 12.1.5.3. Company Financials
- 12.1.5.4. SWOT Analysis
- 12.1.6 ECF Farm Berli
- 12.1.6.1. Company Overview
- 12.1.6.2. Products
- 12.1.6.3. Company Financials
- 12.1.6.4. SWOT Analysis
- 12.1.7 Garden City Aquaponics Inc
- 12.1.7.1. Company Overview
- 12.1.7.2. Products
- 12.1.7.3. Company Financials
- 12.1.7.4. SWOT Analysis
- 12.1.8 Aquaponics USA
- 12.1.8.1. Company Overview
- 12.1.8.2. Products
- 12.1.8.3. Company Financials
- 12.1.8.4. SWOT Analysis
- 12.1.9 Madhavi Farms
- 12.1.9.1. Company Overview
- 12.1.9.2. Products
- 12.1.9.3. Company Financials
- 12.1.9.4. SWOT Analysis
- 12.1.10 Ouroboros Farms
- 12.1.10.1. Company Overview
- 12.1.10.2. Products
- 12.1.10.3. Company Financials
- 12.1.10.4. SWOT Analysis
- 12.1.11 Pentair Aquatic Eco-System Inc (PAES)
- 12.1.11.1. Company Overview
- 12.1.11.2. Products
- 12.1.11.3. Company Financials
- 12.1.11.4. SWOT Analysis
- 12.1.1 Deep Water Farms
- 12.2. Market Entropy
- 12.2.1 Company's Key Areas Served
- 12.2.2 Recent Developments
- 12.3. Company Market Share Analysis 2025
- 12.3.1 Top 5 Companies Market Share Analysis
- 12.3.2 Top 3 Companies Market Share Analysis
- 12.4. List of Potential Customers
- 13. Research Methodology
List of Figures
- Figure 1: Global Aquaponics Industry Revenue Breakdown (Million, %) by Region 2025 & 2033
- Figure 2: North America Aquaponics Industry Revenue (Million), by Production Analysis 2025 & 2033
- Figure 3: North America Aquaponics Industry Revenue Share (%), by Production Analysis 2025 & 2033
- Figure 4: North America Aquaponics Industry Revenue (Million), by Consumption Analysis 2025 & 2033
- Figure 5: North America Aquaponics Industry Revenue Share (%), by Consumption Analysis 2025 & 2033
- Figure 6: North America Aquaponics Industry Revenue (Million), by Import Market Analysis (Value & Volume) 2025 & 2033
- Figure 7: North America Aquaponics Industry Revenue Share (%), by Import Market Analysis (Value & Volume) 2025 & 2033
- Figure 8: North America Aquaponics Industry Revenue (Million), by Export Market Analysis (Value & Volume) 2025 & 2033
- Figure 9: North America Aquaponics Industry Revenue Share (%), by Export Market Analysis (Value & Volume) 2025 & 2033
- Figure 10: North America Aquaponics Industry Revenue (Million), by Price Trend Analysis 2025 & 2033
- Figure 11: North America Aquaponics Industry Revenue Share (%), by Price Trend Analysis 2025 & 2033
- Figure 12: North America Aquaponics Industry Revenue (Million), by Country 2025 & 2033
- Figure 13: North America Aquaponics Industry Revenue Share (%), by Country 2025 & 2033
- Figure 14: South America Aquaponics Industry Revenue (Million), by Production Analysis 2025 & 2033
- Figure 15: South America Aquaponics Industry Revenue Share (%), by Production Analysis 2025 & 2033
- Figure 16: South America Aquaponics Industry Revenue (Million), by Consumption Analysis 2025 & 2033
- Figure 17: South America Aquaponics Industry Revenue Share (%), by Consumption Analysis 2025 & 2033
- Figure 18: South America Aquaponics Industry Revenue (Million), by Import Market Analysis (Value & Volume) 2025 & 2033
- Figure 19: South America Aquaponics Industry Revenue Share (%), by Import Market Analysis (Value & Volume) 2025 & 2033
- Figure 20: South America Aquaponics Industry Revenue (Million), by Export Market Analysis (Value & Volume) 2025 & 2033
- Figure 21: South America Aquaponics Industry Revenue Share (%), by Export Market Analysis (Value & Volume) 2025 & 2033
- Figure 22: South America Aquaponics Industry Revenue (Million), by Price Trend Analysis 2025 & 2033
- Figure 23: South America Aquaponics Industry Revenue Share (%), by Price Trend Analysis 2025 & 2033
- Figure 24: South America Aquaponics Industry Revenue (Million), by Country 2025 & 2033
- Figure 25: South America Aquaponics Industry Revenue Share (%), by Country 2025 & 2033
- Figure 26: Europe Aquaponics Industry Revenue (Million), by Production Analysis 2025 & 2033
- Figure 27: Europe Aquaponics Industry Revenue Share (%), by Production Analysis 2025 & 2033
- Figure 28: Europe Aquaponics Industry Revenue (Million), by Consumption Analysis 2025 & 2033
- Figure 29: Europe Aquaponics Industry Revenue Share (%), by Consumption Analysis 2025 & 2033
- Figure 30: Europe Aquaponics Industry Revenue (Million), by Import Market Analysis (Value & Volume) 2025 & 2033
- Figure 31: Europe Aquaponics Industry Revenue Share (%), by Import Market Analysis (Value & Volume) 2025 & 2033
- Figure 32: Europe Aquaponics Industry Revenue (Million), by Export Market Analysis (Value & Volume) 2025 & 2033
- Figure 33: Europe Aquaponics Industry Revenue Share (%), by Export Market Analysis (Value & Volume) 2025 & 2033
- Figure 34: Europe Aquaponics Industry Revenue (Million), by Price Trend Analysis 2025 & 2033
- Figure 35: Europe Aquaponics Industry Revenue Share (%), by Price Trend Analysis 2025 & 2033
- Figure 36: Europe Aquaponics Industry Revenue (Million), by Country 2025 & 2033
- Figure 37: Europe Aquaponics Industry Revenue Share (%), by Country 2025 & 2033
- Figure 38: Middle East & Africa Aquaponics Industry Revenue (Million), by Production Analysis 2025 & 2033
- Figure 39: Middle East & Africa Aquaponics Industry Revenue Share (%), by Production Analysis 2025 & 2033
- Figure 40: Middle East & Africa Aquaponics Industry Revenue (Million), by Consumption Analysis 2025 & 2033
- Figure 41: Middle East & Africa Aquaponics Industry Revenue Share (%), by Consumption Analysis 2025 & 2033
- Figure 42: Middle East & Africa Aquaponics Industry Revenue (Million), by Import Market Analysis (Value & Volume) 2025 & 2033
- Figure 43: Middle East & Africa Aquaponics Industry Revenue Share (%), by Import Market Analysis (Value & Volume) 2025 & 2033
- Figure 44: Middle East & Africa Aquaponics Industry Revenue (Million), by Export Market Analysis (Value & Volume) 2025 & 2033
- Figure 45: Middle East & Africa Aquaponics Industry Revenue Share (%), by Export Market Analysis (Value & Volume) 2025 & 2033
- Figure 46: Middle East & Africa Aquaponics Industry Revenue (Million), by Price Trend Analysis 2025 & 2033
- Figure 47: Middle East & Africa Aquaponics Industry Revenue Share (%), by Price Trend Analysis 2025 & 2033
- Figure 48: Middle East & Africa Aquaponics Industry Revenue (Million), by Country 2025 & 2033
- Figure 49: Middle East & Africa Aquaponics Industry Revenue Share (%), by Country 2025 & 2033
- Figure 50: Asia Pacific Aquaponics Industry Revenue (Million), by Production Analysis 2025 & 2033
- Figure 51: Asia Pacific Aquaponics Industry Revenue Share (%), by Production Analysis 2025 & 2033
- Figure 52: Asia Pacific Aquaponics Industry Revenue (Million), by Consumption Analysis 2025 & 2033
- Figure 53: Asia Pacific Aquaponics Industry Revenue Share (%), by Consumption Analysis 2025 & 2033
- Figure 54: Asia Pacific Aquaponics Industry Revenue (Million), by Import Market Analysis (Value & Volume) 2025 & 2033
- Figure 55: Asia Pacific Aquaponics Industry Revenue Share (%), by Import Market Analysis (Value & Volume) 2025 & 2033
- Figure 56: Asia Pacific Aquaponics Industry Revenue (Million), by Export Market Analysis (Value & Volume) 2025 & 2033
- Figure 57: Asia Pacific Aquaponics Industry Revenue Share (%), by Export Market Analysis (Value & Volume) 2025 & 2033
- Figure 58: Asia Pacific Aquaponics Industry Revenue (Million), by Price Trend Analysis 2025 & 2033
- Figure 59: Asia Pacific Aquaponics Industry Revenue Share (%), by Price Trend Analysis 2025 & 2033
- Figure 60: Asia Pacific Aquaponics Industry Revenue (Million), by Country 2025 & 2033
- Figure 61: Asia Pacific Aquaponics Industry Revenue Share (%), by Country 2025 & 2033
List of Tables
- Table 1: Global Aquaponics Industry Revenue Million Forecast, by Production Analysis 2020 & 2033
- Table 2: Global Aquaponics Industry Revenue Million Forecast, by Consumption Analysis 2020 & 2033
- Table 3: Global Aquaponics Industry Revenue Million Forecast, by Import Market Analysis (Value & Volume) 2020 & 2033
- Table 4: Global Aquaponics Industry Revenue Million Forecast, by Export Market Analysis (Value & Volume) 2020 & 2033
- Table 5: Global Aquaponics Industry Revenue Million Forecast, by Price Trend Analysis 2020 & 2033
- Table 6: Global Aquaponics Industry Revenue Million Forecast, by Region 2020 & 2033
- Table 7: Global Aquaponics Industry Revenue Million Forecast, by Production Analysis 2020 & 2033
- Table 8: Global Aquaponics Industry Revenue Million Forecast, by Consumption Analysis 2020 & 2033
- Table 9: Global Aquaponics Industry Revenue Million Forecast, by Import Market Analysis (Value & Volume) 2020 & 2033
- Table 10: Global Aquaponics Industry Revenue Million Forecast, by Export Market Analysis (Value & Volume) 2020 & 2033
- Table 11: Global Aquaponics Industry Revenue Million Forecast, by Price Trend Analysis 2020 & 2033
- Table 12: Global Aquaponics Industry Revenue Million Forecast, by Country 2020 & 2033
- Table 13: United States Aquaponics Industry Revenue (Million) Forecast, by Application 2020 & 2033
- Table 14: Canada Aquaponics Industry Revenue (Million) Forecast, by Application 2020 & 2033
- Table 15: Mexico Aquaponics Industry Revenue (Million) Forecast, by Application 2020 & 2033
- Table 16: Global Aquaponics Industry Revenue Million Forecast, by Production Analysis 2020 & 2033
- Table 17: Global Aquaponics Industry Revenue Million Forecast, by Consumption Analysis 2020 & 2033
- Table 18: Global Aquaponics Industry Revenue Million Forecast, by Import Market Analysis (Value & Volume) 2020 & 2033
- Table 19: Global Aquaponics Industry Revenue Million Forecast, by Export Market Analysis (Value & Volume) 2020 & 2033
- Table 20: Global Aquaponics Industry Revenue Million Forecast, by Price Trend Analysis 2020 & 2033
- Table 21: Global Aquaponics Industry Revenue Million Forecast, by Country 2020 & 2033
- Table 22: Brazil Aquaponics Industry Revenue (Million) Forecast, by Application 2020 & 2033
- Table 23: Argentina Aquaponics Industry Revenue (Million) Forecast, by Application 2020 & 2033
- Table 24: Rest of South America Aquaponics Industry Revenue (Million) Forecast, by Application 2020 & 2033
- Table 25: Global Aquaponics Industry Revenue Million Forecast, by Production Analysis 2020 & 2033
- Table 26: Global Aquaponics Industry Revenue Million Forecast, by Consumption Analysis 2020 & 2033
- Table 27: Global Aquaponics Industry Revenue Million Forecast, by Import Market Analysis (Value & Volume) 2020 & 2033
- Table 28: Global Aquaponics Industry Revenue Million Forecast, by Export Market Analysis (Value & Volume) 2020 & 2033
- Table 29: Global Aquaponics Industry Revenue Million Forecast, by Price Trend Analysis 2020 & 2033
- Table 30: Global Aquaponics Industry Revenue Million Forecast, by Country 2020 & 2033
- Table 31: United Kingdom Aquaponics Industry Revenue (Million) Forecast, by Application 2020 & 2033
- Table 32: Germany Aquaponics Industry Revenue (Million) Forecast, by Application 2020 & 2033
- Table 33: France Aquaponics Industry Revenue (Million) Forecast, by Application 2020 & 2033
- Table 34: Italy Aquaponics Industry Revenue (Million) Forecast, by Application 2020 & 2033
- Table 35: Spain Aquaponics Industry Revenue (Million) Forecast, by Application 2020 & 2033
- Table 36: Russia Aquaponics Industry Revenue (Million) Forecast, by Application 2020 & 2033
- Table 37: Benelux Aquaponics Industry Revenue (Million) Forecast, by Application 2020 & 2033
- Table 38: Nordics Aquaponics Industry Revenue (Million) Forecast, by Application 2020 & 2033
- Table 39: Rest of Europe Aquaponics Industry Revenue (Million) Forecast, by Application 2020 & 2033
- Table 40: Global Aquaponics Industry Revenue Million Forecast, by Production Analysis 2020 & 2033
- Table 41: Global Aquaponics Industry Revenue Million Forecast, by Consumption Analysis 2020 & 2033
- Table 42: Global Aquaponics Industry Revenue Million Forecast, by Import Market Analysis (Value & Volume) 2020 & 2033
- Table 43: Global Aquaponics Industry Revenue Million Forecast, by Export Market Analysis (Value & Volume) 2020 & 2033
- Table 44: Global Aquaponics Industry Revenue Million Forecast, by Price Trend Analysis 2020 & 2033
- Table 45: Global Aquaponics Industry Revenue Million Forecast, by Country 2020 & 2033
- Table 46: Turkey Aquaponics Industry Revenue (Million) Forecast, by Application 2020 & 2033
- Table 47: Israel Aquaponics Industry Revenue (Million) Forecast, by Application 2020 & 2033
- Table 48: GCC Aquaponics Industry Revenue (Million) Forecast, by Application 2020 & 2033
- Table 49: North Africa Aquaponics Industry Revenue (Million) Forecast, by Application 2020 & 2033
- Table 50: South Africa Aquaponics Industry Revenue (Million) Forecast, by Application 2020 & 2033
- Table 51: Rest of Middle East & Africa Aquaponics Industry Revenue (Million) Forecast, by Application 2020 & 2033
- Table 52: Global Aquaponics Industry Revenue Million Forecast, by Production Analysis 2020 & 2033
- Table 53: Global Aquaponics Industry Revenue Million Forecast, by Consumption Analysis 2020 & 2033
- Table 54: Global Aquaponics Industry Revenue Million Forecast, by Import Market Analysis (Value & Volume) 2020 & 2033
- Table 55: Global Aquaponics Industry Revenue Million Forecast, by Export Market Analysis (Value & Volume) 2020 & 2033
- Table 56: Global Aquaponics Industry Revenue Million Forecast, by Price Trend Analysis 2020 & 2033
- Table 57: Global Aquaponics Industry Revenue Million Forecast, by Country 2020 & 2033
- Table 58: China Aquaponics Industry Revenue (Million) Forecast, by Application 2020 & 2033
- Table 59: India Aquaponics Industry Revenue (Million) Forecast, by Application 2020 & 2033
- Table 60: Japan Aquaponics Industry Revenue (Million) Forecast, by Application 2020 & 2033
- Table 61: South Korea Aquaponics Industry Revenue (Million) Forecast, by Application 2020 & 2033
- Table 62: ASEAN Aquaponics Industry Revenue (Million) Forecast, by Application 2020 & 2033
- Table 63: Oceania Aquaponics Industry Revenue (Million) Forecast, by Application 2020 & 2033
- Table 64: Rest of Asia Pacific Aquaponics Industry Revenue (Million) Forecast, by Application 2020 & 2033
Frequently Asked Questions
1. What is the projected Compound Annual Growth Rate (CAGR) of the Aquaponics Industry?
The projected CAGR is approximately 9.60%.
2. Which companies are prominent players in the Aquaponics Industry?
Key companies in the market include Deep Water Farms, Superior Fresh, Practical Aquaponics, Nelson & Pade Aquaponics, BIGH, ECF Farm Berli, Garden City Aquaponics Inc, Aquaponics USA, Madhavi Farms, Ouroboros Farms, Pentair Aquatic Eco-System Inc (PAES).
3. What are the main segments of the Aquaponics Industry?
The market segments include Production Analysis, Consumption Analysis, Import Market Analysis (Value & Volume), Export Market Analysis (Value & Volume), Price Trend Analysis.
4. Can you provide details about the market size?
The market size is estimated to be USD 1.21 Million as of 2022.
5. What are some drivers contributing to market growth?
High Cost of Farm Labors; Increasing Consumption of Grain Crops.
6. What are the notable trends driving market growth?
Substantial Demand for Organic Produce Driving the Market.
7. Are there any restraints impacting market growth?
High Cost of Combine Harvesters; Small and Fragmented Land Holdings.
8. Can you provide examples of recent developments in the market?
N/A
9. What pricing options are available for accessing the report?
Pricing options include single-user, multi-user, and enterprise licenses priced at USD 4750, USD 5250, and USD 8750 respectively.
10. Is the market size provided in terms of value or volume?
The market size is provided in terms of value, measured in Million.
11. Are there any specific market keywords associated with the report?
Yes, the market keyword associated with the report is "Aquaponics Industry," which aids in identifying and referencing the specific market segment covered.
12. How do I determine which pricing option suits my needs best?
The pricing options vary based on user requirements and access needs. Individual users may opt for single-user licenses, while businesses requiring broader access may choose multi-user or enterprise licenses for cost-effective access to the report.
13. Are there any additional resources or data provided in the Aquaponics Industry report?
While the report offers comprehensive insights, it's advisable to review the specific contents or supplementary materials provided to ascertain if additional resources or data are available.
14. How can I stay updated on further developments or reports in the Aquaponics Industry?
To stay informed about further developments, trends, and reports in the Aquaponics Industry, consider subscribing to industry newsletters, following relevant companies and organizations, or regularly checking reputable industry news sources and publications.
Methodology
Step 1 - Identification of Relevant Samples Size from Population Database


Step 2 - Approaches for Defining Global Market Size (Value, Volume* & Price*)

Note*: In applicable scenarios
Step 3 - Data Sources
Primary Research
- Web Analytics
- Survey Reports
- Research Institute
- Latest Research Reports
- Opinion Leaders
Secondary Research
- Annual Reports
- White Paper
- Latest Press Release
- Industry Association
- Paid Database
- Investor Presentations

Step 4 - Data Triangulation
Involves using different sources of information in order to increase the validity of a study
These sources are likely to be stakeholders in a program - participants, other researchers, program staff, other community members, and so on.
Then we put all data in single framework & apply various statistical tools to find out the dynamic on the market.
During the analysis stage, feedback from the stakeholder groups would be compared to determine areas of agreement as well as areas of divergence