

Key Insights
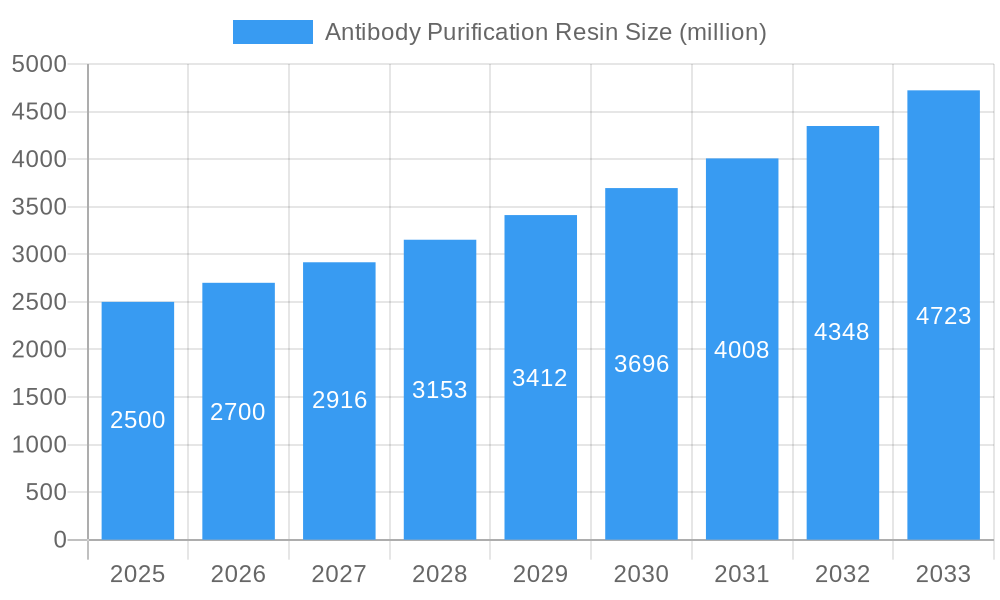
The global antibody purification resin market is poised for significant expansion, driven by the surging demand for biopharmaceuticals and therapeutic antibodies. Advancements in biotechnology, coupled with the rising incidence of chronic diseases requiring antibody-based treatments, are key growth catalysts. The market is projected to achieve a Compound Annual Growth Rate (CAGR) of 5.62% from a market size of 1.67 billion in the base year 2025. Growth segments include purification of monoclonal antibodies (mAbs), polyclonal antibodies, and Fc fusion proteins, utilizing resin types such as Protein A, G, A/G, and L. North America and Europe dominate market share due to mature biopharmaceutical industries and stringent regulatory environments. However, the Asia-Pacific region, particularly China and India, presents substantial growth opportunities driven by increased R&D investment and manufacturing capacity.
Antibody Purification Resin Market Size (In Billion)
Key market restraints encompass the high cost of purification resins and potential performance variability. Despite these challenges, ongoing technological innovations, the development of cost-effective solutions, and advanced purification platforms are expected to drive market growth. The competitive landscape features established industry leaders and emerging players, fostering an environment that demands continuous innovation and strategic collaborations. The antibody purification resin market demonstrates a robust long-term outlook, underpinned by the expanding biopharmaceutical sector and the increasing reliance on antibody therapies.
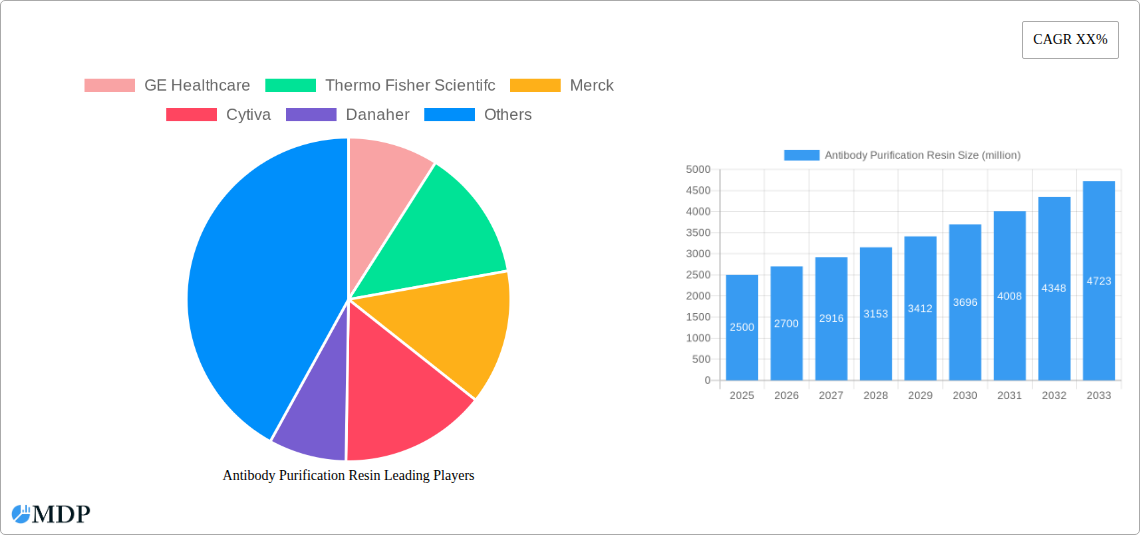
Antibody Purification Resin Company Market Share
Antibody Purification Resin Market Report: 2019-2033
This comprehensive report provides an in-depth analysis of the global antibody purification resin market, projecting a multi-million-dollar valuation by 2033. The study covers market dynamics, industry trends, leading players (including GE Healthcare, Thermo Fisher Scientific, Merck, and more), and emerging opportunities, offering valuable insights for stakeholders across the pharmaceutical and biotechnology industries. Benefit from detailed segmentation analysis across applications (monoclonal, polyclonal antibodies, Fc fusion proteins) and resin types (Protein A, G, A/G, L), covering the historical period (2019-2024), base year (2025), and forecast period (2025-2033).
Antibody Purification Resin Market Dynamics & Concentration
The global antibody purification resin market is characterized by a moderately concentrated landscape, with key players holding significant market share. The market's value in 2025 is estimated at $XX million, expected to grow at a CAGR of XX% from 2025 to 2033, reaching $XX million. Innovation, driven by the need for higher purity, yield, and efficiency, fuels market growth. Stringent regulatory frameworks, particularly in the biopharmaceutical sector, influence product development and adoption. Product substitutes, such as alternative chromatography techniques, present competitive pressure. End-user trends, such as the increasing demand for biosimilars and personalized medicine, further shape market dynamics. Significant M&A activities, with an estimated XX deals in the last five years, have reshaped the competitive landscape, leading to consolidation among larger players and the emergence of innovative technologies.
- Market Share: Top 5 players hold approximately XX% of the market.
- M&A Activity: XX major mergers and acquisitions occurred between 2019 and 2024.
- Innovation Drivers: Demand for high-throughput purification, improved selectivity, and reduced manufacturing costs.
- Regulatory Landscape: Compliance with cGMP and other international standards heavily influences market dynamics.
Antibody Purification Resin Industry Trends & Analysis
The antibody purification resin market is experiencing robust growth, driven by several key factors. The rising prevalence of chronic diseases, an increase in biopharmaceutical research and development, and growing demand for biosimilars are major contributors to market expansion. Technological advancements, particularly in resin design and chromatography techniques, lead to improved purification efficiency and reduced processing times. Consumer preferences for higher-quality and more cost-effective therapies drive demand for innovative purification solutions. The competitive landscape is marked by intense R&D investment, strategic partnerships, and technological advancements, resulting in a dynamic market environment. Market penetration of advanced resin technologies continues to grow, reflecting the industry's focus on enhancing process efficiency and reducing costs. The global market is forecast to reach $XX million by 2033, reflecting an impressive CAGR of XX%.
Leading Markets & Segments in Antibody Purification Resin
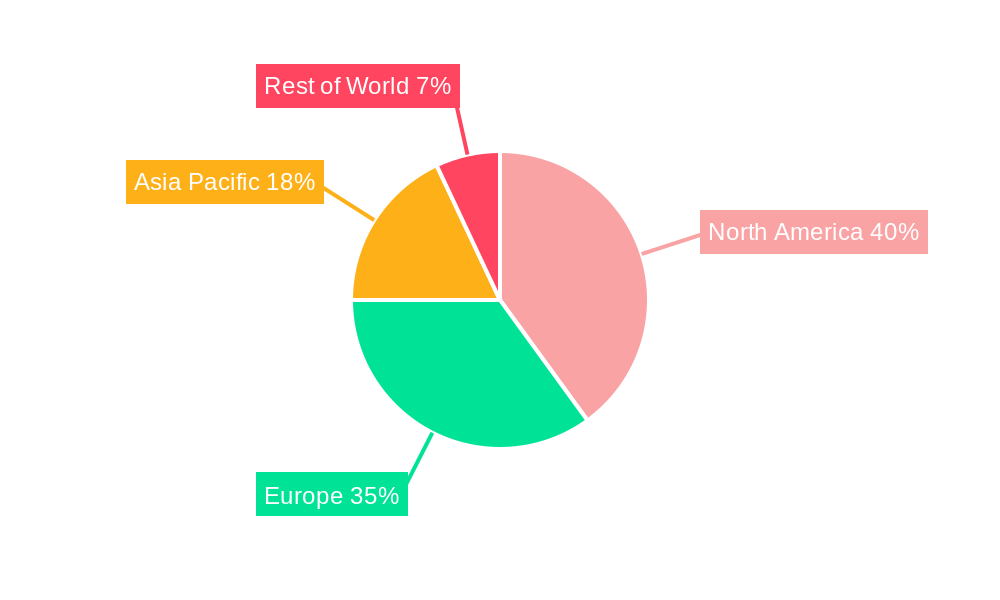
The North American region holds a dominant position in the antibody purification resin market, driven by a robust biopharmaceutical industry, significant R&D investment, and a high prevalence of chronic diseases. Europe also plays a major role due to strong regulatory frameworks and the presence of established pharmaceutical companies. Within applications, the purification of monoclonal antibodies accounts for the largest segment, driven by the dominance of monoclonal antibody therapies in the pharmaceutical market. Similarly, Protein A resin dominates the resin type segment due to its high affinity for antibodies and widespread adoption in industrial settings.
- Key Drivers in North America: Strong biopharmaceutical industry, substantial R&D investment, and favorable regulatory environment.
- Key Drivers in Europe: Well-established pharmaceutical industry, stringent regulatory frameworks, and a focus on innovation.
- Dominant Application: Purification of Monoclonal Antibodies, driven by the growing prevalence of monoclonal antibody-based therapies.
- Dominant Resin Type: Protein A Resin, due to its high affinity and established industrial usage.
Antibody Purification Resin Product Developments
Recent product developments focus on enhancing resin performance, particularly in terms of binding capacity, selectivity, and durability. Innovations include the development of novel ligands with improved affinity and specificity, as well as the introduction of more robust and cost-effective resin matrices. These advancements address the need for higher purity, yield, and process efficiency in antibody purification. The market is seeing increased adoption of next-generation resins engineered for specific antibody types or applications, showcasing a tailored approach to purification.
Key Drivers of Antibody Purification Resin Growth
Technological advancements in resin design and chromatography techniques are driving market growth by enabling higher purity, yield, and efficiency in antibody purification processes. The rising prevalence of chronic diseases globally fuels the demand for antibody-based therapies, thereby increasing the need for effective purification resins. Favorable regulatory environments and supportive government initiatives in several regions further stimulate the market expansion. The continuous increase in biopharmaceutical research and development activities is also creating significant opportunities for growth.
Challenges in the Antibody Purification Resin Market
High manufacturing costs and stringent regulatory requirements pose significant challenges to market growth. Supply chain disruptions can impact the availability and pricing of raw materials, affecting resin production and market stability. Intense competition among established players and emerging market entrants creates pricing pressure and limits profitability. Further challenges include the need for continuous innovation to meet the evolving needs of the biopharmaceutical industry and maintaining regulatory compliance in a rapidly changing landscape. These factors influence overall market accessibility and sustainability.
Emerging Opportunities in Antibody Purification Resin
The development of novel resin technologies, such as monolithic columns and magnetic beads, promises to enhance purification efficiency and reduce processing times. Strategic partnerships between resin manufacturers and biopharmaceutical companies will enable the development of customized purification solutions, catering to specific application needs. Expansion into emerging markets with growing healthcare infrastructure and investment in biopharmaceutical research represents a significant growth avenue for the antibody purification resin market.
Leading Players in the Antibody Purification Resin Sector
- GE Healthcare
- Thermo Fisher Scientific
- Merck
- Cytiva
- Danaher
- Tosoh Bioscience
- Abcam
- MBL (JSR)
- Agilent
- PerkinElmer
- Takara
- Purolite
- Bio-Rad Laboratories
- Novasep Holdings
- Genscript
- Marvelgent Biosciences
- Kaneka
- Suzhou NanoMicro Technology
- Guangzhou Jet Bio-Filtration
- Sepax Technologies, Inc.
- Duoning Biotechnology Group
Key Milestones in Antibody Purification Resin Industry
- 2020: Launch of a novel Protein A resin with enhanced binding capacity by Cytiva.
- 2021: Acquisition of a smaller resin manufacturer by a major player (e.g., Thermo Fisher Scientific acquiring a smaller company).
- 2022: Introduction of a new, sustainable resin technology by a leading player (e.g., GE Healthcare introducing an environmentally friendly resin).
- 2023: FDA approval of a new monoclonal antibody therapy, driving increased demand for purification resins.
- 2024: Partnership between a resin manufacturer and a biopharmaceutical company to develop a specialized resin for a new class of antibodies.
Strategic Outlook for Antibody Purification Resin Market
The antibody purification resin market is poised for substantial growth, driven by continuous technological innovation, increasing demand for antibody-based therapies, and expansion into emerging markets. Strategic partnerships, acquisitions, and investments in R&D will be crucial for companies to maintain competitiveness and capture market share. Focus on developing cost-effective, high-performance resins with improved sustainability profiles will be key to long-term success. The market will continue to evolve, driven by the growing demand for personalized medicine and advancements in antibody engineering.
Antibody Purification Resin Segmentation
-
1. Application
- 1.1. Purification of Monoclonal Antibodies
- 1.2. Purification of Polyclonal Antibodies
- 1.3. Purification of Fc Fusion Protein
- 1.4. Other
-
2. Types
- 2.1. Protein A Resin
- 2.2. Protein G Resin
- 2.3. Protein A/G Resin
- 2.4. Protein L Resin
- 2.5. Other
Antibody Purification Resin Segmentation By Geography
-
1. North America
- 1.1. United States
- 1.2. Canada
- 1.3. Mexico
-
2. South America
- 2.1. Brazil
- 2.2. Argentina
- 2.3. Rest of South America
-
3. Europe
- 3.1. United Kingdom
- 3.2. Germany
- 3.3. France
- 3.4. Italy
- 3.5. Spain
- 3.6. Russia
- 3.7. Benelux
- 3.8. Nordics
- 3.9. Rest of Europe
-
4. Middle East & Africa
- 4.1. Turkey
- 4.2. Israel
- 4.3. GCC
- 4.4. North Africa
- 4.5. South Africa
- 4.6. Rest of Middle East & Africa
-
5. Asia Pacific
- 5.1. China
- 5.2. India
- 5.3. Japan
- 5.4. South Korea
- 5.5. ASEAN
- 5.6. Oceania
- 5.7. Rest of Asia Pacific
Antibody Purification Resin Regional Market Share
Geographic Coverage of Antibody Purification Resin
Antibody Purification Resin REPORT HIGHLIGHTS
| Aspects | Details |
|---|---|
| Study Period | 2020-2034 |
| Base Year | 2025 |
| Estimated Year | 2026 |
| Forecast Period | 2026-2034 |
| Historical Period | 2020-2025 |
| Growth Rate | CAGR of 5.62% from 2020-2034 |
| Segmentation |
|
Table of Contents
- 1. Introduction
- 1.1. Research Scope
- 1.2. Market Segmentation
- 1.3. Research Methodology
- 1.4. Definitions and Assumptions
- 2. Executive Summary
- 2.1. Introduction
- 3. Market Dynamics
- 3.1. Introduction
- 3.2. Market Drivers
- 3.3. Market Restrains
- 3.4. Market Trends
- 4. Market Factor Analysis
- 4.1. Porters Five Forces
- 4.2. Supply/Value Chain
- 4.3. PESTEL analysis
- 4.4. Market Entropy
- 4.5. Patent/Trademark Analysis
- 5. Global Antibody Purification Resin Analysis, Insights and Forecast, 2020-2032
- 5.1. Market Analysis, Insights and Forecast - by Application
- 5.1.1. Purification of Monoclonal Antibodies
- 5.1.2. Purification of Polyclonal Antibodies
- 5.1.3. Purification of Fc Fusion Protein
- 5.1.4. Other
- 5.2. Market Analysis, Insights and Forecast - by Types
- 5.2.1. Protein A Resin
- 5.2.2. Protein G Resin
- 5.2.3. Protein A/G Resin
- 5.2.4. Protein L Resin
- 5.2.5. Other
- 5.3. Market Analysis, Insights and Forecast - by Region
- 5.3.1. North America
- 5.3.2. South America
- 5.3.3. Europe
- 5.3.4. Middle East & Africa
- 5.3.5. Asia Pacific
- 5.1. Market Analysis, Insights and Forecast - by Application
- 6. North America Antibody Purification Resin Analysis, Insights and Forecast, 2020-2032
- 6.1. Market Analysis, Insights and Forecast - by Application
- 6.1.1. Purification of Monoclonal Antibodies
- 6.1.2. Purification of Polyclonal Antibodies
- 6.1.3. Purification of Fc Fusion Protein
- 6.1.4. Other
- 6.2. Market Analysis, Insights and Forecast - by Types
- 6.2.1. Protein A Resin
- 6.2.2. Protein G Resin
- 6.2.3. Protein A/G Resin
- 6.2.4. Protein L Resin
- 6.2.5. Other
- 6.1. Market Analysis, Insights and Forecast - by Application
- 7. South America Antibody Purification Resin Analysis, Insights and Forecast, 2020-2032
- 7.1. Market Analysis, Insights and Forecast - by Application
- 7.1.1. Purification of Monoclonal Antibodies
- 7.1.2. Purification of Polyclonal Antibodies
- 7.1.3. Purification of Fc Fusion Protein
- 7.1.4. Other
- 7.2. Market Analysis, Insights and Forecast - by Types
- 7.2.1. Protein A Resin
- 7.2.2. Protein G Resin
- 7.2.3. Protein A/G Resin
- 7.2.4. Protein L Resin
- 7.2.5. Other
- 7.1. Market Analysis, Insights and Forecast - by Application
- 8. Europe Antibody Purification Resin Analysis, Insights and Forecast, 2020-2032
- 8.1. Market Analysis, Insights and Forecast - by Application
- 8.1.1. Purification of Monoclonal Antibodies
- 8.1.2. Purification of Polyclonal Antibodies
- 8.1.3. Purification of Fc Fusion Protein
- 8.1.4. Other
- 8.2. Market Analysis, Insights and Forecast - by Types
- 8.2.1. Protein A Resin
- 8.2.2. Protein G Resin
- 8.2.3. Protein A/G Resin
- 8.2.4. Protein L Resin
- 8.2.5. Other
- 8.1. Market Analysis, Insights and Forecast - by Application
- 9. Middle East & Africa Antibody Purification Resin Analysis, Insights and Forecast, 2020-2032
- 9.1. Market Analysis, Insights and Forecast - by Application
- 9.1.1. Purification of Monoclonal Antibodies
- 9.1.2. Purification of Polyclonal Antibodies
- 9.1.3. Purification of Fc Fusion Protein
- 9.1.4. Other
- 9.2. Market Analysis, Insights and Forecast - by Types
- 9.2.1. Protein A Resin
- 9.2.2. Protein G Resin
- 9.2.3. Protein A/G Resin
- 9.2.4. Protein L Resin
- 9.2.5. Other
- 9.1. Market Analysis, Insights and Forecast - by Application
- 10. Asia Pacific Antibody Purification Resin Analysis, Insights and Forecast, 2020-2032
- 10.1. Market Analysis, Insights and Forecast - by Application
- 10.1.1. Purification of Monoclonal Antibodies
- 10.1.2. Purification of Polyclonal Antibodies
- 10.1.3. Purification of Fc Fusion Protein
- 10.1.4. Other
- 10.2. Market Analysis, Insights and Forecast - by Types
- 10.2.1. Protein A Resin
- 10.2.2. Protein G Resin
- 10.2.3. Protein A/G Resin
- 10.2.4. Protein L Resin
- 10.2.5. Other
- 10.1. Market Analysis, Insights and Forecast - by Application
- 11. Competitive Analysis
- 11.1. Global Market Share Analysis 2025
- 11.2. Company Profiles
- 11.2.1 GE Healthcare
- 11.2.1.1. Overview
- 11.2.1.2. Products
- 11.2.1.3. SWOT Analysis
- 11.2.1.4. Recent Developments
- 11.2.1.5. Financials (Based on Availability)
- 11.2.2 Thermo Fisher Scientifc
- 11.2.2.1. Overview
- 11.2.2.2. Products
- 11.2.2.3. SWOT Analysis
- 11.2.2.4. Recent Developments
- 11.2.2.5. Financials (Based on Availability)
- 11.2.3 Merck
- 11.2.3.1. Overview
- 11.2.3.2. Products
- 11.2.3.3. SWOT Analysis
- 11.2.3.4. Recent Developments
- 11.2.3.5. Financials (Based on Availability)
- 11.2.4 Cytiva
- 11.2.4.1. Overview
- 11.2.4.2. Products
- 11.2.4.3. SWOT Analysis
- 11.2.4.4. Recent Developments
- 11.2.4.5. Financials (Based on Availability)
- 11.2.5 Danaher
- 11.2.5.1. Overview
- 11.2.5.2. Products
- 11.2.5.3. SWOT Analysis
- 11.2.5.4. Recent Developments
- 11.2.5.5. Financials (Based on Availability)
- 11.2.6 Tosoh Bioscience
- 11.2.6.1. Overview
- 11.2.6.2. Products
- 11.2.6.3. SWOT Analysis
- 11.2.6.4. Recent Developments
- 11.2.6.5. Financials (Based on Availability)
- 11.2.7 Abcam
- 11.2.7.1. Overview
- 11.2.7.2. Products
- 11.2.7.3. SWOT Analysis
- 11.2.7.4. Recent Developments
- 11.2.7.5. Financials (Based on Availability)
- 11.2.8 MBL (JSR)
- 11.2.8.1. Overview
- 11.2.8.2. Products
- 11.2.8.3. SWOT Analysis
- 11.2.8.4. Recent Developments
- 11.2.8.5. Financials (Based on Availability)
- 11.2.9 Agilent
- 11.2.9.1. Overview
- 11.2.9.2. Products
- 11.2.9.3. SWOT Analysis
- 11.2.9.4. Recent Developments
- 11.2.9.5. Financials (Based on Availability)
- 11.2.10 Perkin Elmer
- 11.2.10.1. Overview
- 11.2.10.2. Products
- 11.2.10.3. SWOT Analysis
- 11.2.10.4. Recent Developments
- 11.2.10.5. Financials (Based on Availability)
- 11.2.11 Takara
- 11.2.11.1. Overview
- 11.2.11.2. Products
- 11.2.11.3. SWOT Analysis
- 11.2.11.4. Recent Developments
- 11.2.11.5. Financials (Based on Availability)
- 11.2.12 Purolite
- 11.2.12.1. Overview
- 11.2.12.2. Products
- 11.2.12.3. SWOT Analysis
- 11.2.12.4. Recent Developments
- 11.2.12.5. Financials (Based on Availability)
- 11.2.13 Bio-Rad Laboratories
- 11.2.13.1. Overview
- 11.2.13.2. Products
- 11.2.13.3. SWOT Analysis
- 11.2.13.4. Recent Developments
- 11.2.13.5. Financials (Based on Availability)
- 11.2.14 Novasep Holdings
- 11.2.14.1. Overview
- 11.2.14.2. Products
- 11.2.14.3. SWOT Analysis
- 11.2.14.4. Recent Developments
- 11.2.14.5. Financials (Based on Availability)
- 11.2.15 Genscript
- 11.2.15.1. Overview
- 11.2.15.2. Products
- 11.2.15.3. SWOT Analysis
- 11.2.15.4. Recent Developments
- 11.2.15.5. Financials (Based on Availability)
- 11.2.16 Marvelgent Biosciences
- 11.2.16.1. Overview
- 11.2.16.2. Products
- 11.2.16.3. SWOT Analysis
- 11.2.16.4. Recent Developments
- 11.2.16.5. Financials (Based on Availability)
- 11.2.17 Kaneka
- 11.2.17.1. Overview
- 11.2.17.2. Products
- 11.2.17.3. SWOT Analysis
- 11.2.17.4. Recent Developments
- 11.2.17.5. Financials (Based on Availability)
- 11.2.18 Suzhou NanoMicro Technology
- 11.2.18.1. Overview
- 11.2.18.2. Products
- 11.2.18.3. SWOT Analysis
- 11.2.18.4. Recent Developments
- 11.2.18.5. Financials (Based on Availability)
- 11.2.19 Guangzhou Jet Bio-Filtration
- 11.2.19.1. Overview
- 11.2.19.2. Products
- 11.2.19.3. SWOT Analysis
- 11.2.19.4. Recent Developments
- 11.2.19.5. Financials (Based on Availability)
- 11.2.20 Sepax Technologies
- 11.2.20.1. Overview
- 11.2.20.2. Products
- 11.2.20.3. SWOT Analysis
- 11.2.20.4. Recent Developments
- 11.2.20.5. Financials (Based on Availability)
- 11.2.21 Inc.
- 11.2.21.1. Overview
- 11.2.21.2. Products
- 11.2.21.3. SWOT Analysis
- 11.2.21.4. Recent Developments
- 11.2.21.5. Financials (Based on Availability)
- 11.2.22 Duoning Biotechnology Group
- 11.2.22.1. Overview
- 11.2.22.2. Products
- 11.2.22.3. SWOT Analysis
- 11.2.22.4. Recent Developments
- 11.2.22.5. Financials (Based on Availability)
- 11.2.1 GE Healthcare
List of Figures
- Figure 1: Global Antibody Purification Resin Revenue Breakdown (billion, %) by Region 2025 & 2033
- Figure 2: Global Antibody Purification Resin Volume Breakdown (K, %) by Region 2025 & 2033
- Figure 3: North America Antibody Purification Resin Revenue (billion), by Application 2025 & 2033
- Figure 4: North America Antibody Purification Resin Volume (K), by Application 2025 & 2033
- Figure 5: North America Antibody Purification Resin Revenue Share (%), by Application 2025 & 2033
- Figure 6: North America Antibody Purification Resin Volume Share (%), by Application 2025 & 2033
- Figure 7: North America Antibody Purification Resin Revenue (billion), by Types 2025 & 2033
- Figure 8: North America Antibody Purification Resin Volume (K), by Types 2025 & 2033
- Figure 9: North America Antibody Purification Resin Revenue Share (%), by Types 2025 & 2033
- Figure 10: North America Antibody Purification Resin Volume Share (%), by Types 2025 & 2033
- Figure 11: North America Antibody Purification Resin Revenue (billion), by Country 2025 & 2033
- Figure 12: North America Antibody Purification Resin Volume (K), by Country 2025 & 2033
- Figure 13: North America Antibody Purification Resin Revenue Share (%), by Country 2025 & 2033
- Figure 14: North America Antibody Purification Resin Volume Share (%), by Country 2025 & 2033
- Figure 15: South America Antibody Purification Resin Revenue (billion), by Application 2025 & 2033
- Figure 16: South America Antibody Purification Resin Volume (K), by Application 2025 & 2033
- Figure 17: South America Antibody Purification Resin Revenue Share (%), by Application 2025 & 2033
- Figure 18: South America Antibody Purification Resin Volume Share (%), by Application 2025 & 2033
- Figure 19: South America Antibody Purification Resin Revenue (billion), by Types 2025 & 2033
- Figure 20: South America Antibody Purification Resin Volume (K), by Types 2025 & 2033
- Figure 21: South America Antibody Purification Resin Revenue Share (%), by Types 2025 & 2033
- Figure 22: South America Antibody Purification Resin Volume Share (%), by Types 2025 & 2033
- Figure 23: South America Antibody Purification Resin Revenue (billion), by Country 2025 & 2033
- Figure 24: South America Antibody Purification Resin Volume (K), by Country 2025 & 2033
- Figure 25: South America Antibody Purification Resin Revenue Share (%), by Country 2025 & 2033
- Figure 26: South America Antibody Purification Resin Volume Share (%), by Country 2025 & 2033
- Figure 27: Europe Antibody Purification Resin Revenue (billion), by Application 2025 & 2033
- Figure 28: Europe Antibody Purification Resin Volume (K), by Application 2025 & 2033
- Figure 29: Europe Antibody Purification Resin Revenue Share (%), by Application 2025 & 2033
- Figure 30: Europe Antibody Purification Resin Volume Share (%), by Application 2025 & 2033
- Figure 31: Europe Antibody Purification Resin Revenue (billion), by Types 2025 & 2033
- Figure 32: Europe Antibody Purification Resin Volume (K), by Types 2025 & 2033
- Figure 33: Europe Antibody Purification Resin Revenue Share (%), by Types 2025 & 2033
- Figure 34: Europe Antibody Purification Resin Volume Share (%), by Types 2025 & 2033
- Figure 35: Europe Antibody Purification Resin Revenue (billion), by Country 2025 & 2033
- Figure 36: Europe Antibody Purification Resin Volume (K), by Country 2025 & 2033
- Figure 37: Europe Antibody Purification Resin Revenue Share (%), by Country 2025 & 2033
- Figure 38: Europe Antibody Purification Resin Volume Share (%), by Country 2025 & 2033
- Figure 39: Middle East & Africa Antibody Purification Resin Revenue (billion), by Application 2025 & 2033
- Figure 40: Middle East & Africa Antibody Purification Resin Volume (K), by Application 2025 & 2033
- Figure 41: Middle East & Africa Antibody Purification Resin Revenue Share (%), by Application 2025 & 2033
- Figure 42: Middle East & Africa Antibody Purification Resin Volume Share (%), by Application 2025 & 2033
- Figure 43: Middle East & Africa Antibody Purification Resin Revenue (billion), by Types 2025 & 2033
- Figure 44: Middle East & Africa Antibody Purification Resin Volume (K), by Types 2025 & 2033
- Figure 45: Middle East & Africa Antibody Purification Resin Revenue Share (%), by Types 2025 & 2033
- Figure 46: Middle East & Africa Antibody Purification Resin Volume Share (%), by Types 2025 & 2033
- Figure 47: Middle East & Africa Antibody Purification Resin Revenue (billion), by Country 2025 & 2033
- Figure 48: Middle East & Africa Antibody Purification Resin Volume (K), by Country 2025 & 2033
- Figure 49: Middle East & Africa Antibody Purification Resin Revenue Share (%), by Country 2025 & 2033
- Figure 50: Middle East & Africa Antibody Purification Resin Volume Share (%), by Country 2025 & 2033
- Figure 51: Asia Pacific Antibody Purification Resin Revenue (billion), by Application 2025 & 2033
- Figure 52: Asia Pacific Antibody Purification Resin Volume (K), by Application 2025 & 2033
- Figure 53: Asia Pacific Antibody Purification Resin Revenue Share (%), by Application 2025 & 2033
- Figure 54: Asia Pacific Antibody Purification Resin Volume Share (%), by Application 2025 & 2033
- Figure 55: Asia Pacific Antibody Purification Resin Revenue (billion), by Types 2025 & 2033
- Figure 56: Asia Pacific Antibody Purification Resin Volume (K), by Types 2025 & 2033
- Figure 57: Asia Pacific Antibody Purification Resin Revenue Share (%), by Types 2025 & 2033
- Figure 58: Asia Pacific Antibody Purification Resin Volume Share (%), by Types 2025 & 2033
- Figure 59: Asia Pacific Antibody Purification Resin Revenue (billion), by Country 2025 & 2033
- Figure 60: Asia Pacific Antibody Purification Resin Volume (K), by Country 2025 & 2033
- Figure 61: Asia Pacific Antibody Purification Resin Revenue Share (%), by Country 2025 & 2033
- Figure 62: Asia Pacific Antibody Purification Resin Volume Share (%), by Country 2025 & 2033
List of Tables
- Table 1: Global Antibody Purification Resin Revenue billion Forecast, by Application 2020 & 2033
- Table 2: Global Antibody Purification Resin Volume K Forecast, by Application 2020 & 2033
- Table 3: Global Antibody Purification Resin Revenue billion Forecast, by Types 2020 & 2033
- Table 4: Global Antibody Purification Resin Volume K Forecast, by Types 2020 & 2033
- Table 5: Global Antibody Purification Resin Revenue billion Forecast, by Region 2020 & 2033
- Table 6: Global Antibody Purification Resin Volume K Forecast, by Region 2020 & 2033
- Table 7: Global Antibody Purification Resin Revenue billion Forecast, by Application 2020 & 2033
- Table 8: Global Antibody Purification Resin Volume K Forecast, by Application 2020 & 2033
- Table 9: Global Antibody Purification Resin Revenue billion Forecast, by Types 2020 & 2033
- Table 10: Global Antibody Purification Resin Volume K Forecast, by Types 2020 & 2033
- Table 11: Global Antibody Purification Resin Revenue billion Forecast, by Country 2020 & 2033
- Table 12: Global Antibody Purification Resin Volume K Forecast, by Country 2020 & 2033
- Table 13: United States Antibody Purification Resin Revenue (billion) Forecast, by Application 2020 & 2033
- Table 14: United States Antibody Purification Resin Volume (K) Forecast, by Application 2020 & 2033
- Table 15: Canada Antibody Purification Resin Revenue (billion) Forecast, by Application 2020 & 2033
- Table 16: Canada Antibody Purification Resin Volume (K) Forecast, by Application 2020 & 2033
- Table 17: Mexico Antibody Purification Resin Revenue (billion) Forecast, by Application 2020 & 2033
- Table 18: Mexico Antibody Purification Resin Volume (K) Forecast, by Application 2020 & 2033
- Table 19: Global Antibody Purification Resin Revenue billion Forecast, by Application 2020 & 2033
- Table 20: Global Antibody Purification Resin Volume K Forecast, by Application 2020 & 2033
- Table 21: Global Antibody Purification Resin Revenue billion Forecast, by Types 2020 & 2033
- Table 22: Global Antibody Purification Resin Volume K Forecast, by Types 2020 & 2033
- Table 23: Global Antibody Purification Resin Revenue billion Forecast, by Country 2020 & 2033
- Table 24: Global Antibody Purification Resin Volume K Forecast, by Country 2020 & 2033
- Table 25: Brazil Antibody Purification Resin Revenue (billion) Forecast, by Application 2020 & 2033
- Table 26: Brazil Antibody Purification Resin Volume (K) Forecast, by Application 2020 & 2033
- Table 27: Argentina Antibody Purification Resin Revenue (billion) Forecast, by Application 2020 & 2033
- Table 28: Argentina Antibody Purification Resin Volume (K) Forecast, by Application 2020 & 2033
- Table 29: Rest of South America Antibody Purification Resin Revenue (billion) Forecast, by Application 2020 & 2033
- Table 30: Rest of South America Antibody Purification Resin Volume (K) Forecast, by Application 2020 & 2033
- Table 31: Global Antibody Purification Resin Revenue billion Forecast, by Application 2020 & 2033
- Table 32: Global Antibody Purification Resin Volume K Forecast, by Application 2020 & 2033
- Table 33: Global Antibody Purification Resin Revenue billion Forecast, by Types 2020 & 2033
- Table 34: Global Antibody Purification Resin Volume K Forecast, by Types 2020 & 2033
- Table 35: Global Antibody Purification Resin Revenue billion Forecast, by Country 2020 & 2033
- Table 36: Global Antibody Purification Resin Volume K Forecast, by Country 2020 & 2033
- Table 37: United Kingdom Antibody Purification Resin Revenue (billion) Forecast, by Application 2020 & 2033
- Table 38: United Kingdom Antibody Purification Resin Volume (K) Forecast, by Application 2020 & 2033
- Table 39: Germany Antibody Purification Resin Revenue (billion) Forecast, by Application 2020 & 2033
- Table 40: Germany Antibody Purification Resin Volume (K) Forecast, by Application 2020 & 2033
- Table 41: France Antibody Purification Resin Revenue (billion) Forecast, by Application 2020 & 2033
- Table 42: France Antibody Purification Resin Volume (K) Forecast, by Application 2020 & 2033
- Table 43: Italy Antibody Purification Resin Revenue (billion) Forecast, by Application 2020 & 2033
- Table 44: Italy Antibody Purification Resin Volume (K) Forecast, by Application 2020 & 2033
- Table 45: Spain Antibody Purification Resin Revenue (billion) Forecast, by Application 2020 & 2033
- Table 46: Spain Antibody Purification Resin Volume (K) Forecast, by Application 2020 & 2033
- Table 47: Russia Antibody Purification Resin Revenue (billion) Forecast, by Application 2020 & 2033
- Table 48: Russia Antibody Purification Resin Volume (K) Forecast, by Application 2020 & 2033
- Table 49: Benelux Antibody Purification Resin Revenue (billion) Forecast, by Application 2020 & 2033
- Table 50: Benelux Antibody Purification Resin Volume (K) Forecast, by Application 2020 & 2033
- Table 51: Nordics Antibody Purification Resin Revenue (billion) Forecast, by Application 2020 & 2033
- Table 52: Nordics Antibody Purification Resin Volume (K) Forecast, by Application 2020 & 2033
- Table 53: Rest of Europe Antibody Purification Resin Revenue (billion) Forecast, by Application 2020 & 2033
- Table 54: Rest of Europe Antibody Purification Resin Volume (K) Forecast, by Application 2020 & 2033
- Table 55: Global Antibody Purification Resin Revenue billion Forecast, by Application 2020 & 2033
- Table 56: Global Antibody Purification Resin Volume K Forecast, by Application 2020 & 2033
- Table 57: Global Antibody Purification Resin Revenue billion Forecast, by Types 2020 & 2033
- Table 58: Global Antibody Purification Resin Volume K Forecast, by Types 2020 & 2033
- Table 59: Global Antibody Purification Resin Revenue billion Forecast, by Country 2020 & 2033
- Table 60: Global Antibody Purification Resin Volume K Forecast, by Country 2020 & 2033
- Table 61: Turkey Antibody Purification Resin Revenue (billion) Forecast, by Application 2020 & 2033
- Table 62: Turkey Antibody Purification Resin Volume (K) Forecast, by Application 2020 & 2033
- Table 63: Israel Antibody Purification Resin Revenue (billion) Forecast, by Application 2020 & 2033
- Table 64: Israel Antibody Purification Resin Volume (K) Forecast, by Application 2020 & 2033
- Table 65: GCC Antibody Purification Resin Revenue (billion) Forecast, by Application 2020 & 2033
- Table 66: GCC Antibody Purification Resin Volume (K) Forecast, by Application 2020 & 2033
- Table 67: North Africa Antibody Purification Resin Revenue (billion) Forecast, by Application 2020 & 2033
- Table 68: North Africa Antibody Purification Resin Volume (K) Forecast, by Application 2020 & 2033
- Table 69: South Africa Antibody Purification Resin Revenue (billion) Forecast, by Application 2020 & 2033
- Table 70: South Africa Antibody Purification Resin Volume (K) Forecast, by Application 2020 & 2033
- Table 71: Rest of Middle East & Africa Antibody Purification Resin Revenue (billion) Forecast, by Application 2020 & 2033
- Table 72: Rest of Middle East & Africa Antibody Purification Resin Volume (K) Forecast, by Application 2020 & 2033
- Table 73: Global Antibody Purification Resin Revenue billion Forecast, by Application 2020 & 2033
- Table 74: Global Antibody Purification Resin Volume K Forecast, by Application 2020 & 2033
- Table 75: Global Antibody Purification Resin Revenue billion Forecast, by Types 2020 & 2033
- Table 76: Global Antibody Purification Resin Volume K Forecast, by Types 2020 & 2033
- Table 77: Global Antibody Purification Resin Revenue billion Forecast, by Country 2020 & 2033
- Table 78: Global Antibody Purification Resin Volume K Forecast, by Country 2020 & 2033
- Table 79: China Antibody Purification Resin Revenue (billion) Forecast, by Application 2020 & 2033
- Table 80: China Antibody Purification Resin Volume (K) Forecast, by Application 2020 & 2033
- Table 81: India Antibody Purification Resin Revenue (billion) Forecast, by Application 2020 & 2033
- Table 82: India Antibody Purification Resin Volume (K) Forecast, by Application 2020 & 2033
- Table 83: Japan Antibody Purification Resin Revenue (billion) Forecast, by Application 2020 & 2033
- Table 84: Japan Antibody Purification Resin Volume (K) Forecast, by Application 2020 & 2033
- Table 85: South Korea Antibody Purification Resin Revenue (billion) Forecast, by Application 2020 & 2033
- Table 86: South Korea Antibody Purification Resin Volume (K) Forecast, by Application 2020 & 2033
- Table 87: ASEAN Antibody Purification Resin Revenue (billion) Forecast, by Application 2020 & 2033
- Table 88: ASEAN Antibody Purification Resin Volume (K) Forecast, by Application 2020 & 2033
- Table 89: Oceania Antibody Purification Resin Revenue (billion) Forecast, by Application 2020 & 2033
- Table 90: Oceania Antibody Purification Resin Volume (K) Forecast, by Application 2020 & 2033
- Table 91: Rest of Asia Pacific Antibody Purification Resin Revenue (billion) Forecast, by Application 2020 & 2033
- Table 92: Rest of Asia Pacific Antibody Purification Resin Volume (K) Forecast, by Application 2020 & 2033
Frequently Asked Questions
1. What is the projected Compound Annual Growth Rate (CAGR) of the Antibody Purification Resin?
The projected CAGR is approximately 5.62%.
2. Which companies are prominent players in the Antibody Purification Resin?
Key companies in the market include GE Healthcare, Thermo Fisher Scientifc, Merck, Cytiva, Danaher, Tosoh Bioscience, Abcam, MBL (JSR), Agilent, Perkin Elmer, Takara, Purolite, Bio-Rad Laboratories, Novasep Holdings, Genscript, Marvelgent Biosciences, Kaneka, Suzhou NanoMicro Technology, Guangzhou Jet Bio-Filtration, Sepax Technologies, Inc., Duoning Biotechnology Group.
3. What are the main segments of the Antibody Purification Resin?
The market segments include Application, Types.
4. Can you provide details about the market size?
The market size is estimated to be USD 1.67 billion as of 2022.
5. What are some drivers contributing to market growth?
N/A
6. What are the notable trends driving market growth?
N/A
7. Are there any restraints impacting market growth?
N/A
8. Can you provide examples of recent developments in the market?
N/A
9. What pricing options are available for accessing the report?
Pricing options include single-user, multi-user, and enterprise licenses priced at USD 3950.00, USD 5925.00, and USD 7900.00 respectively.
10. Is the market size provided in terms of value or volume?
The market size is provided in terms of value, measured in billion and volume, measured in K.
11. Are there any specific market keywords associated with the report?
Yes, the market keyword associated with the report is "Antibody Purification Resin," which aids in identifying and referencing the specific market segment covered.
12. How do I determine which pricing option suits my needs best?
The pricing options vary based on user requirements and access needs. Individual users may opt for single-user licenses, while businesses requiring broader access may choose multi-user or enterprise licenses for cost-effective access to the report.
13. Are there any additional resources or data provided in the Antibody Purification Resin report?
While the report offers comprehensive insights, it's advisable to review the specific contents or supplementary materials provided to ascertain if additional resources or data are available.
14. How can I stay updated on further developments or reports in the Antibody Purification Resin?
To stay informed about further developments, trends, and reports in the Antibody Purification Resin, consider subscribing to industry newsletters, following relevant companies and organizations, or regularly checking reputable industry news sources and publications.
Methodology
Step 1 - Identification of Relevant Samples Size from Population Database


Step 2 - Approaches for Defining Global Market Size (Value, Volume* & Price*)

Note*: In applicable scenarios
Step 3 - Data Sources
Primary Research
- Web Analytics
- Survey Reports
- Research Institute
- Latest Research Reports
- Opinion Leaders
Secondary Research
- Annual Reports
- White Paper
- Latest Press Release
- Industry Association
- Paid Database
- Investor Presentations

Step 4 - Data Triangulation
Involves using different sources of information in order to increase the validity of a study
These sources are likely to be stakeholders in a program - participants, other researchers, program staff, other community members, and so on.
Then we put all data in single framework & apply various statistical tools to find out the dynamic on the market.
During the analysis stage, feedback from the stakeholder groups would be compared to determine areas of agreement as well as areas of divergence