

Key Insights
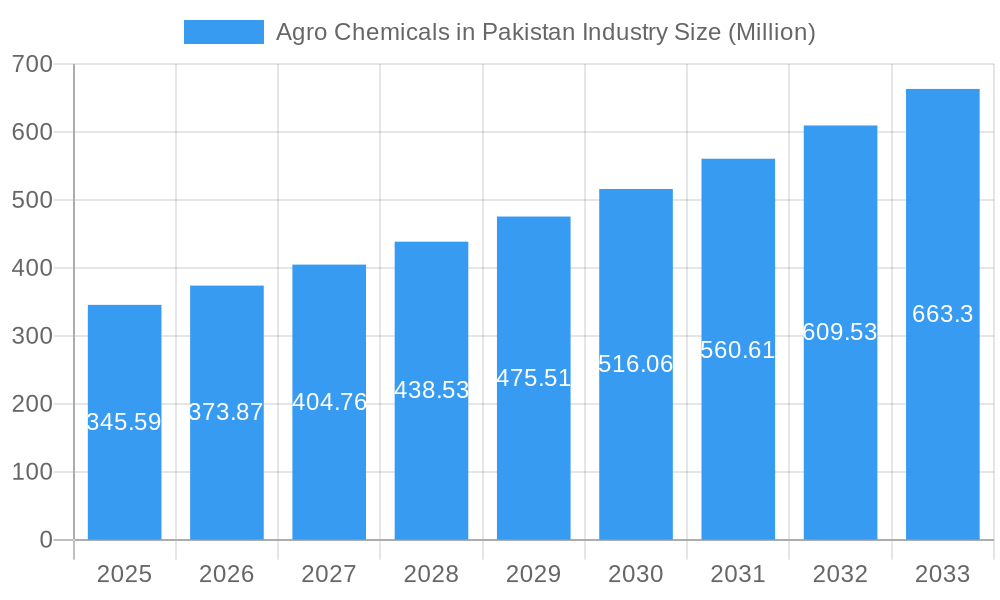
The Pakistan agrochemicals market, valued at $345.59 million in 2025, is projected to experience robust growth, driven by a rising population, increasing demand for food security, and the expanding cultivation of high-value crops like fruits and vegetables. A Compound Annual Growth Rate (CAGR) of 7.99% is anticipated from 2025 to 2033, indicating a significant market expansion. This growth is fueled by factors such as government initiatives promoting agricultural modernization, increased farmer awareness of improved crop yields through chemical inputs, and the adoption of advanced farming techniques. The segments within the market—fertilizers, pesticides, adjuvants, and plant growth regulators—all contribute to this growth, with fertilizers likely holding the largest market share due to their fundamental role in crop production. Application-wise, grains and cereals, along with pulses and oilseeds, are expected to remain major consumers of agrochemicals, though the fruits and vegetables segment is poised for considerable growth given its increasing economic importance. However, challenges such as fluctuating climatic conditions, environmental concerns regarding pesticide use, and the potential for price volatility in raw materials could act as restraints to some extent. Key players like Syngenta, BASF SE, Bayer AG, and local companies such as Welcon Chemicals Pvt Ltd and Pakistan Agro Chemicals Pvt Ltd, are competing to meet the growing demand, leading to increased investment in research and development and the introduction of more efficient and sustainable products.
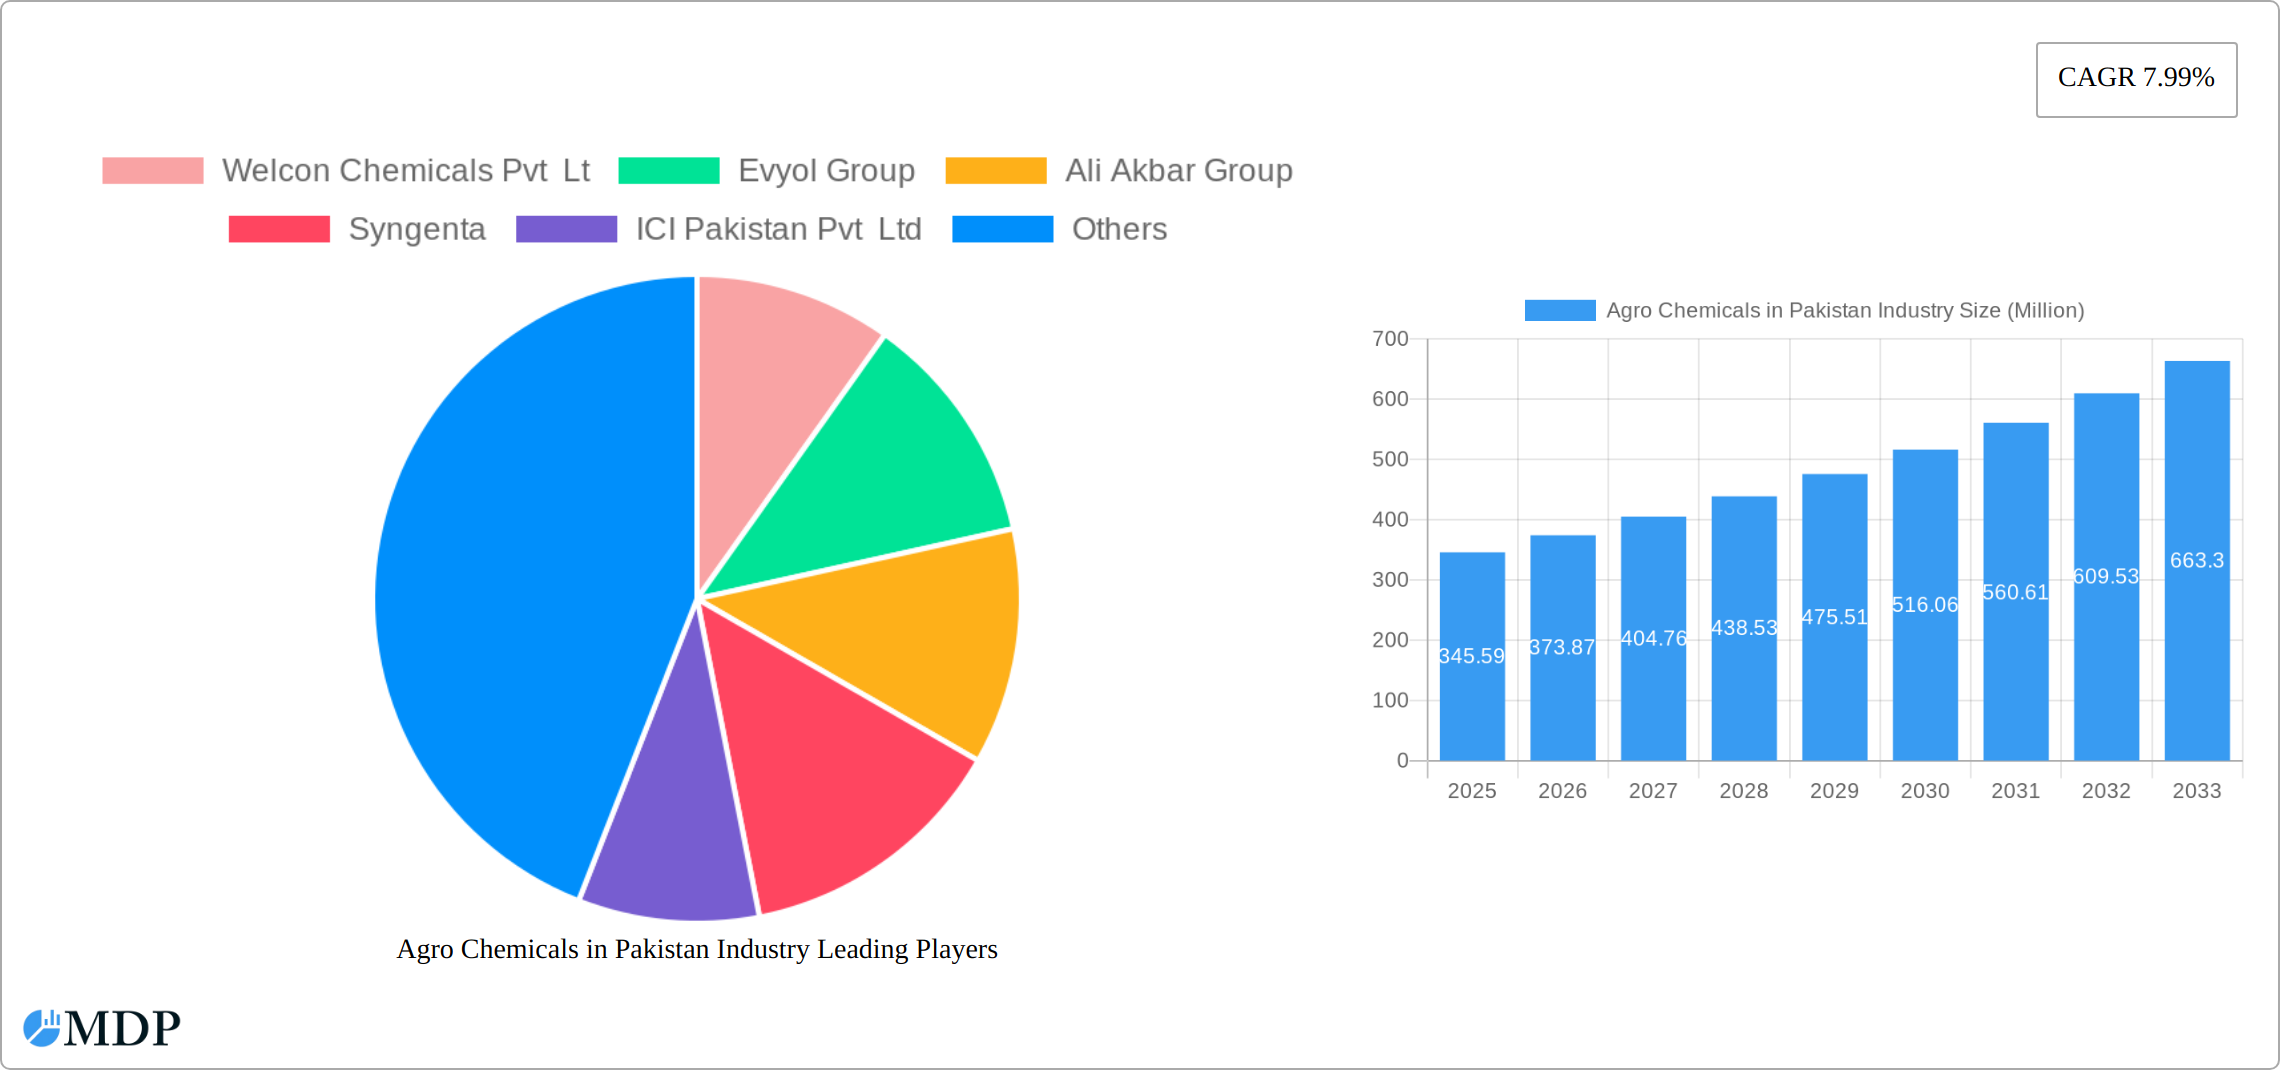
Agro Chemicals in Pakistan Industry Market Size (In Million)
The competitive landscape includes both multinational corporations with advanced technologies and established local players deeply entrenched in the Pakistani agricultural sector. Multinational companies benefit from brand recognition and access to advanced technologies, while local companies possess a strong understanding of local market needs and distribution networks. The market is characterized by both organized and unorganized sectors, with the organized sector gradually gaining market share due to its focus on quality control, regulatory compliance, and the introduction of novel and sustainable solutions. Future growth will depend on factors such as government policies promoting sustainable agriculture, farmer education, and the availability of credit facilities for smallholder farmers. The rising awareness regarding environmental concerns will likely spur the development and adoption of biopesticides and other eco-friendly agrochemicals, shaping the future trajectory of this vibrant market.
Agro Chemicals in Pakistan Industry Company Market Share
Agro Chemicals in Pakistan Industry: A Comprehensive Market Report (2019-2033)
This in-depth report provides a comprehensive analysis of the Agro Chemicals market in Pakistan, covering the period 2019-2033. It offers invaluable insights into market dynamics, leading players, emerging trends, and future growth opportunities for stakeholders across the entire value chain. The report leverages extensive data analysis and expert insights to present a clear and actionable strategic roadmap for success in this dynamic market. Download now to gain a competitive edge!
Agro Chemicals in Pakistan Industry Market Dynamics & Concentration
Pakistan's agrochemical market, valued at [Insert Updated Value in Million] in 2024, presents a moderately concentrated landscape. Multinational corporations (MNCs) and domestic companies compete fiercely for market share. This concentration is shaped by operational scale, diversified product portfolios, and robust distribution networks. Major players like Syngenta and BASF SE command substantial market shares. However, smaller, specialized firms are thriving, particularly in niche segments. Innovation is paramount, with continuous development of novel formulations and technologies addressing evolving pest and disease challenges and boosting crop yields. The regulatory environment, while dynamic, significantly influences product registration and import/export activities. A growing trend is the increased adoption of biopesticides and biofertilizers, fueled by escalating environmental concerns. Furthermore, a gradual shift towards product substitution is evident as integrated pest management (IPM) strategies gain traction among farmers. End-user trends are influenced by factors such as farmer awareness levels, affordability, and access to crucial information. While mergers and acquisitions (M&A) activity has been relatively moderate in recent years, strategic partnerships are gaining prominence.
- Market Share: Syngenta and BASF SE hold approximately [Insert Updated Percentage]% and [Insert Updated Percentage]% market share respectively. Other players comprise the remaining market share. [Consider adding a brief explanation of the other key players and their approximate market share if data is available]
- M&A Deal Counts: [Insert Updated Number] deals were recorded between 2019-2024, with a notable increase in strategic partnerships. [Add details about the nature of these partnerships if available]
Agro Chemicals in Pakistan Industry Industry Trends & Analysis
The Pakistani agrochemical market exhibits robust growth, primarily driven by escalating agricultural output, rising demand for high-yielding crops, and government initiatives focused on enhancing agricultural productivity. The Compound Annual Growth Rate (CAGR) is projected at [Insert Updated CAGR]% during the forecast period (2025-2033), reaching [Insert Updated Value in Million] by 2033. Technological advancements, such as precision agriculture techniques and drone-based applications, are transforming the industry, enabling targeted pesticide application and minimizing environmental impact. Consumer preferences are increasingly shifting towards sustainable and eco-friendly products, stimulating demand for biopesticides and biofertilizers. The competitive landscape remains intense, with both domestic and multinational players vying for dominance. Market penetration of advanced technologies and high-value products remains relatively low, presenting substantial opportunities for future growth. [Consider adding a sentence or two on the impact of climate change on the industry and its adaptation strategies]
Leading Markets & Segments in Agro Chemicals in Pakistan Industry
While comprehensive regional data remains limited, the national market is the primary focus. The largest segments by type are fertilizers ([Insert Updated Value in Million]), followed by pesticides ([Insert Updated Value in Million]), and then adjuvants and plant growth regulators. In terms of application, grains and cereals dominate, with pulses and oilseeds holding significant importance. The fruits and vegetables sector represents a noteworthy and expanding market segment.
Key Drivers for Grains and Cereals Dominance:
- Extensive cultivated area dedicated to grains and cereals.
- Government subsidies and support programs bolstering production.
- High demand driven by national food security concerns.
Key Drivers for Pulses and Oilseeds Growth:
- Increasing domestic consumption of pulses and oilseeds.
- Growing export demand for these commodities, enhancing market opportunities.
- Improved agricultural practices resulting in higher yields and increased profitability.
Agro Chemicals in Pakistan Industry Product Developments
Recent years have seen significant product innovation, with a focus on developing more effective, targeted, and environmentally friendly agrochemicals. This includes the introduction of novel insecticides such as Sefina, along with the growing availability of biopesticides. Companies are actively investing in research and development to enhance product efficacy, reduce environmental impact, and meet evolving farmer needs. Technological advancements in formulation and delivery systems are improving application efficiency and reducing drift.
Key Drivers of Agro Chemicals in Pakistan Industry Growth
The growth of the Pakistani agrochemical market is fueled by several key factors. Firstly, the increasing demand for food due to a growing population creates strong demand for higher crop yields. Secondly, government initiatives aimed at boosting agricultural productivity, including subsidies and extension services, have played a vital role. Thirdly, advancements in agricultural technologies are boosting yields and efficiency, increasing the need for specialized agrochemicals.
Challenges in the Agro Chemicals in Pakistan Industry Market
The Pakistani agrochemical industry faces several challenges. Stricter environmental regulations necessitate compliance, posing financial burdens. Supply chain disruptions caused by various factors have impacted product availability and cost. Intense competition amongst domestic and multinational players requires continuous innovation and cost optimization. Counterfeit products also present a significant challenge to market integrity.
Emerging Opportunities in Agro Chemicals in Pakistan Industry
Several opportunities exist for growth in this market. The increasing adoption of precision agriculture and digital technologies presents opportunities for the development and marketing of smart solutions. Strategic partnerships and collaborations can unlock access to advanced technologies and expertise. Expanding into high-growth segments, such as fruits and vegetables, offers promising avenues for expansion.
Leading Players in the Agro Chemicals in Pakistan Industry Sector
- Welcon Chemicals Pvt Lt
- Evyol Group
- Ali Akbar Group
- Syngenta
- ICI Pakistan Pvt Ltd
- BASF SE
- FMC Corporation
- Pakistan Agro Chemicals Pvt Ltd
- Bayer Ag
Key Milestones in Agro Chemicals in Pakistan Industry Industry
- February 2023: Bayer's partnership with Kimitec signifies a notable shift towards biological crop protection solutions, reflecting a growing industry trend.
- February 2021: The launch of Sefina insecticide by BASF and Engro Fertilizers showcases significant innovation in pest control technology.
- January 2021: The introduction of HANARO, a new whitefly management solution, highlights ongoing efforts to address specific and critical crop challenges.
- [Add more recent milestones if available, maintaining the same format]
Strategic Outlook for Agro Chemicals in Pakistan Industry Market
The future of Pakistan's agrochemical market appears promising, driven by a burgeoning population and escalating food demand. Strategic investments in research and development (R&D), embracing sustainable agricultural practices, and forging strategic partnerships will be critical for success. A focus on high-value products and technological advancements will unlock significant market potential. The market offers considerable opportunities for established players and new entrants alike, provided they demonstrate a commitment to innovation and adapt effectively to the dynamic market needs. [Consider adding a sentence or two about potential challenges, such as climate change adaptation, regulatory hurdles, or supply chain issues.]
Agro Chemicals in Pakistan Industry Segmentation
- 1. Production Analysis
- 2. Consumption Analysis
- 3. Import Market Analysis (Value & Volume)
- 4. Export Market Analysis (Value & Volume)
- 5. Price Trend Analysis
Agro Chemicals in Pakistan Industry Segmentation By Geography
-
1. North America
- 1.1. United States
- 1.2. Canada
- 1.3. Mexico
-
2. South America
- 2.1. Brazil
- 2.2. Argentina
- 2.3. Rest of South America
-
3. Europe
- 3.1. United Kingdom
- 3.2. Germany
- 3.3. France
- 3.4. Italy
- 3.5. Spain
- 3.6. Russia
- 3.7. Benelux
- 3.8. Nordics
- 3.9. Rest of Europe
-
4. Middle East & Africa
- 4.1. Turkey
- 4.2. Israel
- 4.3. GCC
- 4.4. North Africa
- 4.5. South Africa
- 4.6. Rest of Middle East & Africa
-
5. Asia Pacific
- 5.1. China
- 5.2. India
- 5.3. Japan
- 5.4. South Korea
- 5.5. ASEAN
- 5.6. Oceania
- 5.7. Rest of Asia Pacific
Agro Chemicals in Pakistan Industry Regional Market Share
Geographic Coverage of Agro Chemicals in Pakistan Industry
Agro Chemicals in Pakistan Industry REPORT HIGHLIGHTS
| Aspects | Details |
|---|---|
| Study Period | 2020-2034 |
| Base Year | 2025 |
| Estimated Year | 2026 |
| Forecast Period | 2026-2034 |
| Historical Period | 2020-2025 |
| Growth Rate | CAGR of 7.99% from 2020-2034 |
| Segmentation |
|
Table of Contents
- 1. Introduction
- 1.1. Research Scope
- 1.2. Market Segmentation
- 1.3. Research Methodology
- 1.4. Definitions and Assumptions
- 2. Executive Summary
- 2.1. Introduction
- 3. Market Dynamics
- 3.1. Introduction
- 3.2. Market Drivers
- 3.2.1. Increasing Berry Consumption for Health Benefits; Increasing Adoption of High-Technology Farm Practices; Growing Usage of Berries in the Food and Beverage Industries
- 3.3. Market Restrains
- 3.3.1. High Production Cost Involved in Berry Production; Increasing Disease and Pest Infestations
- 3.4. Market Trends
- 3.4.1. Need for Increased Land Productivity
- 4. Market Factor Analysis
- 4.1. Porters Five Forces
- 4.2. Supply/Value Chain
- 4.3. PESTEL analysis
- 4.4. Market Entropy
- 4.5. Patent/Trademark Analysis
- 5. Global Agro Chemicals in Pakistan Industry Analysis, Insights and Forecast, 2020-2032
- 5.1. Market Analysis, Insights and Forecast - by Production Analysis
- 5.2. Market Analysis, Insights and Forecast - by Consumption Analysis
- 5.3. Market Analysis, Insights and Forecast - by Import Market Analysis (Value & Volume)
- 5.4. Market Analysis, Insights and Forecast - by Export Market Analysis (Value & Volume)
- 5.5. Market Analysis, Insights and Forecast - by Price Trend Analysis
- 5.6. Market Analysis, Insights and Forecast - by Region
- 5.6.1. North America
- 5.6.2. South America
- 5.6.3. Europe
- 5.6.4. Middle East & Africa
- 5.6.5. Asia Pacific
- 5.1. Market Analysis, Insights and Forecast - by Production Analysis
- 6. North America Agro Chemicals in Pakistan Industry Analysis, Insights and Forecast, 2020-2032
- 6.1. Market Analysis, Insights and Forecast - by Production Analysis
- 6.2. Market Analysis, Insights and Forecast - by Consumption Analysis
- 6.3. Market Analysis, Insights and Forecast - by Import Market Analysis (Value & Volume)
- 6.4. Market Analysis, Insights and Forecast - by Export Market Analysis (Value & Volume)
- 6.5. Market Analysis, Insights and Forecast - by Price Trend Analysis
- 6.1. Market Analysis, Insights and Forecast - by Production Analysis
- 7. South America Agro Chemicals in Pakistan Industry Analysis, Insights and Forecast, 2020-2032
- 7.1. Market Analysis, Insights and Forecast - by Production Analysis
- 7.2. Market Analysis, Insights and Forecast - by Consumption Analysis
- 7.3. Market Analysis, Insights and Forecast - by Import Market Analysis (Value & Volume)
- 7.4. Market Analysis, Insights and Forecast - by Export Market Analysis (Value & Volume)
- 7.5. Market Analysis, Insights and Forecast - by Price Trend Analysis
- 7.1. Market Analysis, Insights and Forecast - by Production Analysis
- 8. Europe Agro Chemicals in Pakistan Industry Analysis, Insights and Forecast, 2020-2032
- 8.1. Market Analysis, Insights and Forecast - by Production Analysis
- 8.2. Market Analysis, Insights and Forecast - by Consumption Analysis
- 8.3. Market Analysis, Insights and Forecast - by Import Market Analysis (Value & Volume)
- 8.4. Market Analysis, Insights and Forecast - by Export Market Analysis (Value & Volume)
- 8.5. Market Analysis, Insights and Forecast - by Price Trend Analysis
- 8.1. Market Analysis, Insights and Forecast - by Production Analysis
- 9. Middle East & Africa Agro Chemicals in Pakistan Industry Analysis, Insights and Forecast, 2020-2032
- 9.1. Market Analysis, Insights and Forecast - by Production Analysis
- 9.2. Market Analysis, Insights and Forecast - by Consumption Analysis
- 9.3. Market Analysis, Insights and Forecast - by Import Market Analysis (Value & Volume)
- 9.4. Market Analysis, Insights and Forecast - by Export Market Analysis (Value & Volume)
- 9.5. Market Analysis, Insights and Forecast - by Price Trend Analysis
- 9.1. Market Analysis, Insights and Forecast - by Production Analysis
- 10. Asia Pacific Agro Chemicals in Pakistan Industry Analysis, Insights and Forecast, 2020-2032
- 10.1. Market Analysis, Insights and Forecast - by Production Analysis
- 10.2. Market Analysis, Insights and Forecast - by Consumption Analysis
- 10.3. Market Analysis, Insights and Forecast - by Import Market Analysis (Value & Volume)
- 10.4. Market Analysis, Insights and Forecast - by Export Market Analysis (Value & Volume)
- 10.5. Market Analysis, Insights and Forecast - by Price Trend Analysis
- 10.1. Market Analysis, Insights and Forecast - by Production Analysis
- 11. Competitive Analysis
- 11.1. Global Market Share Analysis 2025
- 11.2. Company Profiles
- 11.2.1 Welcon Chemicals Pvt Lt
- 11.2.1.1. Overview
- 11.2.1.2. Products
- 11.2.1.3. SWOT Analysis
- 11.2.1.4. Recent Developments
- 11.2.1.5. Financials (Based on Availability)
- 11.2.2 Evyol Group
- 11.2.2.1. Overview
- 11.2.2.2. Products
- 11.2.2.3. SWOT Analysis
- 11.2.2.4. Recent Developments
- 11.2.2.5. Financials (Based on Availability)
- 11.2.3 Ali Akbar Group
- 11.2.3.1. Overview
- 11.2.3.2. Products
- 11.2.3.3. SWOT Analysis
- 11.2.3.4. Recent Developments
- 11.2.3.5. Financials (Based on Availability)
- 11.2.4 Syngenta
- 11.2.4.1. Overview
- 11.2.4.2. Products
- 11.2.4.3. SWOT Analysis
- 11.2.4.4. Recent Developments
- 11.2.4.5. Financials (Based on Availability)
- 11.2.5 ICI Pakistan Pvt Ltd
- 11.2.5.1. Overview
- 11.2.5.2. Products
- 11.2.5.3. SWOT Analysis
- 11.2.5.4. Recent Developments
- 11.2.5.5. Financials (Based on Availability)
- 11.2.6 BASF SE
- 11.2.6.1. Overview
- 11.2.6.2. Products
- 11.2.6.3. SWOT Analysis
- 11.2.6.4. Recent Developments
- 11.2.6.5. Financials (Based on Availability)
- 11.2.7 FMC Corporation
- 11.2.7.1. Overview
- 11.2.7.2. Products
- 11.2.7.3. SWOT Analysis
- 11.2.7.4. Recent Developments
- 11.2.7.5. Financials (Based on Availability)
- 11.2.8 Pakistan Agro Chemicals Pvt Ltd
- 11.2.8.1. Overview
- 11.2.8.2. Products
- 11.2.8.3. SWOT Analysis
- 11.2.8.4. Recent Developments
- 11.2.8.5. Financials (Based on Availability)
- 11.2.9 Bayer Ag
- 11.2.9.1. Overview
- 11.2.9.2. Products
- 11.2.9.3. SWOT Analysis
- 11.2.9.4. Recent Developments
- 11.2.9.5. Financials (Based on Availability)
- 11.2.1 Welcon Chemicals Pvt Lt
List of Figures
- Figure 1: Global Agro Chemicals in Pakistan Industry Revenue Breakdown (Million, %) by Region 2025 & 2033
- Figure 2: North America Agro Chemicals in Pakistan Industry Revenue (Million), by Production Analysis 2025 & 2033
- Figure 3: North America Agro Chemicals in Pakistan Industry Revenue Share (%), by Production Analysis 2025 & 2033
- Figure 4: North America Agro Chemicals in Pakistan Industry Revenue (Million), by Consumption Analysis 2025 & 2033
- Figure 5: North America Agro Chemicals in Pakistan Industry Revenue Share (%), by Consumption Analysis 2025 & 2033
- Figure 6: North America Agro Chemicals in Pakistan Industry Revenue (Million), by Import Market Analysis (Value & Volume) 2025 & 2033
- Figure 7: North America Agro Chemicals in Pakistan Industry Revenue Share (%), by Import Market Analysis (Value & Volume) 2025 & 2033
- Figure 8: North America Agro Chemicals in Pakistan Industry Revenue (Million), by Export Market Analysis (Value & Volume) 2025 & 2033
- Figure 9: North America Agro Chemicals in Pakistan Industry Revenue Share (%), by Export Market Analysis (Value & Volume) 2025 & 2033
- Figure 10: North America Agro Chemicals in Pakistan Industry Revenue (Million), by Price Trend Analysis 2025 & 2033
- Figure 11: North America Agro Chemicals in Pakistan Industry Revenue Share (%), by Price Trend Analysis 2025 & 2033
- Figure 12: North America Agro Chemicals in Pakistan Industry Revenue (Million), by Country 2025 & 2033
- Figure 13: North America Agro Chemicals in Pakistan Industry Revenue Share (%), by Country 2025 & 2033
- Figure 14: South America Agro Chemicals in Pakistan Industry Revenue (Million), by Production Analysis 2025 & 2033
- Figure 15: South America Agro Chemicals in Pakistan Industry Revenue Share (%), by Production Analysis 2025 & 2033
- Figure 16: South America Agro Chemicals in Pakistan Industry Revenue (Million), by Consumption Analysis 2025 & 2033
- Figure 17: South America Agro Chemicals in Pakistan Industry Revenue Share (%), by Consumption Analysis 2025 & 2033
- Figure 18: South America Agro Chemicals in Pakistan Industry Revenue (Million), by Import Market Analysis (Value & Volume) 2025 & 2033
- Figure 19: South America Agro Chemicals in Pakistan Industry Revenue Share (%), by Import Market Analysis (Value & Volume) 2025 & 2033
- Figure 20: South America Agro Chemicals in Pakistan Industry Revenue (Million), by Export Market Analysis (Value & Volume) 2025 & 2033
- Figure 21: South America Agro Chemicals in Pakistan Industry Revenue Share (%), by Export Market Analysis (Value & Volume) 2025 & 2033
- Figure 22: South America Agro Chemicals in Pakistan Industry Revenue (Million), by Price Trend Analysis 2025 & 2033
- Figure 23: South America Agro Chemicals in Pakistan Industry Revenue Share (%), by Price Trend Analysis 2025 & 2033
- Figure 24: South America Agro Chemicals in Pakistan Industry Revenue (Million), by Country 2025 & 2033
- Figure 25: South America Agro Chemicals in Pakistan Industry Revenue Share (%), by Country 2025 & 2033
- Figure 26: Europe Agro Chemicals in Pakistan Industry Revenue (Million), by Production Analysis 2025 & 2033
- Figure 27: Europe Agro Chemicals in Pakistan Industry Revenue Share (%), by Production Analysis 2025 & 2033
- Figure 28: Europe Agro Chemicals in Pakistan Industry Revenue (Million), by Consumption Analysis 2025 & 2033
- Figure 29: Europe Agro Chemicals in Pakistan Industry Revenue Share (%), by Consumption Analysis 2025 & 2033
- Figure 30: Europe Agro Chemicals in Pakistan Industry Revenue (Million), by Import Market Analysis (Value & Volume) 2025 & 2033
- Figure 31: Europe Agro Chemicals in Pakistan Industry Revenue Share (%), by Import Market Analysis (Value & Volume) 2025 & 2033
- Figure 32: Europe Agro Chemicals in Pakistan Industry Revenue (Million), by Export Market Analysis (Value & Volume) 2025 & 2033
- Figure 33: Europe Agro Chemicals in Pakistan Industry Revenue Share (%), by Export Market Analysis (Value & Volume) 2025 & 2033
- Figure 34: Europe Agro Chemicals in Pakistan Industry Revenue (Million), by Price Trend Analysis 2025 & 2033
- Figure 35: Europe Agro Chemicals in Pakistan Industry Revenue Share (%), by Price Trend Analysis 2025 & 2033
- Figure 36: Europe Agro Chemicals in Pakistan Industry Revenue (Million), by Country 2025 & 2033
- Figure 37: Europe Agro Chemicals in Pakistan Industry Revenue Share (%), by Country 2025 & 2033
- Figure 38: Middle East & Africa Agro Chemicals in Pakistan Industry Revenue (Million), by Production Analysis 2025 & 2033
- Figure 39: Middle East & Africa Agro Chemicals in Pakistan Industry Revenue Share (%), by Production Analysis 2025 & 2033
- Figure 40: Middle East & Africa Agro Chemicals in Pakistan Industry Revenue (Million), by Consumption Analysis 2025 & 2033
- Figure 41: Middle East & Africa Agro Chemicals in Pakistan Industry Revenue Share (%), by Consumption Analysis 2025 & 2033
- Figure 42: Middle East & Africa Agro Chemicals in Pakistan Industry Revenue (Million), by Import Market Analysis (Value & Volume) 2025 & 2033
- Figure 43: Middle East & Africa Agro Chemicals in Pakistan Industry Revenue Share (%), by Import Market Analysis (Value & Volume) 2025 & 2033
- Figure 44: Middle East & Africa Agro Chemicals in Pakistan Industry Revenue (Million), by Export Market Analysis (Value & Volume) 2025 & 2033
- Figure 45: Middle East & Africa Agro Chemicals in Pakistan Industry Revenue Share (%), by Export Market Analysis (Value & Volume) 2025 & 2033
- Figure 46: Middle East & Africa Agro Chemicals in Pakistan Industry Revenue (Million), by Price Trend Analysis 2025 & 2033
- Figure 47: Middle East & Africa Agro Chemicals in Pakistan Industry Revenue Share (%), by Price Trend Analysis 2025 & 2033
- Figure 48: Middle East & Africa Agro Chemicals in Pakistan Industry Revenue (Million), by Country 2025 & 2033
- Figure 49: Middle East & Africa Agro Chemicals in Pakistan Industry Revenue Share (%), by Country 2025 & 2033
- Figure 50: Asia Pacific Agro Chemicals in Pakistan Industry Revenue (Million), by Production Analysis 2025 & 2033
- Figure 51: Asia Pacific Agro Chemicals in Pakistan Industry Revenue Share (%), by Production Analysis 2025 & 2033
- Figure 52: Asia Pacific Agro Chemicals in Pakistan Industry Revenue (Million), by Consumption Analysis 2025 & 2033
- Figure 53: Asia Pacific Agro Chemicals in Pakistan Industry Revenue Share (%), by Consumption Analysis 2025 & 2033
- Figure 54: Asia Pacific Agro Chemicals in Pakistan Industry Revenue (Million), by Import Market Analysis (Value & Volume) 2025 & 2033
- Figure 55: Asia Pacific Agro Chemicals in Pakistan Industry Revenue Share (%), by Import Market Analysis (Value & Volume) 2025 & 2033
- Figure 56: Asia Pacific Agro Chemicals in Pakistan Industry Revenue (Million), by Export Market Analysis (Value & Volume) 2025 & 2033
- Figure 57: Asia Pacific Agro Chemicals in Pakistan Industry Revenue Share (%), by Export Market Analysis (Value & Volume) 2025 & 2033
- Figure 58: Asia Pacific Agro Chemicals in Pakistan Industry Revenue (Million), by Price Trend Analysis 2025 & 2033
- Figure 59: Asia Pacific Agro Chemicals in Pakistan Industry Revenue Share (%), by Price Trend Analysis 2025 & 2033
- Figure 60: Asia Pacific Agro Chemicals in Pakistan Industry Revenue (Million), by Country 2025 & 2033
- Figure 61: Asia Pacific Agro Chemicals in Pakistan Industry Revenue Share (%), by Country 2025 & 2033
List of Tables
- Table 1: Global Agro Chemicals in Pakistan Industry Revenue Million Forecast, by Production Analysis 2020 & 2033
- Table 2: Global Agro Chemicals in Pakistan Industry Revenue Million Forecast, by Consumption Analysis 2020 & 2033
- Table 3: Global Agro Chemicals in Pakistan Industry Revenue Million Forecast, by Import Market Analysis (Value & Volume) 2020 & 2033
- Table 4: Global Agro Chemicals in Pakistan Industry Revenue Million Forecast, by Export Market Analysis (Value & Volume) 2020 & 2033
- Table 5: Global Agro Chemicals in Pakistan Industry Revenue Million Forecast, by Price Trend Analysis 2020 & 2033
- Table 6: Global Agro Chemicals in Pakistan Industry Revenue Million Forecast, by Region 2020 & 2033
- Table 7: Global Agro Chemicals in Pakistan Industry Revenue Million Forecast, by Production Analysis 2020 & 2033
- Table 8: Global Agro Chemicals in Pakistan Industry Revenue Million Forecast, by Consumption Analysis 2020 & 2033
- Table 9: Global Agro Chemicals in Pakistan Industry Revenue Million Forecast, by Import Market Analysis (Value & Volume) 2020 & 2033
- Table 10: Global Agro Chemicals in Pakistan Industry Revenue Million Forecast, by Export Market Analysis (Value & Volume) 2020 & 2033
- Table 11: Global Agro Chemicals in Pakistan Industry Revenue Million Forecast, by Price Trend Analysis 2020 & 2033
- Table 12: Global Agro Chemicals in Pakistan Industry Revenue Million Forecast, by Country 2020 & 2033
- Table 13: United States Agro Chemicals in Pakistan Industry Revenue (Million) Forecast, by Application 2020 & 2033
- Table 14: Canada Agro Chemicals in Pakistan Industry Revenue (Million) Forecast, by Application 2020 & 2033
- Table 15: Mexico Agro Chemicals in Pakistan Industry Revenue (Million) Forecast, by Application 2020 & 2033
- Table 16: Global Agro Chemicals in Pakistan Industry Revenue Million Forecast, by Production Analysis 2020 & 2033
- Table 17: Global Agro Chemicals in Pakistan Industry Revenue Million Forecast, by Consumption Analysis 2020 & 2033
- Table 18: Global Agro Chemicals in Pakistan Industry Revenue Million Forecast, by Import Market Analysis (Value & Volume) 2020 & 2033
- Table 19: Global Agro Chemicals in Pakistan Industry Revenue Million Forecast, by Export Market Analysis (Value & Volume) 2020 & 2033
- Table 20: Global Agro Chemicals in Pakistan Industry Revenue Million Forecast, by Price Trend Analysis 2020 & 2033
- Table 21: Global Agro Chemicals in Pakistan Industry Revenue Million Forecast, by Country 2020 & 2033
- Table 22: Brazil Agro Chemicals in Pakistan Industry Revenue (Million) Forecast, by Application 2020 & 2033
- Table 23: Argentina Agro Chemicals in Pakistan Industry Revenue (Million) Forecast, by Application 2020 & 2033
- Table 24: Rest of South America Agro Chemicals in Pakistan Industry Revenue (Million) Forecast, by Application 2020 & 2033
- Table 25: Global Agro Chemicals in Pakistan Industry Revenue Million Forecast, by Production Analysis 2020 & 2033
- Table 26: Global Agro Chemicals in Pakistan Industry Revenue Million Forecast, by Consumption Analysis 2020 & 2033
- Table 27: Global Agro Chemicals in Pakistan Industry Revenue Million Forecast, by Import Market Analysis (Value & Volume) 2020 & 2033
- Table 28: Global Agro Chemicals in Pakistan Industry Revenue Million Forecast, by Export Market Analysis (Value & Volume) 2020 & 2033
- Table 29: Global Agro Chemicals in Pakistan Industry Revenue Million Forecast, by Price Trend Analysis 2020 & 2033
- Table 30: Global Agro Chemicals in Pakistan Industry Revenue Million Forecast, by Country 2020 & 2033
- Table 31: United Kingdom Agro Chemicals in Pakistan Industry Revenue (Million) Forecast, by Application 2020 & 2033
- Table 32: Germany Agro Chemicals in Pakistan Industry Revenue (Million) Forecast, by Application 2020 & 2033
- Table 33: France Agro Chemicals in Pakistan Industry Revenue (Million) Forecast, by Application 2020 & 2033
- Table 34: Italy Agro Chemicals in Pakistan Industry Revenue (Million) Forecast, by Application 2020 & 2033
- Table 35: Spain Agro Chemicals in Pakistan Industry Revenue (Million) Forecast, by Application 2020 & 2033
- Table 36: Russia Agro Chemicals in Pakistan Industry Revenue (Million) Forecast, by Application 2020 & 2033
- Table 37: Benelux Agro Chemicals in Pakistan Industry Revenue (Million) Forecast, by Application 2020 & 2033
- Table 38: Nordics Agro Chemicals in Pakistan Industry Revenue (Million) Forecast, by Application 2020 & 2033
- Table 39: Rest of Europe Agro Chemicals in Pakistan Industry Revenue (Million) Forecast, by Application 2020 & 2033
- Table 40: Global Agro Chemicals in Pakistan Industry Revenue Million Forecast, by Production Analysis 2020 & 2033
- Table 41: Global Agro Chemicals in Pakistan Industry Revenue Million Forecast, by Consumption Analysis 2020 & 2033
- Table 42: Global Agro Chemicals in Pakistan Industry Revenue Million Forecast, by Import Market Analysis (Value & Volume) 2020 & 2033
- Table 43: Global Agro Chemicals in Pakistan Industry Revenue Million Forecast, by Export Market Analysis (Value & Volume) 2020 & 2033
- Table 44: Global Agro Chemicals in Pakistan Industry Revenue Million Forecast, by Price Trend Analysis 2020 & 2033
- Table 45: Global Agro Chemicals in Pakistan Industry Revenue Million Forecast, by Country 2020 & 2033
- Table 46: Turkey Agro Chemicals in Pakistan Industry Revenue (Million) Forecast, by Application 2020 & 2033
- Table 47: Israel Agro Chemicals in Pakistan Industry Revenue (Million) Forecast, by Application 2020 & 2033
- Table 48: GCC Agro Chemicals in Pakistan Industry Revenue (Million) Forecast, by Application 2020 & 2033
- Table 49: North Africa Agro Chemicals in Pakistan Industry Revenue (Million) Forecast, by Application 2020 & 2033
- Table 50: South Africa Agro Chemicals in Pakistan Industry Revenue (Million) Forecast, by Application 2020 & 2033
- Table 51: Rest of Middle East & Africa Agro Chemicals in Pakistan Industry Revenue (Million) Forecast, by Application 2020 & 2033
- Table 52: Global Agro Chemicals in Pakistan Industry Revenue Million Forecast, by Production Analysis 2020 & 2033
- Table 53: Global Agro Chemicals in Pakistan Industry Revenue Million Forecast, by Consumption Analysis 2020 & 2033
- Table 54: Global Agro Chemicals in Pakistan Industry Revenue Million Forecast, by Import Market Analysis (Value & Volume) 2020 & 2033
- Table 55: Global Agro Chemicals in Pakistan Industry Revenue Million Forecast, by Export Market Analysis (Value & Volume) 2020 & 2033
- Table 56: Global Agro Chemicals in Pakistan Industry Revenue Million Forecast, by Price Trend Analysis 2020 & 2033
- Table 57: Global Agro Chemicals in Pakistan Industry Revenue Million Forecast, by Country 2020 & 2033
- Table 58: China Agro Chemicals in Pakistan Industry Revenue (Million) Forecast, by Application 2020 & 2033
- Table 59: India Agro Chemicals in Pakistan Industry Revenue (Million) Forecast, by Application 2020 & 2033
- Table 60: Japan Agro Chemicals in Pakistan Industry Revenue (Million) Forecast, by Application 2020 & 2033
- Table 61: South Korea Agro Chemicals in Pakistan Industry Revenue (Million) Forecast, by Application 2020 & 2033
- Table 62: ASEAN Agro Chemicals in Pakistan Industry Revenue (Million) Forecast, by Application 2020 & 2033
- Table 63: Oceania Agro Chemicals in Pakistan Industry Revenue (Million) Forecast, by Application 2020 & 2033
- Table 64: Rest of Asia Pacific Agro Chemicals in Pakistan Industry Revenue (Million) Forecast, by Application 2020 & 2033
Frequently Asked Questions
1. What is the projected Compound Annual Growth Rate (CAGR) of the Agro Chemicals in Pakistan Industry?
The projected CAGR is approximately 7.99%.
2. Which companies are prominent players in the Agro Chemicals in Pakistan Industry?
Key companies in the market include Welcon Chemicals Pvt Lt, Evyol Group, Ali Akbar Group, Syngenta, ICI Pakistan Pvt Ltd, BASF SE, FMC Corporation, Pakistan Agro Chemicals Pvt Ltd, Bayer Ag.
3. What are the main segments of the Agro Chemicals in Pakistan Industry?
The market segments include Production Analysis, Consumption Analysis, Import Market Analysis (Value & Volume), Export Market Analysis (Value & Volume), Price Trend Analysis.
4. Can you provide details about the market size?
The market size is estimated to be USD 345.59 Million as of 2022.
5. What are some drivers contributing to market growth?
Increasing Berry Consumption for Health Benefits; Increasing Adoption of High-Technology Farm Practices; Growing Usage of Berries in the Food and Beverage Industries.
6. What are the notable trends driving market growth?
Need for Increased Land Productivity.
7. Are there any restraints impacting market growth?
High Production Cost Involved in Berry Production; Increasing Disease and Pest Infestations.
8. Can you provide examples of recent developments in the market?
February 2023: Bayer partnered with Kimitec to bring the next generation of biologicals to millions of growers worldwide. This includes crop protection and biostimulant products based on molecules derived from natural sources.
9. What pricing options are available for accessing the report?
Pricing options include single-user, multi-user, and enterprise licenses priced at USD 3800, USD 4500, and USD 5800 respectively.
10. Is the market size provided in terms of value or volume?
The market size is provided in terms of value, measured in Million.
11. Are there any specific market keywords associated with the report?
Yes, the market keyword associated with the report is "Agro Chemicals in Pakistan Industry," which aids in identifying and referencing the specific market segment covered.
12. How do I determine which pricing option suits my needs best?
The pricing options vary based on user requirements and access needs. Individual users may opt for single-user licenses, while businesses requiring broader access may choose multi-user or enterprise licenses for cost-effective access to the report.
13. Are there any additional resources or data provided in the Agro Chemicals in Pakistan Industry report?
While the report offers comprehensive insights, it's advisable to review the specific contents or supplementary materials provided to ascertain if additional resources or data are available.
14. How can I stay updated on further developments or reports in the Agro Chemicals in Pakistan Industry?
To stay informed about further developments, trends, and reports in the Agro Chemicals in Pakistan Industry, consider subscribing to industry newsletters, following relevant companies and organizations, or regularly checking reputable industry news sources and publications.
Methodology
Step 1 - Identification of Relevant Samples Size from Population Database


Step 2 - Approaches for Defining Global Market Size (Value, Volume* & Price*)

Note*: In applicable scenarios
Step 3 - Data Sources
Primary Research
- Web Analytics
- Survey Reports
- Research Institute
- Latest Research Reports
- Opinion Leaders
Secondary Research
- Annual Reports
- White Paper
- Latest Press Release
- Industry Association
- Paid Database
- Investor Presentations

Step 4 - Data Triangulation
Involves using different sources of information in order to increase the validity of a study
These sources are likely to be stakeholders in a program - participants, other researchers, program staff, other community members, and so on.
Then we put all data in single framework & apply various statistical tools to find out the dynamic on the market.
During the analysis stage, feedback from the stakeholder groups would be compared to determine areas of agreement as well as areas of divergence