

Key Insights
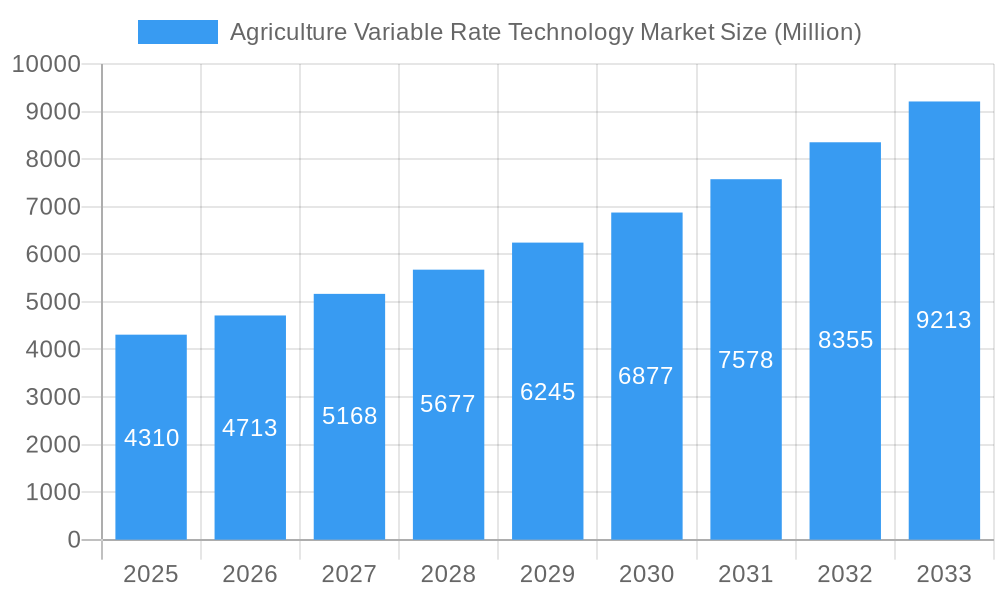
The global Agriculture Variable Rate Technology (VRT) market, valued at $4.31 billion in 2025, is projected to experience robust growth, driven by the increasing adoption of precision agriculture techniques. A Compound Annual Growth Rate (CAGR) of 9.40% from 2025 to 2033 indicates a significant market expansion, reaching an estimated $9.5 billion by 2033. This growth is fueled by several key factors. Firstly, the rising demand for efficient resource utilization, particularly water and fertilizers, is prompting farmers to embrace VRT solutions for optimized input application. Secondly, technological advancements, such as the integration of AI and IoT in sensors and data analytics platforms, are enhancing the accuracy and efficiency of VRT systems, leading to improved crop yields and reduced operational costs. Further driving market growth is the increasing availability of high-quality data and improved connectivity in agricultural regions. The market is segmented by crop type (cereals & grains, fruits & vegetables, oilseeds & pulses, commercial crops) and application (fertilizers, crop protection chemicals, soil sensing, yield monitoring, irrigation, others). North America and Europe currently hold substantial market shares, but the Asia-Pacific region is expected to witness significant growth due to rising agricultural production and increasing government support for technological advancements in farming.
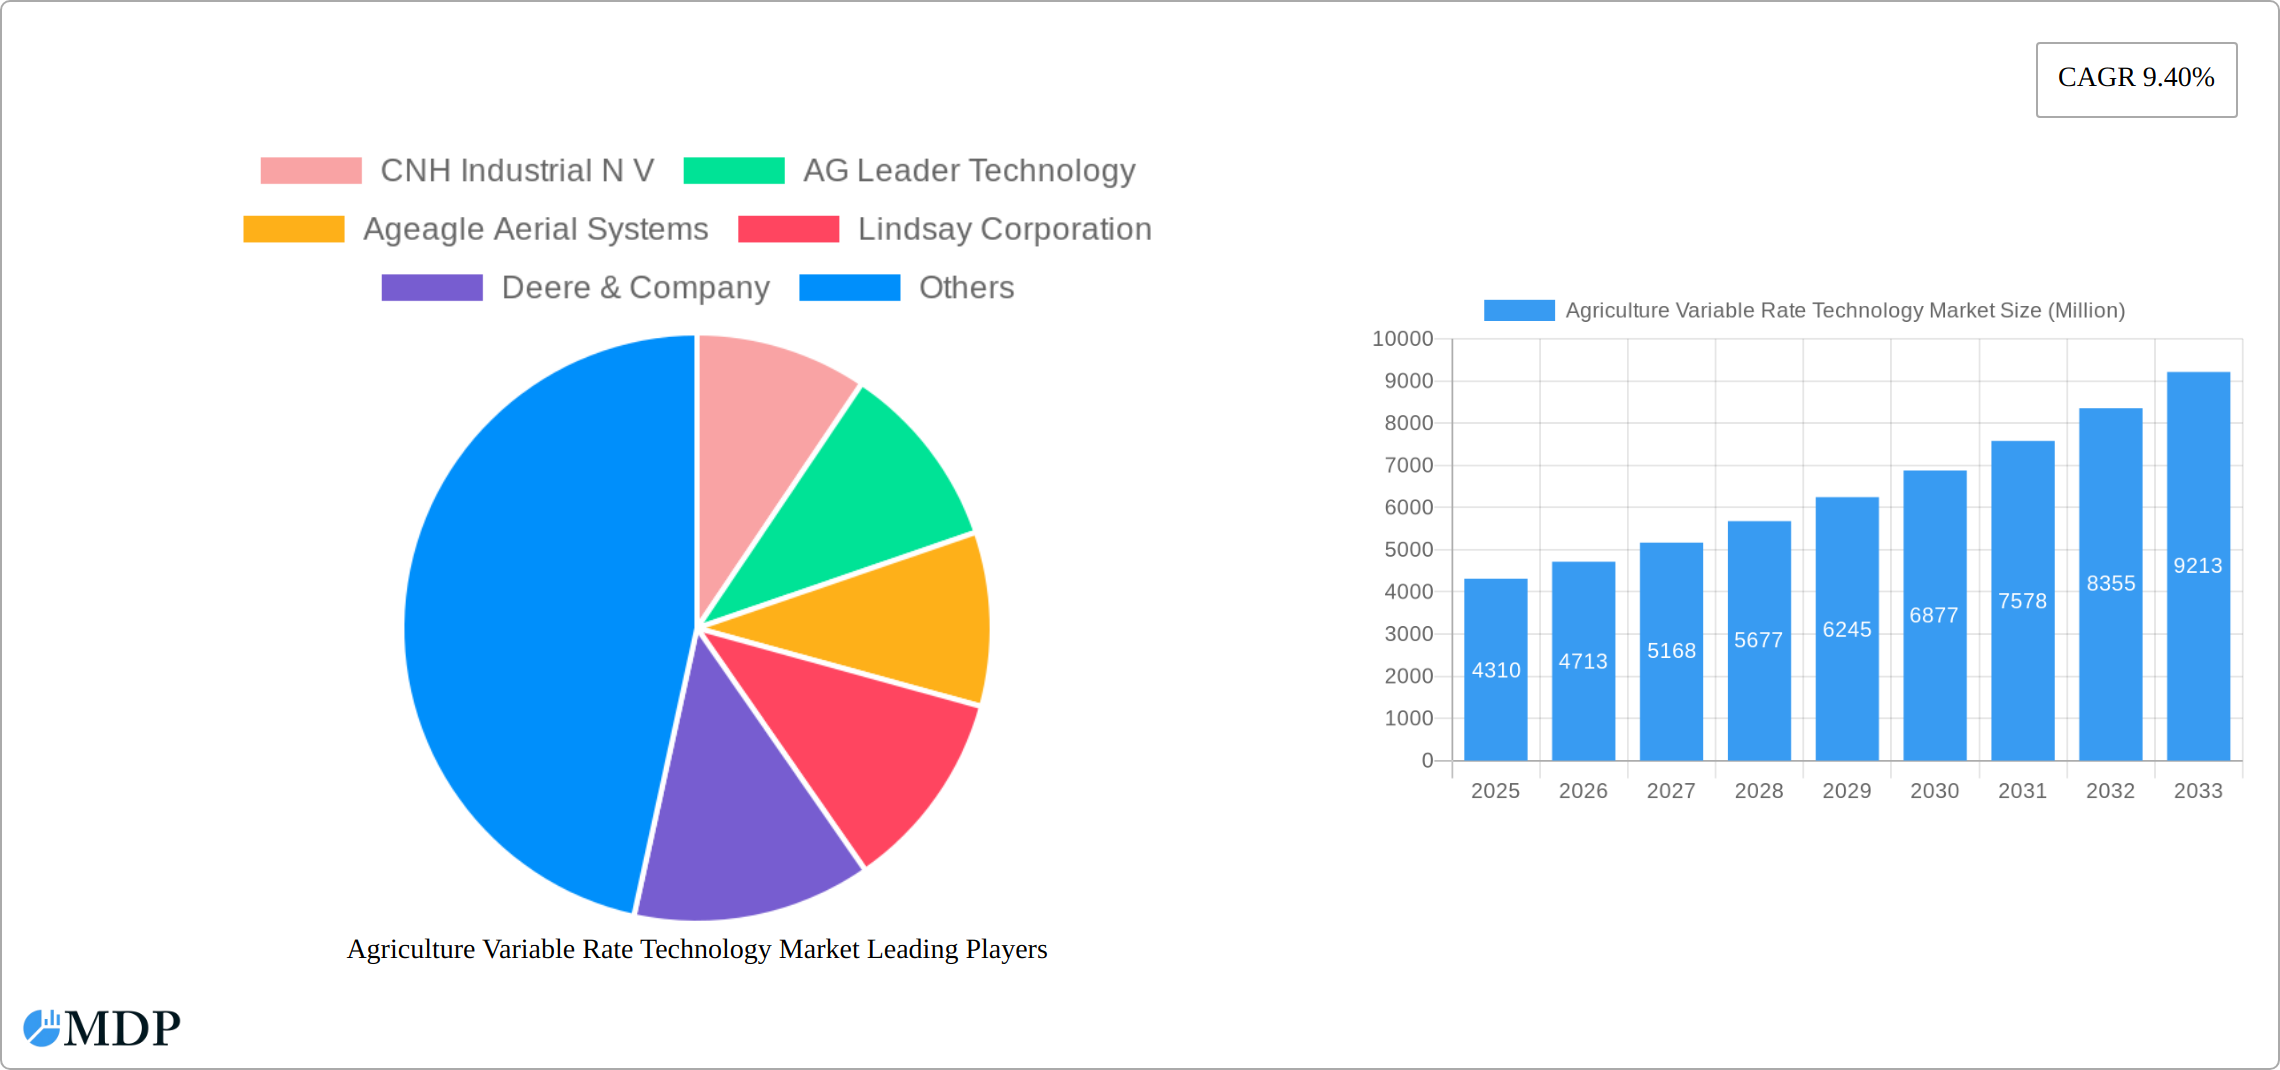
Agriculture Variable Rate Technology Market Market Size (In Billion)
Despite the positive outlook, challenges remain. The high initial investment costs associated with VRT implementation can be a barrier to entry for smallholder farmers. Furthermore, the reliance on robust internet connectivity and digital literacy among farmers requires addressing the digital divide in many regions. Nevertheless, the long-term benefits of increased yields, reduced input costs, and improved environmental sustainability are expected to outweigh these challenges, driving continued adoption of VRT technologies. Key players in the market, including CNH Industrial N.V., AGCO Corporation, and Deere & Company, are actively investing in research and development to enhance their offerings and cater to the evolving needs of farmers worldwide. The market’s future trajectory hinges on ongoing technological innovation, expanding access to affordable VRT solutions, and supportive government policies promoting sustainable agricultural practices.
Agriculture Variable Rate Technology Market Company Market Share
Agriculture Variable Rate Technology Market: A Comprehensive Report (2019-2033)
This comprehensive report provides an in-depth analysis of the Agriculture Variable Rate Technology market, offering invaluable insights for stakeholders, investors, and industry professionals. With a detailed examination of market dynamics, leading players, and future trends, this report is an essential resource for navigating the evolving landscape of precision agriculture. The study period covers 2019-2033, with 2025 serving as the base and estimated year, and the forecast period spanning 2025-2033. The historical period analyzed is 2019-2024. The global market size is projected to reach xx Million by 2033.
Agriculture Variable Rate Technology Market Market Dynamics & Concentration
The Agriculture Variable Rate Technology market is characterized by a moderate level of concentration, with a few major players holding significant market share. The market share of the top five companies is estimated at 55% in 2025. However, the market is also witnessing increased participation from smaller, specialized firms driving innovation. Key drivers include the growing need for efficient resource utilization, stringent environmental regulations promoting sustainable agriculture, and advancements in sensor technology and data analytics. Regulatory frameworks, varying across regions, influence market growth and adoption rates. Product substitutes, such as traditional broadcast methods, continue to pose competition, but their inefficiency and environmental impact are driving a shift towards variable rate technology. End-user trends highlight a growing preference for precision agriculture solutions offering improved yields, reduced input costs, and enhanced environmental sustainability. The market has seen a moderate level of M&A activity in recent years, with approximately 15-20 deals recorded between 2019 and 2024. These activities are primarily focused on expanding technological capabilities and geographical reach.
- Market Concentration: Top 5 players hold 55% market share (2025).
- Innovation Drivers: Sensor technology, data analytics, AI, IoT.
- Regulatory Frameworks: Vary significantly across regions, impacting adoption rates.
- Product Substitutes: Traditional broadcast methods, facing growing competition due to inefficiency.
- End-User Trends: Increased demand for precision agriculture solutions for improved yields and sustainability.
- M&A Activity: Approximately 15-20 deals between 2019 and 2024, focused on expansion and technological advancement.
Agriculture Variable Rate Technology Market Industry Trends & Analysis
The Agriculture Variable Rate Technology market exhibits a robust growth trajectory, driven primarily by increasing awareness of precision agriculture benefits among farmers and a growing demand for efficient resource management. Technological advancements, particularly in sensor technology, GPS, and data analytics, are transforming the industry, enabling real-time monitoring and optimized input application. Consumer preferences are shifting towards data-driven decision-making, precision farming techniques, and environmentally friendly practices. Competitive dynamics are shaped by innovation, product differentiation, and strategic partnerships. The market is expected to register a CAGR of xx% during the forecast period (2025-2033), with market penetration steadily increasing. The adoption of variable rate technology is most pronounced in developed regions with advanced agricultural practices and access to technology.
Leading Markets & Segments in Agriculture Variable Rate Technology Market
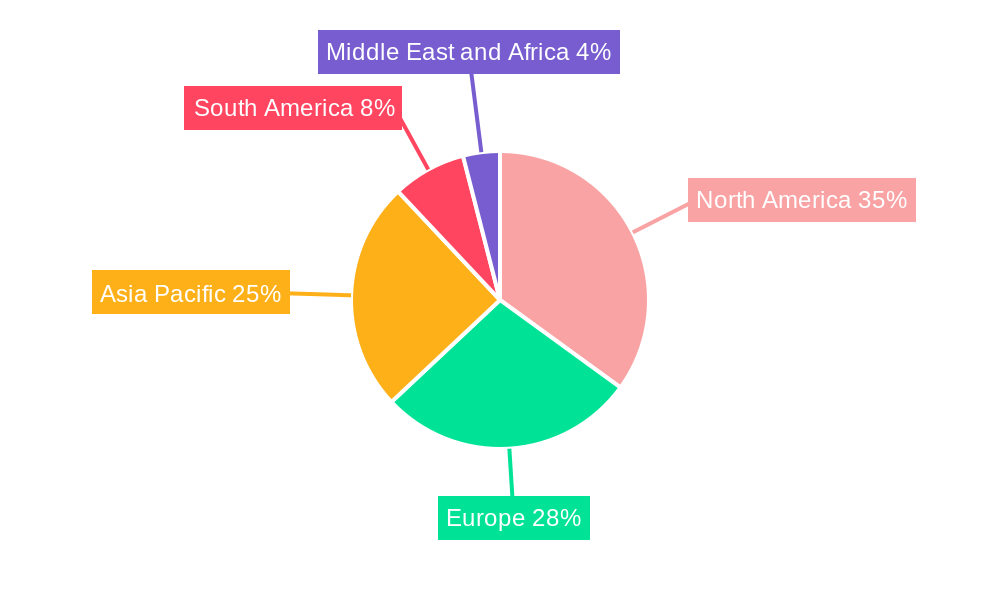
The Agriculture Variable Rate Technology (VRT) market is experiencing robust growth, with North America currently holding the leading position. This dominance is attributed to high technology adoption rates and a strong emphasis on precision agriculture practices. However, significant expansion is anticipated globally. Within the crop types, cereals and grains constitute the largest segment due to their extensive acreage and substantial use of fertilizers and other inputs. Similarly, fertilizers and crop protection chemicals represent the most significant application segments, reflecting their critical roles in optimizing crop yields and managing environmental impact.
Regional variations in market drivers exist:
- North America: High technology adoption, well-established precision agriculture practices, and a strong focus on yield optimization drive market growth.
- Europe: The increasing focus on sustainable agriculture, stringent environmental regulations, and government support for precision farming technologies are key factors.
- Asia-Pacific: The region's burgeoning population and rising demand for food security are fueling the adoption of modern farming techniques, including VRT, to enhance yields and resource efficiency. Furthermore, increasing government initiatives promoting sustainable agricultural practices are contributing to market expansion.
- Other Regions: Emerging markets in South America, Africa, and other regions present significant untapped potential for VRT adoption, driven by the need to improve agricultural productivity and address challenges related to resource scarcity and climate change.
Segment-Specific Drivers:
- Cereals & Grains: The large-scale cultivation of cereals and grains necessitates efficient input management, making VRT a crucial technology for maximizing yields and minimizing resource waste.
- Fertilizers: Precise fertilizer application through VRT optimizes nutrient uptake, reduces environmental pollution (e.g., nutrient runoff), and improves the overall return on investment for farmers.
- Crop Protection Chemicals: Targeted application of crop protection chemicals via VRT minimizes the environmental impact, reduces chemical costs, and promotes sustainable pest and disease management.
- Irrigation: Variable rate irrigation optimizes water usage based on soil moisture levels and crop needs, leading to increased water efficiency and improved crop yields.
Agriculture Variable Rate Technology Market Product Developments
Recent innovations in the Agriculture Variable Rate Technology market are centered around integrating advanced technologies such as artificial intelligence (AI), machine learning (ML), and cloud computing. This integration significantly enhances data analysis capabilities, allowing farmers to gain more precise insights into their fields. This data-driven approach enables more accurate and efficient input application, maximizing resource utilization and optimizing crop yields.
Specific advancements include:
- Enhanced Sensor Technology: New sensors provide improved accuracy and real-time data collection on various soil and crop parameters, including soil moisture, nutrient levels, and plant health.
- User-Friendly Software: Software solutions are becoming increasingly user-friendly and accessible, simplifying the adoption and use of VRT for farmers with varying levels of technological expertise.
- Integrated Systems: The market trend is towards integrated systems that seamlessly combine multiple functionalities such as yield monitoring, soil sensing, irrigation control, and variable rate application of inputs. This integrated approach streamlines data management and improves decision-making processes.
- Precision Planting Technologies: Integration of VRT with precision planting equipment allows for precise seed placement and spacing, optimizing plant population density and maximizing yields.
Key Drivers of Agriculture Variable Rate Technology Market Growth
Several factors propel the growth of the Agriculture Variable Rate Technology market. Technological advancements, particularly in sensor technology, data analytics, and automation, are key enablers. The rising need for efficient resource utilization, driven by increasing input costs and environmental concerns, encourages adoption. Favorable government policies and subsidies promoting sustainable agriculture in several regions further stimulate market growth. For example, the EU's Common Agricultural Policy supports the use of precision technologies.
Challenges in the Agriculture Variable Rate Technology Market Market
Despite the considerable growth potential, several challenges hinder market expansion. High initial investment costs for technology and infrastructure can be a barrier for smaller farms. Data security and privacy concerns regarding sensitive farming data are also emerging issues. The complexity of implementing and using variable rate technology requires specialized skills and training, creating a skills gap in some regions. Furthermore, the dependence on reliable internet connectivity can limit adoption in areas with poor infrastructure. These factors collectively limit the market's growth rate, particularly in developing regions.
Emerging Opportunities in Agriculture Variable Rate Technology Market
The Agriculture Variable Rate Technology market is poised for significant expansion, fueled by several key opportunities:
- AI and Machine Learning Advancements: Continued advancements in AI and ML are expected to further refine variable rate application techniques, leading to even greater precision, higher yields, and enhanced resource efficiency.
- IoT and Cloud Computing Integration: The growing adoption of the Internet of Things (IoT) and cloud computing facilitates seamless data integration and the provision of real-time insights to farmers, enabling faster and more informed decision-making.
- Strategic Partnerships: Collaborations between technology providers and agricultural enterprises are fostering the development of innovative solutions tailored to specific needs and crop types, accelerating market penetration.
- Expansion into Developing Markets: Untapped potential exists in developing economies where the adoption of VRT can significantly improve agricultural productivity and address food security challenges.
- Focus on Sustainability: Growing global awareness of environmental sustainability is driving demand for VRT solutions that promote responsible resource management and minimize the environmental footprint of agriculture.
These factors collectively indicate substantial market expansion in the coming years.
Leading Players in the Agriculture Variable Rate Technology Sector
- CNH Industrial N V
- AG Leader Technology
- Ageagle Aerial Systems
- Lindsay Corporation
- Deere & Company
- Trimble Inc
- Topcon Corporation
- Valmont Industries Inc
- Raven Industries Inc
- AGCO Corporation
Key Milestones in Agriculture Variable Rate Technology Industry
- 2020: Several major players launched advanced sensor systems with improved accuracy and data integration capabilities.
- 2021: Increased investment in AI-powered software solutions for enhanced data analysis and decision-making.
- 2022: Significant partnerships formed between technology providers and agricultural cooperatives to expand market reach.
- 2023: Several mergers and acquisitions aimed at consolidating market share and enhancing technological capabilities.
- 2024: Introduction of new regulatory frameworks in several regions promoting the adoption of precision agriculture technologies.
Strategic Outlook for Agriculture Variable Rate Technology Market Market
The Agriculture Variable Rate Technology market is on a trajectory of sustained growth, driven by a confluence of factors including rapid technological advancements, increasing demand for sustainable agriculture, and supportive government policies promoting precision farming. Key strategic opportunities for market players include:
- Developing Customized Solutions: Creating innovative solutions tailored to the specific needs of various crop types and farming practices is crucial for broader market penetration.
- Global Market Expansion: Targeting emerging markets with significant untapped potential is essential for accelerating market growth and maximizing reach.
- Strategic Partnerships and Collaboration: Fostering strong partnerships within the agricultural ecosystem, including farmers, agricultural businesses, and technology providers, is critical for driving innovation and market adoption.
- User-Friendly Technology: Developing user-friendly interfaces and accessible technologies will be instrumental in ensuring widespread adoption by farmers with diverse levels of technical expertise.
- Data Security and Privacy: Addressing data security and privacy concerns is paramount to building trust and fostering widespread adoption of data-driven decision-making in agriculture.
The long-term market potential for Agriculture Variable Rate Technology is substantial, especially given the ongoing trend towards data-driven decision-making and the increasing global focus on improving agricultural efficiency and environmental sustainability.
Agriculture Variable Rate Technology Market Segmentation
-
1. Crop Type
- 1.1. Cereals & Grains
- 1.2. Fruits and Vegetables
- 1.3. Oilseeds & Pulses
- 1.4. Commercial Crops
-
2. Application
- 2.1. Fertilizers
- 2.2. Crop Protection Chemicals
- 2.3. Soil Sensing
- 2.4. Yield Monitoring
- 2.5. Irrigation
- 2.6. Others
Agriculture Variable Rate Technology Market Segmentation By Geography
-
1. North America
- 1.1. United States
- 1.2. Canada
- 1.3. Mexico
-
2. South America
- 2.1. Brazil
- 2.2. Argentina
- 2.3. Rest of South America
-
3. Europe
- 3.1. United Kingdom
- 3.2. Germany
- 3.3. France
- 3.4. Italy
- 3.5. Spain
- 3.6. Russia
- 3.7. Benelux
- 3.8. Nordics
- 3.9. Rest of Europe
-
4. Middle East & Africa
- 4.1. Turkey
- 4.2. Israel
- 4.3. GCC
- 4.4. North Africa
- 4.5. South Africa
- 4.6. Rest of Middle East & Africa
-
5. Asia Pacific
- 5.1. China
- 5.2. India
- 5.3. Japan
- 5.4. South Korea
- 5.5. ASEAN
- 5.6. Oceania
- 5.7. Rest of Asia Pacific
Agriculture Variable Rate Technology Market Regional Market Share
Geographic Coverage of Agriculture Variable Rate Technology Market
Agriculture Variable Rate Technology Market REPORT HIGHLIGHTS
| Aspects | Details |
|---|---|
| Study Period | 2020-2034 |
| Base Year | 2025 |
| Estimated Year | 2026 |
| Forecast Period | 2026-2034 |
| Historical Period | 2020-2025 |
| Growth Rate | CAGR of 9.40% from 2020-2034 |
| Segmentation |
|
Table of Contents
- 1. Introduction
- 1.1. Research Scope
- 1.2. Market Segmentation
- 1.3. Research Objective
- 1.4. Definitions and Assumptions
- 2. Executive Summary
- 2.1. Market Snapshot
- 3. Market Dynamics
- 3.1. Market Drivers
- 3.2. Market Restrains
- 3.3. Market Trends
- 3.4. Market Opportunities
- 4. Market Factor Analysis
- 4.1. Porters Five Forces
- 4.1.1. Bargaining Power of Suppliers
- 4.1.2. Bargaining Power of Buyers
- 4.1.3. Threat of New Entrants
- 4.1.4. Threat of Substitutes
- 4.1.5. Competitive Rivalry
- 4.2. PESTEL analysis
- 4.3. BCG Analysis
- 4.3.1. Stars (High Growth, High Market Share)
- 4.3.2. Cash Cows (Low Growth, High Market Share)
- 4.3.3. Question Mark (High Growth, Low Market Share)
- 4.3.4. Dogs (Low Growth, Low Market Share)
- 4.4. Ansoff Matrix Analysis
- 4.5. Supply Chain Analysis
- 4.6. Regulatory Landscape
- 4.7. Current Market Potential and Opportunity Assessment (TAM–SAM–SOM Framework)
- 4.8. MDP Analyst Note
- 4.1. Porters Five Forces
- 5. Market Analysis, Insights and Forecast 2021-2033
- 5.1. Market Analysis, Insights and Forecast - by Crop Type
- 5.1.1. Cereals & Grains
- 5.1.2. Fruits and Vegetables
- 5.1.3. Oilseeds & Pulses
- 5.1.4. Commercial Crops
- 5.2. Market Analysis, Insights and Forecast - by Application
- 5.2.1. Fertilizers
- 5.2.2. Crop Protection Chemicals
- 5.2.3. Soil Sensing
- 5.2.4. Yield Monitoring
- 5.2.5. Irrigation
- 5.2.6. Others
- 5.3. Market Analysis, Insights and Forecast - by Region
- 5.3.1. North America
- 5.3.2. South America
- 5.3.3. Europe
- 5.3.4. Middle East & Africa
- 5.3.5. Asia Pacific
- 5.1. Market Analysis, Insights and Forecast - by Crop Type
- 6. Global Agriculture Variable Rate Technology Market Analysis, Insights and Forecast, 2021-2033
- 6.1. Market Analysis, Insights and Forecast - by Crop Type
- 6.1.1. Cereals & Grains
- 6.1.2. Fruits and Vegetables
- 6.1.3. Oilseeds & Pulses
- 6.1.4. Commercial Crops
- 6.2. Market Analysis, Insights and Forecast - by Application
- 6.2.1. Fertilizers
- 6.2.2. Crop Protection Chemicals
- 6.2.3. Soil Sensing
- 6.2.4. Yield Monitoring
- 6.2.5. Irrigation
- 6.2.6. Others
- 6.1. Market Analysis, Insights and Forecast - by Crop Type
- 7. North America Agriculture Variable Rate Technology Market Analysis, Insights and Forecast, 2020-2032
- 7.1. Market Analysis, Insights and Forecast - by Crop Type
- 7.1.1. Cereals & Grains
- 7.1.2. Fruits and Vegetables
- 7.1.3. Oilseeds & Pulses
- 7.1.4. Commercial Crops
- 7.2. Market Analysis, Insights and Forecast - by Application
- 7.2.1. Fertilizers
- 7.2.2. Crop Protection Chemicals
- 7.2.3. Soil Sensing
- 7.2.4. Yield Monitoring
- 7.2.5. Irrigation
- 7.2.6. Others
- 7.1. Market Analysis, Insights and Forecast - by Crop Type
- 8. South America Agriculture Variable Rate Technology Market Analysis, Insights and Forecast, 2020-2032
- 8.1. Market Analysis, Insights and Forecast - by Crop Type
- 8.1.1. Cereals & Grains
- 8.1.2. Fruits and Vegetables
- 8.1.3. Oilseeds & Pulses
- 8.1.4. Commercial Crops
- 8.2. Market Analysis, Insights and Forecast - by Application
- 8.2.1. Fertilizers
- 8.2.2. Crop Protection Chemicals
- 8.2.3. Soil Sensing
- 8.2.4. Yield Monitoring
- 8.2.5. Irrigation
- 8.2.6. Others
- 8.1. Market Analysis, Insights and Forecast - by Crop Type
- 9. Europe Agriculture Variable Rate Technology Market Analysis, Insights and Forecast, 2020-2032
- 9.1. Market Analysis, Insights and Forecast - by Crop Type
- 9.1.1. Cereals & Grains
- 9.1.2. Fruits and Vegetables
- 9.1.3. Oilseeds & Pulses
- 9.1.4. Commercial Crops
- 9.2. Market Analysis, Insights and Forecast - by Application
- 9.2.1. Fertilizers
- 9.2.2. Crop Protection Chemicals
- 9.2.3. Soil Sensing
- 9.2.4. Yield Monitoring
- 9.2.5. Irrigation
- 9.2.6. Others
- 9.1. Market Analysis, Insights and Forecast - by Crop Type
- 10. Middle East & Africa Agriculture Variable Rate Technology Market Analysis, Insights and Forecast, 2020-2032
- 10.1. Market Analysis, Insights and Forecast - by Crop Type
- 10.1.1. Cereals & Grains
- 10.1.2. Fruits and Vegetables
- 10.1.3. Oilseeds & Pulses
- 10.1.4. Commercial Crops
- 10.2. Market Analysis, Insights and Forecast - by Application
- 10.2.1. Fertilizers
- 10.2.2. Crop Protection Chemicals
- 10.2.3. Soil Sensing
- 10.2.4. Yield Monitoring
- 10.2.5. Irrigation
- 10.2.6. Others
- 10.1. Market Analysis, Insights and Forecast - by Crop Type
- 11. Asia Pacific Agriculture Variable Rate Technology Market Analysis, Insights and Forecast, 2020-2032
- 11.1. Market Analysis, Insights and Forecast - by Crop Type
- 11.1.1. Cereals & Grains
- 11.1.2. Fruits and Vegetables
- 11.1.3. Oilseeds & Pulses
- 11.1.4. Commercial Crops
- 11.2. Market Analysis, Insights and Forecast - by Application
- 11.2.1. Fertilizers
- 11.2.2. Crop Protection Chemicals
- 11.2.3. Soil Sensing
- 11.2.4. Yield Monitoring
- 11.2.5. Irrigation
- 11.2.6. Others
- 11.1. Market Analysis, Insights and Forecast - by Crop Type
- 12. Competitive Analysis
- 12.1. Company Profiles
- 12.1.1 CNH Industrial N V
- 12.1.1.1. Company Overview
- 12.1.1.2. Products
- 12.1.1.3. Company Financials
- 12.1.1.4. SWOT Analysis
- 12.1.2 AG Leader Technology
- 12.1.2.1. Company Overview
- 12.1.2.2. Products
- 12.1.2.3. Company Financials
- 12.1.2.4. SWOT Analysis
- 12.1.3 Ageagle Aerial Systems
- 12.1.3.1. Company Overview
- 12.1.3.2. Products
- 12.1.3.3. Company Financials
- 12.1.3.4. SWOT Analysis
- 12.1.4 Lindsay Corporation
- 12.1.4.1. Company Overview
- 12.1.4.2. Products
- 12.1.4.3. Company Financials
- 12.1.4.4. SWOT Analysis
- 12.1.5 Deere & Company
- 12.1.5.1. Company Overview
- 12.1.5.2. Products
- 12.1.5.3. Company Financials
- 12.1.5.4. SWOT Analysis
- 12.1.6 Trimble Inc
- 12.1.6.1. Company Overview
- 12.1.6.2. Products
- 12.1.6.3. Company Financials
- 12.1.6.4. SWOT Analysis
- 12.1.7 Topcon Corporation
- 12.1.7.1. Company Overview
- 12.1.7.2. Products
- 12.1.7.3. Company Financials
- 12.1.7.4. SWOT Analysis
- 12.1.8 Valmont Industries Inc
- 12.1.8.1. Company Overview
- 12.1.8.2. Products
- 12.1.8.3. Company Financials
- 12.1.8.4. SWOT Analysis
- 12.1.9 Raven Industries Inc
- 12.1.9.1. Company Overview
- 12.1.9.2. Products
- 12.1.9.3. Company Financials
- 12.1.9.4. SWOT Analysis
- 12.1.10 AGCO Corporation
- 12.1.10.1. Company Overview
- 12.1.10.2. Products
- 12.1.10.3. Company Financials
- 12.1.10.4. SWOT Analysis
- 12.1.1 CNH Industrial N V
- 12.2. Market Entropy
- 12.2.1 Company's Key Areas Served
- 12.2.2 Recent Developments
- 12.3. Company Market Share Analysis 2025
- 12.3.1 Top 5 Companies Market Share Analysis
- 12.3.2 Top 3 Companies Market Share Analysis
- 12.4. List of Potential Customers
- 13. Research Methodology
List of Figures
- Figure 1: Global Agriculture Variable Rate Technology Market Revenue Breakdown (Million, %) by Region 2025 & 2033
- Figure 2: North America Agriculture Variable Rate Technology Market Revenue (Million), by Crop Type 2025 & 2033
- Figure 3: North America Agriculture Variable Rate Technology Market Revenue Share (%), by Crop Type 2025 & 2033
- Figure 4: North America Agriculture Variable Rate Technology Market Revenue (Million), by Application 2025 & 2033
- Figure 5: North America Agriculture Variable Rate Technology Market Revenue Share (%), by Application 2025 & 2033
- Figure 6: North America Agriculture Variable Rate Technology Market Revenue (Million), by Country 2025 & 2033
- Figure 7: North America Agriculture Variable Rate Technology Market Revenue Share (%), by Country 2025 & 2033
- Figure 8: South America Agriculture Variable Rate Technology Market Revenue (Million), by Crop Type 2025 & 2033
- Figure 9: South America Agriculture Variable Rate Technology Market Revenue Share (%), by Crop Type 2025 & 2033
- Figure 10: South America Agriculture Variable Rate Technology Market Revenue (Million), by Application 2025 & 2033
- Figure 11: South America Agriculture Variable Rate Technology Market Revenue Share (%), by Application 2025 & 2033
- Figure 12: South America Agriculture Variable Rate Technology Market Revenue (Million), by Country 2025 & 2033
- Figure 13: South America Agriculture Variable Rate Technology Market Revenue Share (%), by Country 2025 & 2033
- Figure 14: Europe Agriculture Variable Rate Technology Market Revenue (Million), by Crop Type 2025 & 2033
- Figure 15: Europe Agriculture Variable Rate Technology Market Revenue Share (%), by Crop Type 2025 & 2033
- Figure 16: Europe Agriculture Variable Rate Technology Market Revenue (Million), by Application 2025 & 2033
- Figure 17: Europe Agriculture Variable Rate Technology Market Revenue Share (%), by Application 2025 & 2033
- Figure 18: Europe Agriculture Variable Rate Technology Market Revenue (Million), by Country 2025 & 2033
- Figure 19: Europe Agriculture Variable Rate Technology Market Revenue Share (%), by Country 2025 & 2033
- Figure 20: Middle East & Africa Agriculture Variable Rate Technology Market Revenue (Million), by Crop Type 2025 & 2033
- Figure 21: Middle East & Africa Agriculture Variable Rate Technology Market Revenue Share (%), by Crop Type 2025 & 2033
- Figure 22: Middle East & Africa Agriculture Variable Rate Technology Market Revenue (Million), by Application 2025 & 2033
- Figure 23: Middle East & Africa Agriculture Variable Rate Technology Market Revenue Share (%), by Application 2025 & 2033
- Figure 24: Middle East & Africa Agriculture Variable Rate Technology Market Revenue (Million), by Country 2025 & 2033
- Figure 25: Middle East & Africa Agriculture Variable Rate Technology Market Revenue Share (%), by Country 2025 & 2033
- Figure 26: Asia Pacific Agriculture Variable Rate Technology Market Revenue (Million), by Crop Type 2025 & 2033
- Figure 27: Asia Pacific Agriculture Variable Rate Technology Market Revenue Share (%), by Crop Type 2025 & 2033
- Figure 28: Asia Pacific Agriculture Variable Rate Technology Market Revenue (Million), by Application 2025 & 2033
- Figure 29: Asia Pacific Agriculture Variable Rate Technology Market Revenue Share (%), by Application 2025 & 2033
- Figure 30: Asia Pacific Agriculture Variable Rate Technology Market Revenue (Million), by Country 2025 & 2033
- Figure 31: Asia Pacific Agriculture Variable Rate Technology Market Revenue Share (%), by Country 2025 & 2033
List of Tables
- Table 1: Global Agriculture Variable Rate Technology Market Revenue Million Forecast, by Crop Type 2020 & 2033
- Table 2: Global Agriculture Variable Rate Technology Market Revenue Million Forecast, by Application 2020 & 2033
- Table 3: Global Agriculture Variable Rate Technology Market Revenue Million Forecast, by Region 2020 & 2033
- Table 4: Global Agriculture Variable Rate Technology Market Revenue Million Forecast, by Crop Type 2020 & 2033
- Table 5: Global Agriculture Variable Rate Technology Market Revenue Million Forecast, by Application 2020 & 2033
- Table 6: Global Agriculture Variable Rate Technology Market Revenue Million Forecast, by Country 2020 & 2033
- Table 7: United States Agriculture Variable Rate Technology Market Revenue (Million) Forecast, by Application 2020 & 2033
- Table 8: Canada Agriculture Variable Rate Technology Market Revenue (Million) Forecast, by Application 2020 & 2033
- Table 9: Mexico Agriculture Variable Rate Technology Market Revenue (Million) Forecast, by Application 2020 & 2033
- Table 10: Global Agriculture Variable Rate Technology Market Revenue Million Forecast, by Crop Type 2020 & 2033
- Table 11: Global Agriculture Variable Rate Technology Market Revenue Million Forecast, by Application 2020 & 2033
- Table 12: Global Agriculture Variable Rate Technology Market Revenue Million Forecast, by Country 2020 & 2033
- Table 13: Brazil Agriculture Variable Rate Technology Market Revenue (Million) Forecast, by Application 2020 & 2033
- Table 14: Argentina Agriculture Variable Rate Technology Market Revenue (Million) Forecast, by Application 2020 & 2033
- Table 15: Rest of South America Agriculture Variable Rate Technology Market Revenue (Million) Forecast, by Application 2020 & 2033
- Table 16: Global Agriculture Variable Rate Technology Market Revenue Million Forecast, by Crop Type 2020 & 2033
- Table 17: Global Agriculture Variable Rate Technology Market Revenue Million Forecast, by Application 2020 & 2033
- Table 18: Global Agriculture Variable Rate Technology Market Revenue Million Forecast, by Country 2020 & 2033
- Table 19: United Kingdom Agriculture Variable Rate Technology Market Revenue (Million) Forecast, by Application 2020 & 2033
- Table 20: Germany Agriculture Variable Rate Technology Market Revenue (Million) Forecast, by Application 2020 & 2033
- Table 21: France Agriculture Variable Rate Technology Market Revenue (Million) Forecast, by Application 2020 & 2033
- Table 22: Italy Agriculture Variable Rate Technology Market Revenue (Million) Forecast, by Application 2020 & 2033
- Table 23: Spain Agriculture Variable Rate Technology Market Revenue (Million) Forecast, by Application 2020 & 2033
- Table 24: Russia Agriculture Variable Rate Technology Market Revenue (Million) Forecast, by Application 2020 & 2033
- Table 25: Benelux Agriculture Variable Rate Technology Market Revenue (Million) Forecast, by Application 2020 & 2033
- Table 26: Nordics Agriculture Variable Rate Technology Market Revenue (Million) Forecast, by Application 2020 & 2033
- Table 27: Rest of Europe Agriculture Variable Rate Technology Market Revenue (Million) Forecast, by Application 2020 & 2033
- Table 28: Global Agriculture Variable Rate Technology Market Revenue Million Forecast, by Crop Type 2020 & 2033
- Table 29: Global Agriculture Variable Rate Technology Market Revenue Million Forecast, by Application 2020 & 2033
- Table 30: Global Agriculture Variable Rate Technology Market Revenue Million Forecast, by Country 2020 & 2033
- Table 31: Turkey Agriculture Variable Rate Technology Market Revenue (Million) Forecast, by Application 2020 & 2033
- Table 32: Israel Agriculture Variable Rate Technology Market Revenue (Million) Forecast, by Application 2020 & 2033
- Table 33: GCC Agriculture Variable Rate Technology Market Revenue (Million) Forecast, by Application 2020 & 2033
- Table 34: North Africa Agriculture Variable Rate Technology Market Revenue (Million) Forecast, by Application 2020 & 2033
- Table 35: South Africa Agriculture Variable Rate Technology Market Revenue (Million) Forecast, by Application 2020 & 2033
- Table 36: Rest of Middle East & Africa Agriculture Variable Rate Technology Market Revenue (Million) Forecast, by Application 2020 & 2033
- Table 37: Global Agriculture Variable Rate Technology Market Revenue Million Forecast, by Crop Type 2020 & 2033
- Table 38: Global Agriculture Variable Rate Technology Market Revenue Million Forecast, by Application 2020 & 2033
- Table 39: Global Agriculture Variable Rate Technology Market Revenue Million Forecast, by Country 2020 & 2033
- Table 40: China Agriculture Variable Rate Technology Market Revenue (Million) Forecast, by Application 2020 & 2033
- Table 41: India Agriculture Variable Rate Technology Market Revenue (Million) Forecast, by Application 2020 & 2033
- Table 42: Japan Agriculture Variable Rate Technology Market Revenue (Million) Forecast, by Application 2020 & 2033
- Table 43: South Korea Agriculture Variable Rate Technology Market Revenue (Million) Forecast, by Application 2020 & 2033
- Table 44: ASEAN Agriculture Variable Rate Technology Market Revenue (Million) Forecast, by Application 2020 & 2033
- Table 45: Oceania Agriculture Variable Rate Technology Market Revenue (Million) Forecast, by Application 2020 & 2033
- Table 46: Rest of Asia Pacific Agriculture Variable Rate Technology Market Revenue (Million) Forecast, by Application 2020 & 2033
Frequently Asked Questions
1. What is the projected Compound Annual Growth Rate (CAGR) of the Agriculture Variable Rate Technology Market?
The projected CAGR is approximately 9.40%.
2. Which companies are prominent players in the Agriculture Variable Rate Technology Market?
Key companies in the market include CNH Industrial N V, AG Leader Technology, Ageagle Aerial Systems, Lindsay Corporation, Deere & Company, Trimble Inc, Topcon Corporation, Valmont Industries Inc, Raven Industries Inc, AGCO Corporation.
3. What are the main segments of the Agriculture Variable Rate Technology Market?
The market segments include Crop Type, Application.
4. Can you provide details about the market size?
The market size is estimated to be USD 4.31 Million as of 2022.
5. What are some drivers contributing to market growth?
Low Availability of Skilled Labor; Technological Advancements.
6. What are the notable trends driving market growth?
Increasing Adoption of Digital Technologies in the Agricultural Sector.
7. Are there any restraints impacting market growth?
Increasing Farm Expenditure; Security Concerns in Modern Farming Machinery.
8. Can you provide examples of recent developments in the market?
N/A
9. What pricing options are available for accessing the report?
Pricing options include single-user, multi-user, and enterprise licenses priced at USD 3800, USD 4500, and USD 5800 respectively.
10. Is the market size provided in terms of value or volume?
The market size is provided in terms of value, measured in Million.
11. Are there any specific market keywords associated with the report?
Yes, the market keyword associated with the report is "Agriculture Variable Rate Technology Market," which aids in identifying and referencing the specific market segment covered.
12. How do I determine which pricing option suits my needs best?
The pricing options vary based on user requirements and access needs. Individual users may opt for single-user licenses, while businesses requiring broader access may choose multi-user or enterprise licenses for cost-effective access to the report.
13. Are there any additional resources or data provided in the Agriculture Variable Rate Technology Market report?
While the report offers comprehensive insights, it's advisable to review the specific contents or supplementary materials provided to ascertain if additional resources or data are available.
14. How can I stay updated on further developments or reports in the Agriculture Variable Rate Technology Market?
To stay informed about further developments, trends, and reports in the Agriculture Variable Rate Technology Market, consider subscribing to industry newsletters, following relevant companies and organizations, or regularly checking reputable industry news sources and publications.
Methodology
Step 1 - Identification of Relevant Samples Size from Population Database


Step 2 - Approaches for Defining Global Market Size (Value, Volume* & Price*)

Note*: In applicable scenarios
Step 3 - Data Sources
Primary Research
- Web Analytics
- Survey Reports
- Research Institute
- Latest Research Reports
- Opinion Leaders
Secondary Research
- Annual Reports
- White Paper
- Latest Press Release
- Industry Association
- Paid Database
- Investor Presentations

Step 4 - Data Triangulation
Involves using different sources of information in order to increase the validity of a study
These sources are likely to be stakeholders in a program - participants, other researchers, program staff, other community members, and so on.
Then we put all data in single framework & apply various statistical tools to find out the dynamic on the market.
During the analysis stage, feedback from the stakeholder groups would be compared to determine areas of agreement as well as areas of divergence