

Key Insights
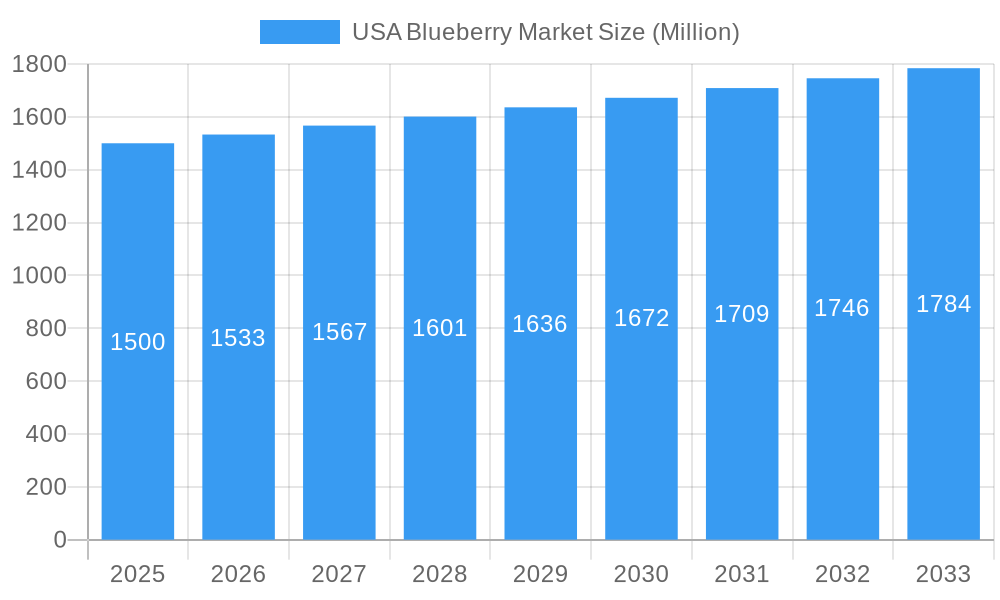
The US blueberry market, valued at approximately $1.5 billion in 2025, is projected to experience steady growth, exhibiting a compound annual growth rate (CAGR) of 2.10% from 2025 to 2033. This growth is driven by several key factors. The increasing consumer awareness of blueberries' health benefits, particularly their high antioxidant content, fuels demand across diverse applications. The expanding food and beverage sector, incorporating blueberries into various products like yogurts, juices, and baked goods, significantly contributes to market expansion. Furthermore, the growing popularity of functional foods and the increasing use of blueberries in the pharmaceutical and cosmetic industries are adding to market momentum. Frozen blueberries currently hold the largest market share among product types, due to their extended shelf life and convenience. However, the fresh blueberry segment is expected to witness substantial growth fueled by increasing consumer preference for fresh produce.
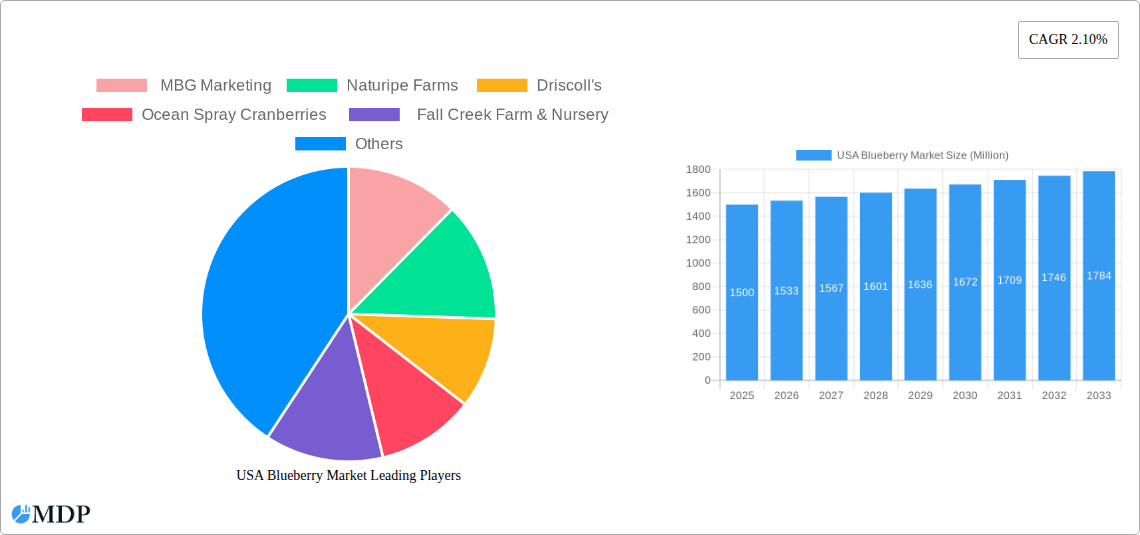
USA Blueberry Market Market Size (In Billion)
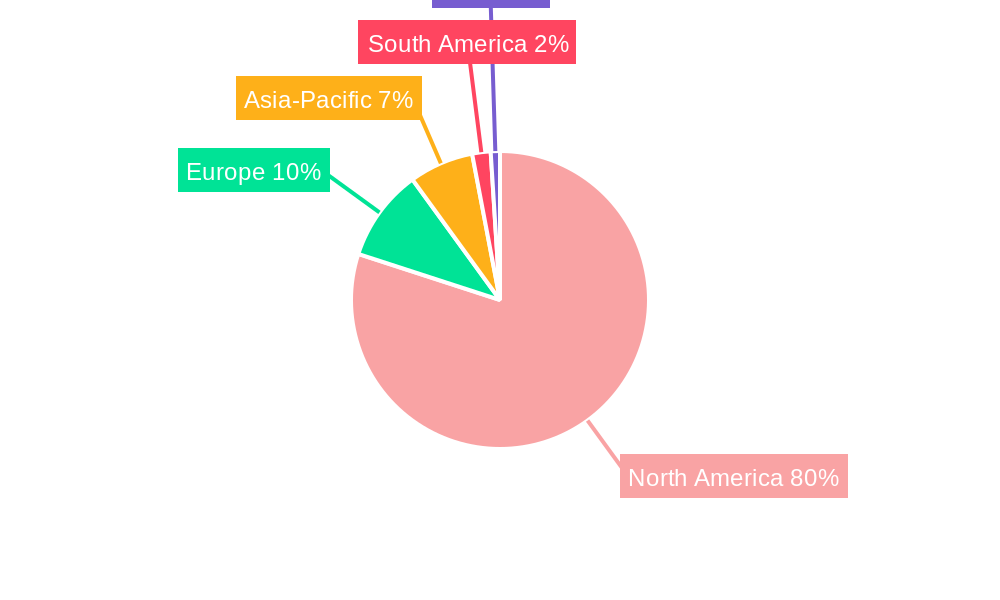
Despite the positive growth trajectory, the market faces certain challenges. Seasonal variations in blueberry production can lead to price fluctuations, impacting market stability. Competition from other berries and fruits, along with the rising cost of production and labor, could potentially restrain market growth. However, innovative product development, focusing on value-added blueberry products and exploring new market segments, presents opportunities for market players to mitigate these restraints. Key players such as MBG Marketing, Naturipe Farms, Driscoll's, Ocean Spray Cranberries, and Fall Creek Farm & Nursery are strategically positioning themselves to capitalize on these opportunities through product diversification, brand building, and strategic partnerships. The North American region, particularly the United States, dominates the market, primarily due to high consumption rates and robust domestic production.
USA Blueberry Market Company Market Share
USA Blueberry Market Report: A Comprehensive Analysis (2019-2033)
This comprehensive report provides an in-depth analysis of the USA Blueberry Market, offering valuable insights for industry stakeholders, investors, and businesses seeking to navigate this dynamic sector. With a study period spanning 2019-2033, a base year of 2025, and a forecast period of 2025-2033, this report delivers actionable intelligence based on historical data (2019-2024) and future projections. The report segments the market by product type (Fresh, Frozen, Dried Blueberries) and application (Food & Beverage, Pharmaceuticals, Cosmetics), providing a granular understanding of market dynamics and growth potential. The total market value is projected to reach xx Million by 2033.
USA Blueberry Market Market Dynamics & Concentration
The USA blueberry market is characterized by a moderate level of concentration, with several key players dominating production and distribution. Market share is largely influenced by factors like production capacity, brand recognition, and distribution networks. While precise market share figures for individual companies remain proprietary, MBG Marketing, Naturipe Farms, Driscoll's, Ocean Spray Cranberries, and Fall Creek Farm & Nursery are recognized as significant players. Innovation in cultivation techniques, processing methods, and product development significantly shapes market dynamics. Stringent regulatory frameworks concerning food safety and labeling influence operational costs and strategies. The presence of substitute fruits and berries introduces competitive pressure. Consumer trends towards healthier diets and functional foods are creating positive market momentum. M&A activity has been relatively moderate in recent years, with approximately xx deals recorded between 2019 and 2024, primarily focused on expanding production capacity and market reach.
- Market Concentration: Moderate, with a few dominant players.
- Innovation Drivers: Improved cultivation, processing, and product diversification.
- Regulatory Frameworks: Food safety and labeling regulations impact operations.
- Product Substitutes: Competition from other fruits and berries.
- End-User Trends: Growing demand for healthy and convenient food options.
- M&A Activity: Approximately xx deals between 2019 and 2024.
USA Blueberry Market Industry Trends & Analysis
The USA blueberry market is experiencing robust growth, driven by increasing consumer demand for healthy and nutritious food options. The market's Compound Annual Growth Rate (CAGR) during the historical period (2019-2024) is estimated at xx%, reflecting the strong appeal of blueberries among health-conscious consumers. Technological advancements in cultivation, such as precision agriculture and improved irrigation techniques, are enhancing yields and efficiency. Consumer preference for convenient and ready-to-eat products is driving the growth of processed blueberry products like frozen and dried blueberries. The market penetration of organic and sustainably sourced blueberries is also increasing, reflecting the growing awareness of environmentally conscious consumers. Competitive dynamics are characterized by innovation in product offerings, branding, and distribution strategies.
Leading Markets & Segments in USA Blueberry Market
The fresh blueberry segment dominates the USA blueberry market, driven by consumer preference for fresh fruit. The food and beverage industry is the primary application segment, utilizing blueberries in various products like jams, juices, and baked goods.
- Dominant Region: [Insert Dominant Region, e.g., Northwest] due to favorable climatic conditions and established production infrastructure.
- Key Drivers for Fresh Blueberries: High consumer demand, short shelf life encouraging frequent purchases.
- Key Drivers for Frozen Blueberries: Convenience, extended shelf life, suitability for food processing.
- Key Drivers for Dried Blueberries: Longer shelf life, convenient snack option, application in various food products.
- Key Drivers for Food & Beverage Application: Wide range of applications, versatility in culinary uses.
- Dominance Analysis: The fresh blueberry segment holds the largest market share owing to consumer preference for freshness and its versatility in direct consumption and culinary applications.
USA Blueberry Market Product Developments
Recent product innovations focus on enhancing convenience, extending shelf life, and adding value through functional ingredients. For example, new varieties of blueberries with enhanced flavor profiles and nutritional content are being developed. The introduction of innovative packaging solutions, such as modified atmosphere packaging (MAP), helps to extend the shelf life of fresh blueberries, reducing waste and improving market availability. These product advancements cater to changing consumer preferences and expand market applications.
Key Drivers of USA Blueberry Market Growth
The USA blueberry market's growth is propelled by multiple factors. Firstly, increasing consumer awareness of blueberries' health benefits fuels demand. Secondly, technological advancements in cultivation and processing enhance efficiency and product quality. Finally, favorable government policies and support for agricultural development contribute to market expansion.
Challenges in the USA Blueberry Market Market
The USA blueberry market faces challenges including fluctuating weather patterns impacting production yields, supply chain disruptions causing price volatility, and intense competition from other berry producers. These factors can influence the overall market stability and profitability.
Emerging Opportunities in USA Blueberry Market
Significant opportunities exist in expanding exports to international markets and developing value-added products such as functional food ingredients and dietary supplements. Strategic partnerships and collaborations amongst industry players could drive innovation and market expansion.
Leading Players in the USA Blueberry Market Sector
- MBG Marketing
- Naturipe Farms
- Driscoll's
- Ocean Spray Cranberries
- Fall Creek Farm & Nursery
Key Milestones in USA Blueberry Market Industry
- June 2022: USHBC forecasts a 10.4% increase in blueberry production, reaching 328,940 metric tons, with 185,700 metric tons designated for fresh sales and 143,240 metric tons for processed products. This signifies robust growth and increased market supply.
- June 2021: USHBC expands its Indian programming to promote blueberries, showcasing their versatility and health benefits. This strategic initiative aims to tap into new markets and boost export opportunities, expanding the market reach beyond the domestic sphere.
Strategic Outlook for USA Blueberry Market Market
The USA blueberry market is poised for sustained growth, driven by increasing consumer demand, technological advancements, and market expansion strategies. Focusing on innovation, strategic partnerships, and sustainable practices will be crucial for companies seeking to capitalize on future opportunities within this dynamic sector.
USA Blueberry Market Segmentation
- 1. Production Analysis
- 2. Consumption Analysis
- 3. Import Market Analysis (Value & Volume)
- 4. Export Market Analysis (Value & Volume)
- 5. Price Trend Analysis
USA Blueberry Market Segmentation By Geography
-
1. North America
- 1.1. United States
- 1.2. Canada
- 1.3. Mexico
-
2. South America
- 2.1. Brazil
- 2.2. Argentina
- 2.3. Rest of South America
-
3. Europe
- 3.1. United Kingdom
- 3.2. Germany
- 3.3. France
- 3.4. Italy
- 3.5. Spain
- 3.6. Russia
- 3.7. Benelux
- 3.8. Nordics
- 3.9. Rest of Europe
-
4. Middle East & Africa
- 4.1. Turkey
- 4.2. Israel
- 4.3. GCC
- 4.4. North Africa
- 4.5. South Africa
- 4.6. Rest of Middle East & Africa
-
5. Asia Pacific
- 5.1. China
- 5.2. India
- 5.3. Japan
- 5.4. South Korea
- 5.5. ASEAN
- 5.6. Oceania
- 5.7. Rest of Asia Pacific
USA Blueberry Market Regional Market Share
Geographic Coverage of USA Blueberry Market
USA Blueberry Market REPORT HIGHLIGHTS
| Aspects | Details |
|---|---|
| Study Period | 2020-2034 |
| Base Year | 2025 |
| Estimated Year | 2026 |
| Forecast Period | 2026-2034 |
| Historical Period | 2020-2025 |
| Growth Rate | CAGR of 2.10% from 2020-2034 |
| Segmentation |
|
Table of Contents
- 1. Introduction
- 1.1. Research Scope
- 1.2. Market Segmentation
- 1.3. Research Objective
- 1.4. Definitions and Assumptions
- 2. Executive Summary
- 2.1. Market Snapshot
- 3. Market Dynamics
- 3.1. Market Drivers
- 3.2. Market Restrains
- 3.3. Market Trends
- 3.4. Market Opportunities
- 4. Market Factor Analysis
- 4.1. Porters Five Forces
- 4.1.1. Bargaining Power of Suppliers
- 4.1.2. Bargaining Power of Buyers
- 4.1.3. Threat of New Entrants
- 4.1.4. Threat of Substitutes
- 4.1.5. Competitive Rivalry
- 4.2. PESTEL analysis
- 4.3. BCG Analysis
- 4.3.1. Stars (High Growth, High Market Share)
- 4.3.2. Cash Cows (Low Growth, High Market Share)
- 4.3.3. Question Mark (High Growth, Low Market Share)
- 4.3.4. Dogs (Low Growth, Low Market Share)
- 4.4. Ansoff Matrix Analysis
- 4.5. Supply Chain Analysis
- 4.6. Regulatory Landscape
- 4.7. Current Market Potential and Opportunity Assessment (TAM–SAM–SOM Framework)
- 4.8. MDP Analyst Note
- 4.1. Porters Five Forces
- 5. Market Analysis, Insights and Forecast 2021-2033
- 5.1. Market Analysis, Insights and Forecast - by Production Analysis
- 5.2. Market Analysis, Insights and Forecast - by Consumption Analysis
- 5.3. Market Analysis, Insights and Forecast - by Import Market Analysis (Value & Volume)
- 5.4. Market Analysis, Insights and Forecast - by Export Market Analysis (Value & Volume)
- 5.5. Market Analysis, Insights and Forecast - by Price Trend Analysis
- 5.6. Market Analysis, Insights and Forecast - by Region
- 5.6.1. North America
- 5.6.2. South America
- 5.6.3. Europe
- 5.6.4. Middle East & Africa
- 5.6.5. Asia Pacific
- 6. Global USA Blueberry Market Analysis, Insights and Forecast, 2021-2033
- 6.1. Market Analysis, Insights and Forecast - by Production Analysis
- 6.2. Market Analysis, Insights and Forecast - by Consumption Analysis
- 6.3. Market Analysis, Insights and Forecast - by Import Market Analysis (Value & Volume)
- 6.4. Market Analysis, Insights and Forecast - by Export Market Analysis (Value & Volume)
- 6.5. Market Analysis, Insights and Forecast - by Price Trend Analysis
- 7. North America USA Blueberry Market Analysis, Insights and Forecast, 2020-2032
- 7.1. Market Analysis, Insights and Forecast - by Production Analysis
- 7.2. Market Analysis, Insights and Forecast - by Consumption Analysis
- 7.3. Market Analysis, Insights and Forecast - by Import Market Analysis (Value & Volume)
- 7.4. Market Analysis, Insights and Forecast - by Export Market Analysis (Value & Volume)
- 7.5. Market Analysis, Insights and Forecast - by Price Trend Analysis
- 8. South America USA Blueberry Market Analysis, Insights and Forecast, 2020-2032
- 8.1. Market Analysis, Insights and Forecast - by Production Analysis
- 8.2. Market Analysis, Insights and Forecast - by Consumption Analysis
- 8.3. Market Analysis, Insights and Forecast - by Import Market Analysis (Value & Volume)
- 8.4. Market Analysis, Insights and Forecast - by Export Market Analysis (Value & Volume)
- 8.5. Market Analysis, Insights and Forecast - by Price Trend Analysis
- 9. Europe USA Blueberry Market Analysis, Insights and Forecast, 2020-2032
- 9.1. Market Analysis, Insights and Forecast - by Production Analysis
- 9.2. Market Analysis, Insights and Forecast - by Consumption Analysis
- 9.3. Market Analysis, Insights and Forecast - by Import Market Analysis (Value & Volume)
- 9.4. Market Analysis, Insights and Forecast - by Export Market Analysis (Value & Volume)
- 9.5. Market Analysis, Insights and Forecast - by Price Trend Analysis
- 10. Middle East & Africa USA Blueberry Market Analysis, Insights and Forecast, 2020-2032
- 10.1. Market Analysis, Insights and Forecast - by Production Analysis
- 10.2. Market Analysis, Insights and Forecast - by Consumption Analysis
- 10.3. Market Analysis, Insights and Forecast - by Import Market Analysis (Value & Volume)
- 10.4. Market Analysis, Insights and Forecast - by Export Market Analysis (Value & Volume)
- 10.5. Market Analysis, Insights and Forecast - by Price Trend Analysis
- 11. Asia Pacific USA Blueberry Market Analysis, Insights and Forecast, 2020-2032
- 11.1. Market Analysis, Insights and Forecast - by Production Analysis
- 11.2. Market Analysis, Insights and Forecast - by Consumption Analysis
- 11.3. Market Analysis, Insights and Forecast - by Import Market Analysis (Value & Volume)
- 11.4. Market Analysis, Insights and Forecast - by Export Market Analysis (Value & Volume)
- 11.5. Market Analysis, Insights and Forecast - by Price Trend Analysis
- 12. Competitive Analysis
- 12.1. Company Profiles
- 12.1.1 MBG Marketing
- 12.1.1.1. Company Overview
- 12.1.1.2. Products
- 12.1.1.3. Company Financials
- 12.1.1.4. SWOT Analysis
- 12.1.2 Naturipe Farms
- 12.1.2.1. Company Overview
- 12.1.2.2. Products
- 12.1.2.3. Company Financials
- 12.1.2.4. SWOT Analysis
- 12.1.3 Driscoll's
- 12.1.3.1. Company Overview
- 12.1.3.2. Products
- 12.1.3.3. Company Financials
- 12.1.3.4. SWOT Analysis
- 12.1.4 Ocean Spray Cranberries
- 12.1.4.1. Company Overview
- 12.1.4.2. Products
- 12.1.4.3. Company Financials
- 12.1.4.4. SWOT Analysis
- 12.1.5 Fall Creek Farm & Nursery
- 12.1.5.1. Company Overview
- 12.1.5.2. Products
- 12.1.5.3. Company Financials
- 12.1.5.4. SWOT Analysis
- 12.1.1 MBG Marketing
- 12.2. Market Entropy
- 12.2.1 Company's Key Areas Served
- 12.2.2 Recent Developments
- 12.3. Company Market Share Analysis 2025
- 12.3.1 Top 5 Companies Market Share Analysis
- 12.3.2 Top 3 Companies Market Share Analysis
- 12.4. List of Potential Customers
- 13. Research Methodology
List of Figures
- Figure 1: Global USA Blueberry Market Revenue Breakdown (Million, %) by Region 2025 & 2033
- Figure 2: Global USA Blueberry Market Volume Breakdown (Kiloton, %) by Region 2025 & 2033
- Figure 3: North America USA Blueberry Market Revenue (Million), by Production Analysis 2025 & 2033
- Figure 4: North America USA Blueberry Market Volume (Kiloton), by Production Analysis 2025 & 2033
- Figure 5: North America USA Blueberry Market Revenue Share (%), by Production Analysis 2025 & 2033
- Figure 6: North America USA Blueberry Market Volume Share (%), by Production Analysis 2025 & 2033
- Figure 7: North America USA Blueberry Market Revenue (Million), by Consumption Analysis 2025 & 2033
- Figure 8: North America USA Blueberry Market Volume (Kiloton), by Consumption Analysis 2025 & 2033
- Figure 9: North America USA Blueberry Market Revenue Share (%), by Consumption Analysis 2025 & 2033
- Figure 10: North America USA Blueberry Market Volume Share (%), by Consumption Analysis 2025 & 2033
- Figure 11: North America USA Blueberry Market Revenue (Million), by Import Market Analysis (Value & Volume) 2025 & 2033
- Figure 12: North America USA Blueberry Market Volume (Kiloton), by Import Market Analysis (Value & Volume) 2025 & 2033
- Figure 13: North America USA Blueberry Market Revenue Share (%), by Import Market Analysis (Value & Volume) 2025 & 2033
- Figure 14: North America USA Blueberry Market Volume Share (%), by Import Market Analysis (Value & Volume) 2025 & 2033
- Figure 15: North America USA Blueberry Market Revenue (Million), by Export Market Analysis (Value & Volume) 2025 & 2033
- Figure 16: North America USA Blueberry Market Volume (Kiloton), by Export Market Analysis (Value & Volume) 2025 & 2033
- Figure 17: North America USA Blueberry Market Revenue Share (%), by Export Market Analysis (Value & Volume) 2025 & 2033
- Figure 18: North America USA Blueberry Market Volume Share (%), by Export Market Analysis (Value & Volume) 2025 & 2033
- Figure 19: North America USA Blueberry Market Revenue (Million), by Price Trend Analysis 2025 & 2033
- Figure 20: North America USA Blueberry Market Volume (Kiloton), by Price Trend Analysis 2025 & 2033
- Figure 21: North America USA Blueberry Market Revenue Share (%), by Price Trend Analysis 2025 & 2033
- Figure 22: North America USA Blueberry Market Volume Share (%), by Price Trend Analysis 2025 & 2033
- Figure 23: North America USA Blueberry Market Revenue (Million), by Country 2025 & 2033
- Figure 24: North America USA Blueberry Market Volume (Kiloton), by Country 2025 & 2033
- Figure 25: North America USA Blueberry Market Revenue Share (%), by Country 2025 & 2033
- Figure 26: North America USA Blueberry Market Volume Share (%), by Country 2025 & 2033
- Figure 27: South America USA Blueberry Market Revenue (Million), by Production Analysis 2025 & 2033
- Figure 28: South America USA Blueberry Market Volume (Kiloton), by Production Analysis 2025 & 2033
- Figure 29: South America USA Blueberry Market Revenue Share (%), by Production Analysis 2025 & 2033
- Figure 30: South America USA Blueberry Market Volume Share (%), by Production Analysis 2025 & 2033
- Figure 31: South America USA Blueberry Market Revenue (Million), by Consumption Analysis 2025 & 2033
- Figure 32: South America USA Blueberry Market Volume (Kiloton), by Consumption Analysis 2025 & 2033
- Figure 33: South America USA Blueberry Market Revenue Share (%), by Consumption Analysis 2025 & 2033
- Figure 34: South America USA Blueberry Market Volume Share (%), by Consumption Analysis 2025 & 2033
- Figure 35: South America USA Blueberry Market Revenue (Million), by Import Market Analysis (Value & Volume) 2025 & 2033
- Figure 36: South America USA Blueberry Market Volume (Kiloton), by Import Market Analysis (Value & Volume) 2025 & 2033
- Figure 37: South America USA Blueberry Market Revenue Share (%), by Import Market Analysis (Value & Volume) 2025 & 2033
- Figure 38: South America USA Blueberry Market Volume Share (%), by Import Market Analysis (Value & Volume) 2025 & 2033
- Figure 39: South America USA Blueberry Market Revenue (Million), by Export Market Analysis (Value & Volume) 2025 & 2033
- Figure 40: South America USA Blueberry Market Volume (Kiloton), by Export Market Analysis (Value & Volume) 2025 & 2033
- Figure 41: South America USA Blueberry Market Revenue Share (%), by Export Market Analysis (Value & Volume) 2025 & 2033
- Figure 42: South America USA Blueberry Market Volume Share (%), by Export Market Analysis (Value & Volume) 2025 & 2033
- Figure 43: South America USA Blueberry Market Revenue (Million), by Price Trend Analysis 2025 & 2033
- Figure 44: South America USA Blueberry Market Volume (Kiloton), by Price Trend Analysis 2025 & 2033
- Figure 45: South America USA Blueberry Market Revenue Share (%), by Price Trend Analysis 2025 & 2033
- Figure 46: South America USA Blueberry Market Volume Share (%), by Price Trend Analysis 2025 & 2033
- Figure 47: South America USA Blueberry Market Revenue (Million), by Country 2025 & 2033
- Figure 48: South America USA Blueberry Market Volume (Kiloton), by Country 2025 & 2033
- Figure 49: South America USA Blueberry Market Revenue Share (%), by Country 2025 & 2033
- Figure 50: South America USA Blueberry Market Volume Share (%), by Country 2025 & 2033
- Figure 51: Europe USA Blueberry Market Revenue (Million), by Production Analysis 2025 & 2033
- Figure 52: Europe USA Blueberry Market Volume (Kiloton), by Production Analysis 2025 & 2033
- Figure 53: Europe USA Blueberry Market Revenue Share (%), by Production Analysis 2025 & 2033
- Figure 54: Europe USA Blueberry Market Volume Share (%), by Production Analysis 2025 & 2033
- Figure 55: Europe USA Blueberry Market Revenue (Million), by Consumption Analysis 2025 & 2033
- Figure 56: Europe USA Blueberry Market Volume (Kiloton), by Consumption Analysis 2025 & 2033
- Figure 57: Europe USA Blueberry Market Revenue Share (%), by Consumption Analysis 2025 & 2033
- Figure 58: Europe USA Blueberry Market Volume Share (%), by Consumption Analysis 2025 & 2033
- Figure 59: Europe USA Blueberry Market Revenue (Million), by Import Market Analysis (Value & Volume) 2025 & 2033
- Figure 60: Europe USA Blueberry Market Volume (Kiloton), by Import Market Analysis (Value & Volume) 2025 & 2033
- Figure 61: Europe USA Blueberry Market Revenue Share (%), by Import Market Analysis (Value & Volume) 2025 & 2033
- Figure 62: Europe USA Blueberry Market Volume Share (%), by Import Market Analysis (Value & Volume) 2025 & 2033
- Figure 63: Europe USA Blueberry Market Revenue (Million), by Export Market Analysis (Value & Volume) 2025 & 2033
- Figure 64: Europe USA Blueberry Market Volume (Kiloton), by Export Market Analysis (Value & Volume) 2025 & 2033
- Figure 65: Europe USA Blueberry Market Revenue Share (%), by Export Market Analysis (Value & Volume) 2025 & 2033
- Figure 66: Europe USA Blueberry Market Volume Share (%), by Export Market Analysis (Value & Volume) 2025 & 2033
- Figure 67: Europe USA Blueberry Market Revenue (Million), by Price Trend Analysis 2025 & 2033
- Figure 68: Europe USA Blueberry Market Volume (Kiloton), by Price Trend Analysis 2025 & 2033
- Figure 69: Europe USA Blueberry Market Revenue Share (%), by Price Trend Analysis 2025 & 2033
- Figure 70: Europe USA Blueberry Market Volume Share (%), by Price Trend Analysis 2025 & 2033
- Figure 71: Europe USA Blueberry Market Revenue (Million), by Country 2025 & 2033
- Figure 72: Europe USA Blueberry Market Volume (Kiloton), by Country 2025 & 2033
- Figure 73: Europe USA Blueberry Market Revenue Share (%), by Country 2025 & 2033
- Figure 74: Europe USA Blueberry Market Volume Share (%), by Country 2025 & 2033
- Figure 75: Middle East & Africa USA Blueberry Market Revenue (Million), by Production Analysis 2025 & 2033
- Figure 76: Middle East & Africa USA Blueberry Market Volume (Kiloton), by Production Analysis 2025 & 2033
- Figure 77: Middle East & Africa USA Blueberry Market Revenue Share (%), by Production Analysis 2025 & 2033
- Figure 78: Middle East & Africa USA Blueberry Market Volume Share (%), by Production Analysis 2025 & 2033
- Figure 79: Middle East & Africa USA Blueberry Market Revenue (Million), by Consumption Analysis 2025 & 2033
- Figure 80: Middle East & Africa USA Blueberry Market Volume (Kiloton), by Consumption Analysis 2025 & 2033
- Figure 81: Middle East & Africa USA Blueberry Market Revenue Share (%), by Consumption Analysis 2025 & 2033
- Figure 82: Middle East & Africa USA Blueberry Market Volume Share (%), by Consumption Analysis 2025 & 2033
- Figure 83: Middle East & Africa USA Blueberry Market Revenue (Million), by Import Market Analysis (Value & Volume) 2025 & 2033
- Figure 84: Middle East & Africa USA Blueberry Market Volume (Kiloton), by Import Market Analysis (Value & Volume) 2025 & 2033
- Figure 85: Middle East & Africa USA Blueberry Market Revenue Share (%), by Import Market Analysis (Value & Volume) 2025 & 2033
- Figure 86: Middle East & Africa USA Blueberry Market Volume Share (%), by Import Market Analysis (Value & Volume) 2025 & 2033
- Figure 87: Middle East & Africa USA Blueberry Market Revenue (Million), by Export Market Analysis (Value & Volume) 2025 & 2033
- Figure 88: Middle East & Africa USA Blueberry Market Volume (Kiloton), by Export Market Analysis (Value & Volume) 2025 & 2033
- Figure 89: Middle East & Africa USA Blueberry Market Revenue Share (%), by Export Market Analysis (Value & Volume) 2025 & 2033
- Figure 90: Middle East & Africa USA Blueberry Market Volume Share (%), by Export Market Analysis (Value & Volume) 2025 & 2033
- Figure 91: Middle East & Africa USA Blueberry Market Revenue (Million), by Price Trend Analysis 2025 & 2033
- Figure 92: Middle East & Africa USA Blueberry Market Volume (Kiloton), by Price Trend Analysis 2025 & 2033
- Figure 93: Middle East & Africa USA Blueberry Market Revenue Share (%), by Price Trend Analysis 2025 & 2033
- Figure 94: Middle East & Africa USA Blueberry Market Volume Share (%), by Price Trend Analysis 2025 & 2033
- Figure 95: Middle East & Africa USA Blueberry Market Revenue (Million), by Country 2025 & 2033
- Figure 96: Middle East & Africa USA Blueberry Market Volume (Kiloton), by Country 2025 & 2033
- Figure 97: Middle East & Africa USA Blueberry Market Revenue Share (%), by Country 2025 & 2033
- Figure 98: Middle East & Africa USA Blueberry Market Volume Share (%), by Country 2025 & 2033
- Figure 99: Asia Pacific USA Blueberry Market Revenue (Million), by Production Analysis 2025 & 2033
- Figure 100: Asia Pacific USA Blueberry Market Volume (Kiloton), by Production Analysis 2025 & 2033
- Figure 101: Asia Pacific USA Blueberry Market Revenue Share (%), by Production Analysis 2025 & 2033
- Figure 102: Asia Pacific USA Blueberry Market Volume Share (%), by Production Analysis 2025 & 2033
- Figure 103: Asia Pacific USA Blueberry Market Revenue (Million), by Consumption Analysis 2025 & 2033
- Figure 104: Asia Pacific USA Blueberry Market Volume (Kiloton), by Consumption Analysis 2025 & 2033
- Figure 105: Asia Pacific USA Blueberry Market Revenue Share (%), by Consumption Analysis 2025 & 2033
- Figure 106: Asia Pacific USA Blueberry Market Volume Share (%), by Consumption Analysis 2025 & 2033
- Figure 107: Asia Pacific USA Blueberry Market Revenue (Million), by Import Market Analysis (Value & Volume) 2025 & 2033
- Figure 108: Asia Pacific USA Blueberry Market Volume (Kiloton), by Import Market Analysis (Value & Volume) 2025 & 2033
- Figure 109: Asia Pacific USA Blueberry Market Revenue Share (%), by Import Market Analysis (Value & Volume) 2025 & 2033
- Figure 110: Asia Pacific USA Blueberry Market Volume Share (%), by Import Market Analysis (Value & Volume) 2025 & 2033
- Figure 111: Asia Pacific USA Blueberry Market Revenue (Million), by Export Market Analysis (Value & Volume) 2025 & 2033
- Figure 112: Asia Pacific USA Blueberry Market Volume (Kiloton), by Export Market Analysis (Value & Volume) 2025 & 2033
- Figure 113: Asia Pacific USA Blueberry Market Revenue Share (%), by Export Market Analysis (Value & Volume) 2025 & 2033
- Figure 114: Asia Pacific USA Blueberry Market Volume Share (%), by Export Market Analysis (Value & Volume) 2025 & 2033
- Figure 115: Asia Pacific USA Blueberry Market Revenue (Million), by Price Trend Analysis 2025 & 2033
- Figure 116: Asia Pacific USA Blueberry Market Volume (Kiloton), by Price Trend Analysis 2025 & 2033
- Figure 117: Asia Pacific USA Blueberry Market Revenue Share (%), by Price Trend Analysis 2025 & 2033
- Figure 118: Asia Pacific USA Blueberry Market Volume Share (%), by Price Trend Analysis 2025 & 2033
- Figure 119: Asia Pacific USA Blueberry Market Revenue (Million), by Country 2025 & 2033
- Figure 120: Asia Pacific USA Blueberry Market Volume (Kiloton), by Country 2025 & 2033
- Figure 121: Asia Pacific USA Blueberry Market Revenue Share (%), by Country 2025 & 2033
- Figure 122: Asia Pacific USA Blueberry Market Volume Share (%), by Country 2025 & 2033
List of Tables
- Table 1: Global USA Blueberry Market Revenue Million Forecast, by Production Analysis 2020 & 2033
- Table 2: Global USA Blueberry Market Volume Kiloton Forecast, by Production Analysis 2020 & 2033
- Table 3: Global USA Blueberry Market Revenue Million Forecast, by Consumption Analysis 2020 & 2033
- Table 4: Global USA Blueberry Market Volume Kiloton Forecast, by Consumption Analysis 2020 & 2033
- Table 5: Global USA Blueberry Market Revenue Million Forecast, by Import Market Analysis (Value & Volume) 2020 & 2033
- Table 6: Global USA Blueberry Market Volume Kiloton Forecast, by Import Market Analysis (Value & Volume) 2020 & 2033
- Table 7: Global USA Blueberry Market Revenue Million Forecast, by Export Market Analysis (Value & Volume) 2020 & 2033
- Table 8: Global USA Blueberry Market Volume Kiloton Forecast, by Export Market Analysis (Value & Volume) 2020 & 2033
- Table 9: Global USA Blueberry Market Revenue Million Forecast, by Price Trend Analysis 2020 & 2033
- Table 10: Global USA Blueberry Market Volume Kiloton Forecast, by Price Trend Analysis 2020 & 2033
- Table 11: Global USA Blueberry Market Revenue Million Forecast, by Region 2020 & 2033
- Table 12: Global USA Blueberry Market Volume Kiloton Forecast, by Region 2020 & 2033
- Table 13: Global USA Blueberry Market Revenue Million Forecast, by Production Analysis 2020 & 2033
- Table 14: Global USA Blueberry Market Volume Kiloton Forecast, by Production Analysis 2020 & 2033
- Table 15: Global USA Blueberry Market Revenue Million Forecast, by Consumption Analysis 2020 & 2033
- Table 16: Global USA Blueberry Market Volume Kiloton Forecast, by Consumption Analysis 2020 & 2033
- Table 17: Global USA Blueberry Market Revenue Million Forecast, by Import Market Analysis (Value & Volume) 2020 & 2033
- Table 18: Global USA Blueberry Market Volume Kiloton Forecast, by Import Market Analysis (Value & Volume) 2020 & 2033
- Table 19: Global USA Blueberry Market Revenue Million Forecast, by Export Market Analysis (Value & Volume) 2020 & 2033
- Table 20: Global USA Blueberry Market Volume Kiloton Forecast, by Export Market Analysis (Value & Volume) 2020 & 2033
- Table 21: Global USA Blueberry Market Revenue Million Forecast, by Price Trend Analysis 2020 & 2033
- Table 22: Global USA Blueberry Market Volume Kiloton Forecast, by Price Trend Analysis 2020 & 2033
- Table 23: Global USA Blueberry Market Revenue Million Forecast, by Country 2020 & 2033
- Table 24: Global USA Blueberry Market Volume Kiloton Forecast, by Country 2020 & 2033
- Table 25: United States USA Blueberry Market Revenue (Million) Forecast, by Application 2020 & 2033
- Table 26: United States USA Blueberry Market Volume (Kiloton) Forecast, by Application 2020 & 2033
- Table 27: Canada USA Blueberry Market Revenue (Million) Forecast, by Application 2020 & 2033
- Table 28: Canada USA Blueberry Market Volume (Kiloton) Forecast, by Application 2020 & 2033
- Table 29: Mexico USA Blueberry Market Revenue (Million) Forecast, by Application 2020 & 2033
- Table 30: Mexico USA Blueberry Market Volume (Kiloton) Forecast, by Application 2020 & 2033
- Table 31: Global USA Blueberry Market Revenue Million Forecast, by Production Analysis 2020 & 2033
- Table 32: Global USA Blueberry Market Volume Kiloton Forecast, by Production Analysis 2020 & 2033
- Table 33: Global USA Blueberry Market Revenue Million Forecast, by Consumption Analysis 2020 & 2033
- Table 34: Global USA Blueberry Market Volume Kiloton Forecast, by Consumption Analysis 2020 & 2033
- Table 35: Global USA Blueberry Market Revenue Million Forecast, by Import Market Analysis (Value & Volume) 2020 & 2033
- Table 36: Global USA Blueberry Market Volume Kiloton Forecast, by Import Market Analysis (Value & Volume) 2020 & 2033
- Table 37: Global USA Blueberry Market Revenue Million Forecast, by Export Market Analysis (Value & Volume) 2020 & 2033
- Table 38: Global USA Blueberry Market Volume Kiloton Forecast, by Export Market Analysis (Value & Volume) 2020 & 2033
- Table 39: Global USA Blueberry Market Revenue Million Forecast, by Price Trend Analysis 2020 & 2033
- Table 40: Global USA Blueberry Market Volume Kiloton Forecast, by Price Trend Analysis 2020 & 2033
- Table 41: Global USA Blueberry Market Revenue Million Forecast, by Country 2020 & 2033
- Table 42: Global USA Blueberry Market Volume Kiloton Forecast, by Country 2020 & 2033
- Table 43: Brazil USA Blueberry Market Revenue (Million) Forecast, by Application 2020 & 2033
- Table 44: Brazil USA Blueberry Market Volume (Kiloton) Forecast, by Application 2020 & 2033
- Table 45: Argentina USA Blueberry Market Revenue (Million) Forecast, by Application 2020 & 2033
- Table 46: Argentina USA Blueberry Market Volume (Kiloton) Forecast, by Application 2020 & 2033
- Table 47: Rest of South America USA Blueberry Market Revenue (Million) Forecast, by Application 2020 & 2033
- Table 48: Rest of South America USA Blueberry Market Volume (Kiloton) Forecast, by Application 2020 & 2033
- Table 49: Global USA Blueberry Market Revenue Million Forecast, by Production Analysis 2020 & 2033
- Table 50: Global USA Blueberry Market Volume Kiloton Forecast, by Production Analysis 2020 & 2033
- Table 51: Global USA Blueberry Market Revenue Million Forecast, by Consumption Analysis 2020 & 2033
- Table 52: Global USA Blueberry Market Volume Kiloton Forecast, by Consumption Analysis 2020 & 2033
- Table 53: Global USA Blueberry Market Revenue Million Forecast, by Import Market Analysis (Value & Volume) 2020 & 2033
- Table 54: Global USA Blueberry Market Volume Kiloton Forecast, by Import Market Analysis (Value & Volume) 2020 & 2033
- Table 55: Global USA Blueberry Market Revenue Million Forecast, by Export Market Analysis (Value & Volume) 2020 & 2033
- Table 56: Global USA Blueberry Market Volume Kiloton Forecast, by Export Market Analysis (Value & Volume) 2020 & 2033
- Table 57: Global USA Blueberry Market Revenue Million Forecast, by Price Trend Analysis 2020 & 2033
- Table 58: Global USA Blueberry Market Volume Kiloton Forecast, by Price Trend Analysis 2020 & 2033
- Table 59: Global USA Blueberry Market Revenue Million Forecast, by Country 2020 & 2033
- Table 60: Global USA Blueberry Market Volume Kiloton Forecast, by Country 2020 & 2033
- Table 61: United Kingdom USA Blueberry Market Revenue (Million) Forecast, by Application 2020 & 2033
- Table 62: United Kingdom USA Blueberry Market Volume (Kiloton) Forecast, by Application 2020 & 2033
- Table 63: Germany USA Blueberry Market Revenue (Million) Forecast, by Application 2020 & 2033
- Table 64: Germany USA Blueberry Market Volume (Kiloton) Forecast, by Application 2020 & 2033
- Table 65: France USA Blueberry Market Revenue (Million) Forecast, by Application 2020 & 2033
- Table 66: France USA Blueberry Market Volume (Kiloton) Forecast, by Application 2020 & 2033
- Table 67: Italy USA Blueberry Market Revenue (Million) Forecast, by Application 2020 & 2033
- Table 68: Italy USA Blueberry Market Volume (Kiloton) Forecast, by Application 2020 & 2033
- Table 69: Spain USA Blueberry Market Revenue (Million) Forecast, by Application 2020 & 2033
- Table 70: Spain USA Blueberry Market Volume (Kiloton) Forecast, by Application 2020 & 2033
- Table 71: Russia USA Blueberry Market Revenue (Million) Forecast, by Application 2020 & 2033
- Table 72: Russia USA Blueberry Market Volume (Kiloton) Forecast, by Application 2020 & 2033
- Table 73: Benelux USA Blueberry Market Revenue (Million) Forecast, by Application 2020 & 2033
- Table 74: Benelux USA Blueberry Market Volume (Kiloton) Forecast, by Application 2020 & 2033
- Table 75: Nordics USA Blueberry Market Revenue (Million) Forecast, by Application 2020 & 2033
- Table 76: Nordics USA Blueberry Market Volume (Kiloton) Forecast, by Application 2020 & 2033
- Table 77: Rest of Europe USA Blueberry Market Revenue (Million) Forecast, by Application 2020 & 2033
- Table 78: Rest of Europe USA Blueberry Market Volume (Kiloton) Forecast, by Application 2020 & 2033
- Table 79: Global USA Blueberry Market Revenue Million Forecast, by Production Analysis 2020 & 2033
- Table 80: Global USA Blueberry Market Volume Kiloton Forecast, by Production Analysis 2020 & 2033
- Table 81: Global USA Blueberry Market Revenue Million Forecast, by Consumption Analysis 2020 & 2033
- Table 82: Global USA Blueberry Market Volume Kiloton Forecast, by Consumption Analysis 2020 & 2033
- Table 83: Global USA Blueberry Market Revenue Million Forecast, by Import Market Analysis (Value & Volume) 2020 & 2033
- Table 84: Global USA Blueberry Market Volume Kiloton Forecast, by Import Market Analysis (Value & Volume) 2020 & 2033
- Table 85: Global USA Blueberry Market Revenue Million Forecast, by Export Market Analysis (Value & Volume) 2020 & 2033
- Table 86: Global USA Blueberry Market Volume Kiloton Forecast, by Export Market Analysis (Value & Volume) 2020 & 2033
- Table 87: Global USA Blueberry Market Revenue Million Forecast, by Price Trend Analysis 2020 & 2033
- Table 88: Global USA Blueberry Market Volume Kiloton Forecast, by Price Trend Analysis 2020 & 2033
- Table 89: Global USA Blueberry Market Revenue Million Forecast, by Country 2020 & 2033
- Table 90: Global USA Blueberry Market Volume Kiloton Forecast, by Country 2020 & 2033
- Table 91: Turkey USA Blueberry Market Revenue (Million) Forecast, by Application 2020 & 2033
- Table 92: Turkey USA Blueberry Market Volume (Kiloton) Forecast, by Application 2020 & 2033
- Table 93: Israel USA Blueberry Market Revenue (Million) Forecast, by Application 2020 & 2033
- Table 94: Israel USA Blueberry Market Volume (Kiloton) Forecast, by Application 2020 & 2033
- Table 95: GCC USA Blueberry Market Revenue (Million) Forecast, by Application 2020 & 2033
- Table 96: GCC USA Blueberry Market Volume (Kiloton) Forecast, by Application 2020 & 2033
- Table 97: North Africa USA Blueberry Market Revenue (Million) Forecast, by Application 2020 & 2033
- Table 98: North Africa USA Blueberry Market Volume (Kiloton) Forecast, by Application 2020 & 2033
- Table 99: South Africa USA Blueberry Market Revenue (Million) Forecast, by Application 2020 & 2033
- Table 100: South Africa USA Blueberry Market Volume (Kiloton) Forecast, by Application 2020 & 2033
- Table 101: Rest of Middle East & Africa USA Blueberry Market Revenue (Million) Forecast, by Application 2020 & 2033
- Table 102: Rest of Middle East & Africa USA Blueberry Market Volume (Kiloton) Forecast, by Application 2020 & 2033
- Table 103: Global USA Blueberry Market Revenue Million Forecast, by Production Analysis 2020 & 2033
- Table 104: Global USA Blueberry Market Volume Kiloton Forecast, by Production Analysis 2020 & 2033
- Table 105: Global USA Blueberry Market Revenue Million Forecast, by Consumption Analysis 2020 & 2033
- Table 106: Global USA Blueberry Market Volume Kiloton Forecast, by Consumption Analysis 2020 & 2033
- Table 107: Global USA Blueberry Market Revenue Million Forecast, by Import Market Analysis (Value & Volume) 2020 & 2033
- Table 108: Global USA Blueberry Market Volume Kiloton Forecast, by Import Market Analysis (Value & Volume) 2020 & 2033
- Table 109: Global USA Blueberry Market Revenue Million Forecast, by Export Market Analysis (Value & Volume) 2020 & 2033
- Table 110: Global USA Blueberry Market Volume Kiloton Forecast, by Export Market Analysis (Value & Volume) 2020 & 2033
- Table 111: Global USA Blueberry Market Revenue Million Forecast, by Price Trend Analysis 2020 & 2033
- Table 112: Global USA Blueberry Market Volume Kiloton Forecast, by Price Trend Analysis 2020 & 2033
- Table 113: Global USA Blueberry Market Revenue Million Forecast, by Country 2020 & 2033
- Table 114: Global USA Blueberry Market Volume Kiloton Forecast, by Country 2020 & 2033
- Table 115: China USA Blueberry Market Revenue (Million) Forecast, by Application 2020 & 2033
- Table 116: China USA Blueberry Market Volume (Kiloton) Forecast, by Application 2020 & 2033
- Table 117: India USA Blueberry Market Revenue (Million) Forecast, by Application 2020 & 2033
- Table 118: India USA Blueberry Market Volume (Kiloton) Forecast, by Application 2020 & 2033
- Table 119: Japan USA Blueberry Market Revenue (Million) Forecast, by Application 2020 & 2033
- Table 120: Japan USA Blueberry Market Volume (Kiloton) Forecast, by Application 2020 & 2033
- Table 121: South Korea USA Blueberry Market Revenue (Million) Forecast, by Application 2020 & 2033
- Table 122: South Korea USA Blueberry Market Volume (Kiloton) Forecast, by Application 2020 & 2033
- Table 123: ASEAN USA Blueberry Market Revenue (Million) Forecast, by Application 2020 & 2033
- Table 124: ASEAN USA Blueberry Market Volume (Kiloton) Forecast, by Application 2020 & 2033
- Table 125: Oceania USA Blueberry Market Revenue (Million) Forecast, by Application 2020 & 2033
- Table 126: Oceania USA Blueberry Market Volume (Kiloton) Forecast, by Application 2020 & 2033
- Table 127: Rest of Asia Pacific USA Blueberry Market Revenue (Million) Forecast, by Application 2020 & 2033
- Table 128: Rest of Asia Pacific USA Blueberry Market Volume (Kiloton) Forecast, by Application 2020 & 2033
Frequently Asked Questions
1. What is the projected Compound Annual Growth Rate (CAGR) of the USA Blueberry Market?
The projected CAGR is approximately 2.10%.
2. Which companies are prominent players in the USA Blueberry Market?
Key companies in the market include MBG Marketing, Naturipe Farms , Driscoll's, Ocean Spray Cranberries , Fall Creek Farm & Nursery .
3. What are the main segments of the USA Blueberry Market?
The market segments include Production Analysis, Consumption Analysis, Import Market Analysis (Value & Volume), Export Market Analysis (Value & Volume), Price Trend Analysis.
4. Can you provide details about the market size?
The market size is estimated to be USD XXX Million as of 2022.
5. What are some drivers contributing to market growth?
; Awareness About Health Benefits Associated With Pecan Consumption; Wide Application of Pecan.
6. What are the notable trends driving market growth?
Increasing Blueberry Production to create more Export Opportunities.
7. Are there any restraints impacting market growth?
; Volatility in the Prices; Adverse Weather Conditions Affecting Yield.
8. Can you provide examples of recent developments in the market?
June 2022: According to the USHBC (US Highbush Blueberry Council) forecast, blueberry production in the United States is expected to reach 328,940 metric ton in 2022, an increase of 10.4% from the 297,830 metric ton produced in 2021. Of this volume, 185,700 metric ton are expected to be sold as fresh blueberries and 143,240 metric ton as processed products such as frozen and dried blueberries.
9. What pricing options are available for accessing the report?
Pricing options include single-user, multi-user, and enterprise licenses priced at USD 3800, USD 4500, and USD 5800 respectively.
10. Is the market size provided in terms of value or volume?
The market size is provided in terms of value, measured in Million and volume, measured in Kiloton.
11. Are there any specific market keywords associated with the report?
Yes, the market keyword associated with the report is "USA Blueberry Market," which aids in identifying and referencing the specific market segment covered.
12. How do I determine which pricing option suits my needs best?
The pricing options vary based on user requirements and access needs. Individual users may opt for single-user licenses, while businesses requiring broader access may choose multi-user or enterprise licenses for cost-effective access to the report.
13. Are there any additional resources or data provided in the USA Blueberry Market report?
While the report offers comprehensive insights, it's advisable to review the specific contents or supplementary materials provided to ascertain if additional resources or data are available.
14. How can I stay updated on further developments or reports in the USA Blueberry Market?
To stay informed about further developments, trends, and reports in the USA Blueberry Market, consider subscribing to industry newsletters, following relevant companies and organizations, or regularly checking reputable industry news sources and publications.
Methodology
Step 1 - Identification of Relevant Samples Size from Population Database


Step 2 - Approaches for Defining Global Market Size (Value, Volume* & Price*)

Note*: In applicable scenarios
Step 3 - Data Sources
Primary Research
- Web Analytics
- Survey Reports
- Research Institute
- Latest Research Reports
- Opinion Leaders
Secondary Research
- Annual Reports
- White Paper
- Latest Press Release
- Industry Association
- Paid Database
- Investor Presentations

Step 4 - Data Triangulation
Involves using different sources of information in order to increase the validity of a study
These sources are likely to be stakeholders in a program - participants, other researchers, program staff, other community members, and so on.
Then we put all data in single framework & apply various statistical tools to find out the dynamic on the market.
During the analysis stage, feedback from the stakeholder groups would be compared to determine areas of agreement as well as areas of divergence