

Key Insights
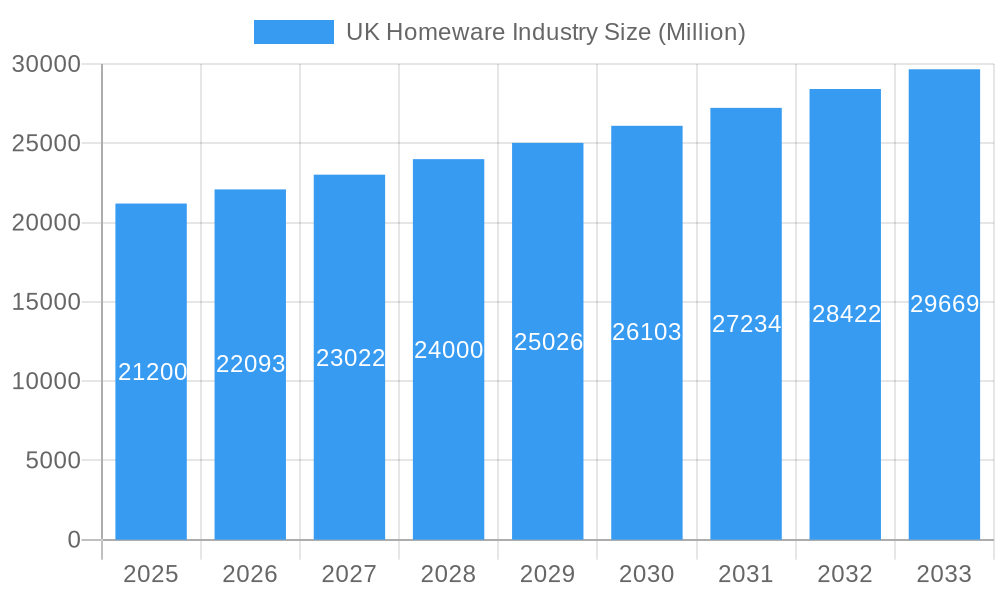
The UK homeware market, valued at £21.20 billion in 2025, is projected to experience steady growth, exhibiting a Compound Annual Growth Rate (CAGR) of 4.17% from 2025 to 2033. This expansion is driven by several key factors. A rising disposable income among UK households fuels increased spending on home improvements and furnishings. The growing popularity of online shopping, facilitated by robust e-commerce platforms, provides convenient access to a wider range of products, boosting market penetration. Furthermore, evolving consumer preferences towards sustainable and ethically sourced homeware contribute to market dynamism. Key segments within the market include home furniture, home textiles, and home appliances, with online distribution channels witnessing significant growth. However, economic uncertainties and potential fluctuations in consumer confidence could act as restraints, potentially impacting market growth trajectories in the coming years. The competitive landscape is populated by both established multinational corporations (like IKEA and Bosch) and specialized retailers (such as Bed Bath and Beyond UK and DFS Furniture PLC), creating a diverse offering catering to varied consumer needs and budgets across England, Wales, Scotland, and Northern Ireland.
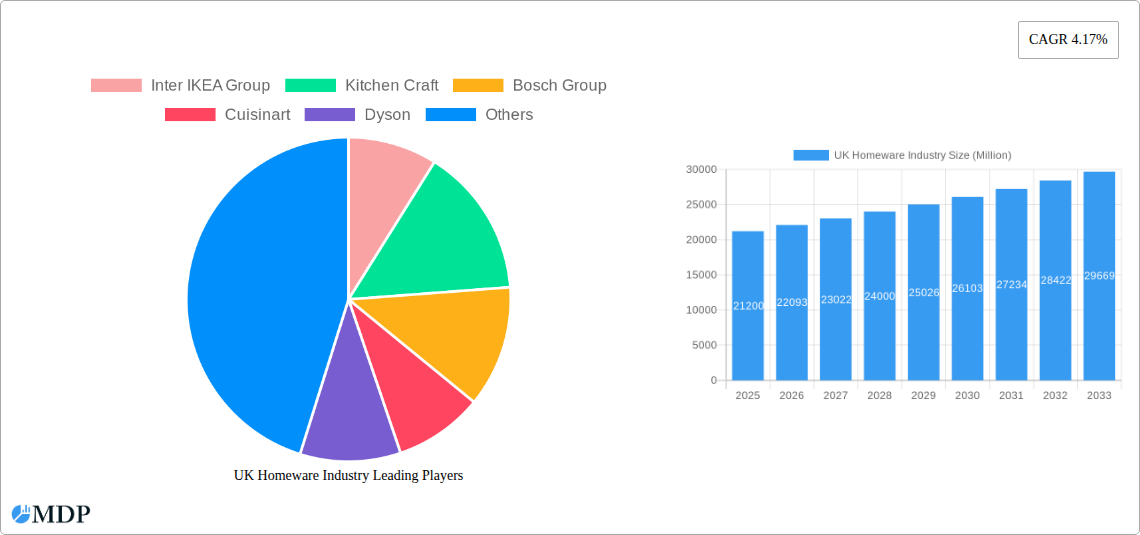
UK Homeware Industry Market Size (In Billion)
The market segmentation reveals significant opportunities for growth within specific niches. The increasing demand for smart home appliances and sustainable, eco-friendly home décor products presents a lucrative segment for manufacturers and retailers. Furthermore, the rise of personalized homeware and the increasing focus on creating comfortable and aesthetically pleasing living spaces drive innovation and diversification within the industry. The concentration of major players indicates a consolidated market, yet smaller, specialized businesses also thrive by catering to niche demands and offering curated selections. This suggests that a strategic focus on specific consumer demographics and product categories, coupled with effective online marketing strategies, will be critical for achieving competitive advantage in this growing market.
UK Homeware Industry Company Market Share
UK Homeware Industry Market Report: 2019-2033
Dive deep into the vibrant UK homeware market with this comprehensive report, providing a detailed analysis of market dynamics, leading players, and future trends. This report covers the period 2019-2033, with a focus on 2025.
Study Period: 2019-2033 Base Year: 2025 Estimated Year: 2025 Forecast Period: 2025-2033 Historical Period: 2019-2024
UK Homeware Industry Market Dynamics & Concentration
This section analyzes the UK homeware market's competitive landscape, including market concentration, innovation, regulations, substitutions, end-user trends, and mergers & acquisitions (M&A) activity. The UK homeware market, valued at £XX Million in 2024, is expected to reach £XX Million by 2033, exhibiting a CAGR of XX%. Market concentration is moderate, with a few dominant players and numerous smaller businesses. Innovation is driven by consumer demand for sustainable, technologically advanced, and aesthetically pleasing products. Stringent regulations regarding product safety and environmental impact influence manufacturers' choices. The market witnesses continuous innovation in materials, designs, and manufacturing processes. Substitutes exist across all product categories (e.g., second-hand furniture, DIY décor). Increasing disposable incomes and evolving lifestyle preferences are key end-user trends. M&A activity has been moderate, with significant acquisitions driving consolidation and expansion. Victoria PLC's acquisitions of IWT and Graniser showcase this trend. The total number of M&A deals in the period 2019-2024 was approximately XX.
- Market Share (2024, estimated): Inter IKEA Group (XX%), DFS Furniture PLC (XX%), Wayfair UK (XX%), Other (XX%).
- M&A Deal Count (2019-2024): XX
- Key Innovation Drivers: Sustainable materials, smart home technology integration, personalized design options.
- Regulatory Frameworks: Product safety standards, environmental regulations (e.g., waste reduction initiatives).
UK Homeware Industry Industry Trends & Analysis
The UK homeware industry is experiencing dynamic shifts, driven by a confluence of burgeoning growth drivers, rapid technological advancements, evolving consumer desires, and a fiercely competitive landscape. The pervasive influence of online retail continues to reshape purchasing habits, while a growing appetite for personalized and bespoke products marks a significant departure from mass-market offerings. Simultaneously, a profound and accelerating commitment to sustainability and ethical sourcing is becoming a non-negotiable aspect for consumers. The reverberations of the COVID-19 pandemic have permanently altered consumer behavior, not only accelerating the migration to e-commerce but also igniting a surge in demand for home improvement and enhancement products. The aesthetic sensibilities of the nation are leaning towards minimalist and sustainable design principles, fostering a fertile ground for innovation in product development. The integration of cutting-edge technologies, such as intelligent smart home devices and immersive augmented reality applications, is actively transforming the entire customer journey, offering unprecedented levels of convenience and engagement. In this vibrant and evolving market, established players are continually challenged by agile online retailers and disruptive new entrants who are pioneering novel products and innovative business models.
- Market Growth Drivers: Escalating disposable incomes, the ongoing trend of urbanization, and a pronounced and growing preference for home improvement and renovation projects are the primary engines propelling market expansion.
- Technological Disruptions: The industry is being fundamentally reshaped by the ubiquitous presence of e-commerce, the transformative capabilities of smart home technology, the potential of 3D printing for bespoke creation, and the immersive experiences offered by AR/VR platforms.
- Consumer Preferences: A strong and unwavering emphasis on sustainability, the desire for personalized products tailored to individual tastes, the demand for seamless convenience, and the perennial pursuit of value for money are paramount in today's consumer landscape.
- Competitive Dynamics: The market is characterized by intense competition, often leading to price wars. Consequently, product differentiation, offering unique value propositions, and a compelling brand identity are crucial for success.
- CAGR (2025-2033): XX%
- Market Penetration of Online Channels (2024): XX%
Leading Markets & Segments in UK Homeware Industry
This section meticulously identifies the leading geographical regions, dominant countries, and key product segments that define the UK homeware industry. The analysis is systematically structured, providing a clear overview based on both product categories and prevailing distribution channels.
By Product:
- Home Furniture: This segment indisputably commands the largest market share, bolstered by a combination of rising disposable incomes and the inherent dynamics of the UK housing market.
- Home Textiles: Demonstrating robust and sustained growth, this segment is fueled by an increasing consumer demand for comfortable, aesthetically pleasing, and stylish home furnishings that enhance living spaces.
- Home Appliances: Benefiting directly from continuous technological advancements and a healthy increase in consumer spending, this segment is witnessing significant uplift, particularly in kitchen and laundry appliances.
- Floor Covering Products: This segment is experiencing considerable growth, a trend directly linked to the ongoing prevalence of home renovation projects and new construction activity. Strategic acquisitions by companies like Victoria PLC underscore their significant dominance in this lucrative area.
- Home Décor Products: Experiencing steady and consistent growth, this segment is primarily driven by the burgeoning personalization trend and a heightened demand for unique, expressive, and statement-making home accessories.
- Other Products (Lighting, Bathroom Accessories, Tableware, etc.): This diverse and encompassing segment exhibits consistent growth, closely mirroring the overall expansion in home improvement expenditure.
By Distribution Channel:
- Online Distribution Channels: This channel has firmly established its dominance, propelled by unparalleled convenience and accessibility. The pandemic further accelerated its ascent, cementing its position as the primary route to market for many consumers.
- Specialty Stores: These retailers continue to retain a significant market share by offering invaluable personalized services, deep specialist product knowledge, and a curated selection that appeals to discerning customers.
- Supermarket and Hypermarkets: These channels provide a broad and accessible avenue for consumers to purchase homeware products, particularly those in the lower to mid-price range, catering to everyday needs.
- Other Distribution Channels: This category encompasses a wide array of retail formats, including independent local retailers, transient but impactful pop-up shops, and established wholesale distributors, all contributing to the market's diverse reach.
UK Homeware Industry Product Developments
The UK homeware sector is abuzz with innovation, marked by the introduction of intelligent smart home appliances that seamlessly integrate connectivity for enhanced convenience. A strong and growing emphasis on sustainability is evident through the innovative use of eco-friendly materials such as recycled plastics and rapidly renewable bamboo. Furthermore, the burgeoning trend of personalization is being met with sophisticated customisation services, allowing consumers to co-create products that truly reflect their individual style and preferences. These pivotal developments are a direct response to an increasingly discerning consumer base that prioritizes not only convenience and eco-consciousness but also the opportunity for authentic self-expression within their homes. The industry is demonstrating remarkable agility in adopting sustainable practices across its operations, while the pervasive integration of technology is revolutionizing the user experience, making homes more intuitive, efficient, and enjoyable.
Key Drivers of UK Homeware Industry Growth
Several factors propel the UK homeware market's growth. Rising disposable incomes allow consumers to spend more on home improvement. Urbanization increases demand for compact and functional homeware. Changing lifestyles see increased focus on home comfort and aesthetics. Government initiatives promoting energy efficiency and sustainable living also influence consumer choices. Technological advancements provide innovative solutions that improve product functionality, convenience, and sustainability.
Challenges in the UK Homeware Industry Market
The industry faces several challenges. Supply chain disruptions impact product availability and costs. Increased competition, both domestically and internationally, intensifies price pressures. Stringent environmental regulations require manufacturers to adopt sustainable practices, raising production costs. Fluctuating raw material prices further strain profitability. Economic downturns can reduce consumer spending on discretionary items like homeware.
Emerging Opportunities in UK Homeware Industry
The future trajectory of the UK homeware industry is poised for significant growth, underpinned by a number of compelling emerging opportunities. The escalating demand for products that are not only sustainable but also ethically sourced presents a substantial and lucrative market avenue, appealing to a growing segment of conscious consumers. Strategic collaborations and partnerships between manufacturers and retailers hold immense potential to streamline supply chain efficiencies, reduce waste, and enhance overall operational effectiveness. Furthermore, exploring and expanding into nascent and developing markets offers a gateway to new customer bases and revenue streams. Crucially, the adept leverage of technology in both product development – for instance, through advanced design software and prototyping – and in fostering deeper customer engagement, including personalized recommendations and immersive online experiences, will remain a key driver of sustained innovation and market expansion.
Leading Players in the UK Homeware Industry Sector
- Inter IKEA Group
- Kitchen Craft
- Bosch Group
- Cuisinart
- Dyson
- Milliken
- Bed Bath and Beyond UK
- DFS Furniture PLC
- Koninklijke Philips NV
- Villeroy and Boch
- Victoria PLC
- Wayfair UK
- Gerflor
Key Milestones in UK Homeware Industry Industry
- February 2022: Victoria PLC significantly bolstered its flooring product portfolio and expanded its market reach with the strategic acquisition of B3 Ceramics Danismanlik (Graniser).
- October 2022: Victoria PLC further solidified its global presence and strengthened its competitive standing by acquiring International Wholesale Tile LLC (IWT), a move that substantially enhanced its market share and product offerings, particularly within the North American region. These strategic acquisitions have played a pivotal role in consolidating Victoria PLC's leadership position within the highly competitive floor covering segment of the UK homeware industry.
Strategic Outlook for UK Homeware Industry Market
The UK homeware market exhibits significant potential for growth, driven by evolving consumer preferences, technological advancements, and economic factors. Strategic partnerships, investments in sustainable practices, and the development of innovative products will be crucial for success. Focusing on e-commerce and personalized customer experiences will be vital for businesses aiming to capture a greater market share in the coming years. The market anticipates continued consolidation and growth through innovation and strategic acquisitions.
UK Homeware Industry Segmentation
-
1. Product
- 1.1. Home Furniture
- 1.2. Home Textiles
- 1.3. Home Appliances
- 1.4. Floor Covering Products
- 1.5. Home Décor Products
- 1.6. Other Pr
-
2. Distribution Channel
- 2.1. Supermarket and Hypermarkets
- 2.2. Specialty Stores
- 2.3. Online Distribution Channels
- 2.4. Other Distribution Channels
UK Homeware Industry Segmentation By Geography
-
1. North America
- 1.1. United States
- 1.2. Canada
- 1.3. Mexico
-
2. South America
- 2.1. Brazil
- 2.2. Argentina
- 2.3. Rest of South America
-
3. Europe
- 3.1. United Kingdom
- 3.2. Germany
- 3.3. France
- 3.4. Italy
- 3.5. Spain
- 3.6. Russia
- 3.7. Benelux
- 3.8. Nordics
- 3.9. Rest of Europe
-
4. Middle East & Africa
- 4.1. Turkey
- 4.2. Israel
- 4.3. GCC
- 4.4. North Africa
- 4.5. South Africa
- 4.6. Rest of Middle East & Africa
-
5. Asia Pacific
- 5.1. China
- 5.2. India
- 5.3. Japan
- 5.4. South Korea
- 5.5. ASEAN
- 5.6. Oceania
- 5.7. Rest of Asia Pacific
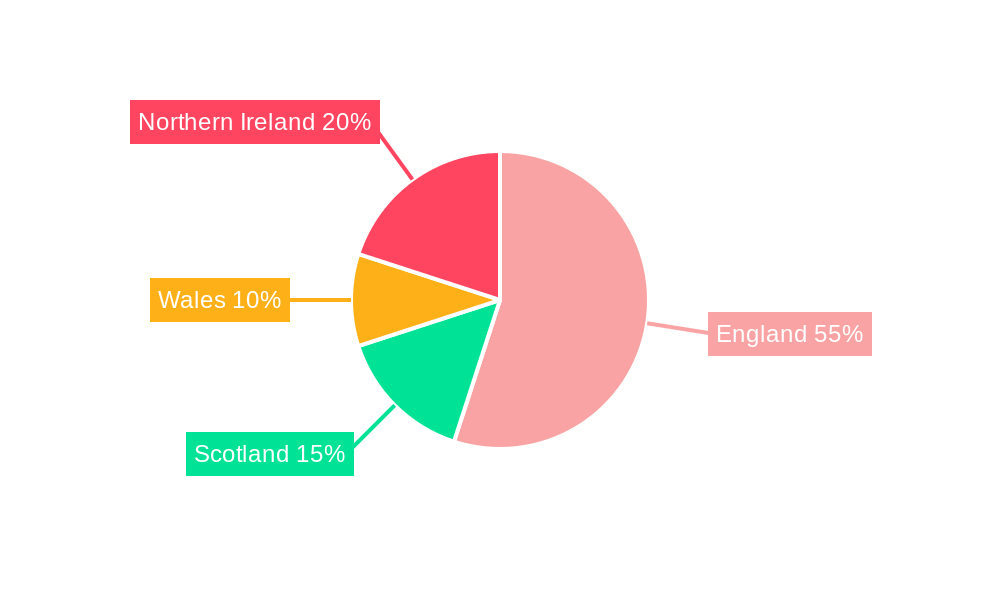
UK Homeware Industry Regional Market Share
Geographic Coverage of UK Homeware Industry
UK Homeware Industry REPORT HIGHLIGHTS
| Aspects | Details |
|---|---|
| Study Period | 2020-2034 |
| Base Year | 2025 |
| Estimated Year | 2026 |
| Forecast Period | 2026-2034 |
| Historical Period | 2020-2025 |
| Growth Rate | CAGR of 4.17% from 2020-2034 |
| Segmentation |
|
Table of Contents
- 1. Introduction
- 1.1. Research Scope
- 1.2. Market Segmentation
- 1.3. Research Objective
- 1.4. Definitions and Assumptions
- 2. Executive Summary
- 2.1. Market Snapshot
- 3. Market Dynamics
- 3.1. Market Drivers
- 3.2. Market Restrains
- 3.3. Market Trends
- 3.4. Market Opportunities
- 4. Market Factor Analysis
- 4.1. Porters Five Forces
- 4.1.1. Bargaining Power of Suppliers
- 4.1.2. Bargaining Power of Buyers
- 4.1.3. Threat of New Entrants
- 4.1.4. Threat of Substitutes
- 4.1.5. Competitive Rivalry
- 4.2. PESTEL analysis
- 4.3. BCG Analysis
- 4.3.1. Stars (High Growth, High Market Share)
- 4.3.2. Cash Cows (Low Growth, High Market Share)
- 4.3.3. Question Mark (High Growth, Low Market Share)
- 4.3.4. Dogs (Low Growth, Low Market Share)
- 4.4. Ansoff Matrix Analysis
- 4.5. Supply Chain Analysis
- 4.6. Regulatory Landscape
- 4.7. Current Market Potential and Opportunity Assessment (TAM–SAM–SOM Framework)
- 4.8. MDP Analyst Note
- 4.1. Porters Five Forces
- 5. Market Analysis, Insights and Forecast 2021-2033
- 5.1. Market Analysis, Insights and Forecast - by Product
- 5.1.1. Home Furniture
- 5.1.2. Home Textiles
- 5.1.3. Home Appliances
- 5.1.4. Floor Covering Products
- 5.1.5. Home Décor Products
- 5.1.6. Other Pr
- 5.2. Market Analysis, Insights and Forecast - by Distribution Channel
- 5.2.1. Supermarket and Hypermarkets
- 5.2.2. Specialty Stores
- 5.2.3. Online Distribution Channels
- 5.2.4. Other Distribution Channels
- 5.3. Market Analysis, Insights and Forecast - by Region
- 5.3.1. North America
- 5.3.2. South America
- 5.3.3. Europe
- 5.3.4. Middle East & Africa
- 5.3.5. Asia Pacific
- 5.1. Market Analysis, Insights and Forecast - by Product
- 6. Global UK Homeware Industry Analysis, Insights and Forecast, 2021-2033
- 6.1. Market Analysis, Insights and Forecast - by Product
- 6.1.1. Home Furniture
- 6.1.2. Home Textiles
- 6.1.3. Home Appliances
- 6.1.4. Floor Covering Products
- 6.1.5. Home Décor Products
- 6.1.6. Other Pr
- 6.2. Market Analysis, Insights and Forecast - by Distribution Channel
- 6.2.1. Supermarket and Hypermarkets
- 6.2.2. Specialty Stores
- 6.2.3. Online Distribution Channels
- 6.2.4. Other Distribution Channels
- 6.1. Market Analysis, Insights and Forecast - by Product
- 7. North America UK Homeware Industry Analysis, Insights and Forecast, 2020-2032
- 7.1. Market Analysis, Insights and Forecast - by Product
- 7.1.1. Home Furniture
- 7.1.2. Home Textiles
- 7.1.3. Home Appliances
- 7.1.4. Floor Covering Products
- 7.1.5. Home Décor Products
- 7.1.6. Other Pr
- 7.2. Market Analysis, Insights and Forecast - by Distribution Channel
- 7.2.1. Supermarket and Hypermarkets
- 7.2.2. Specialty Stores
- 7.2.3. Online Distribution Channels
- 7.2.4. Other Distribution Channels
- 7.1. Market Analysis, Insights and Forecast - by Product
- 8. South America UK Homeware Industry Analysis, Insights and Forecast, 2020-2032
- 8.1. Market Analysis, Insights and Forecast - by Product
- 8.1.1. Home Furniture
- 8.1.2. Home Textiles
- 8.1.3. Home Appliances
- 8.1.4. Floor Covering Products
- 8.1.5. Home Décor Products
- 8.1.6. Other Pr
- 8.2. Market Analysis, Insights and Forecast - by Distribution Channel
- 8.2.1. Supermarket and Hypermarkets
- 8.2.2. Specialty Stores
- 8.2.3. Online Distribution Channels
- 8.2.4. Other Distribution Channels
- 8.1. Market Analysis, Insights and Forecast - by Product
- 9. Europe UK Homeware Industry Analysis, Insights and Forecast, 2020-2032
- 9.1. Market Analysis, Insights and Forecast - by Product
- 9.1.1. Home Furniture
- 9.1.2. Home Textiles
- 9.1.3. Home Appliances
- 9.1.4. Floor Covering Products
- 9.1.5. Home Décor Products
- 9.1.6. Other Pr
- 9.2. Market Analysis, Insights and Forecast - by Distribution Channel
- 9.2.1. Supermarket and Hypermarkets
- 9.2.2. Specialty Stores
- 9.2.3. Online Distribution Channels
- 9.2.4. Other Distribution Channels
- 9.1. Market Analysis, Insights and Forecast - by Product
- 10. Middle East & Africa UK Homeware Industry Analysis, Insights and Forecast, 2020-2032
- 10.1. Market Analysis, Insights and Forecast - by Product
- 10.1.1. Home Furniture
- 10.1.2. Home Textiles
- 10.1.3. Home Appliances
- 10.1.4. Floor Covering Products
- 10.1.5. Home Décor Products
- 10.1.6. Other Pr
- 10.2. Market Analysis, Insights and Forecast - by Distribution Channel
- 10.2.1. Supermarket and Hypermarkets
- 10.2.2. Specialty Stores
- 10.2.3. Online Distribution Channels
- 10.2.4. Other Distribution Channels
- 10.1. Market Analysis, Insights and Forecast - by Product
- 11. Asia Pacific UK Homeware Industry Analysis, Insights and Forecast, 2020-2032
- 11.1. Market Analysis, Insights and Forecast - by Product
- 11.1.1. Home Furniture
- 11.1.2. Home Textiles
- 11.1.3. Home Appliances
- 11.1.4. Floor Covering Products
- 11.1.5. Home Décor Products
- 11.1.6. Other Pr
- 11.2. Market Analysis, Insights and Forecast - by Distribution Channel
- 11.2.1. Supermarket and Hypermarkets
- 11.2.2. Specialty Stores
- 11.2.3. Online Distribution Channels
- 11.2.4. Other Distribution Channels
- 11.1. Market Analysis, Insights and Forecast - by Product
- 12. Competitive Analysis
- 12.1. Company Profiles
- 12.1.1 Inter IKEA Group
- 12.1.1.1. Company Overview
- 12.1.1.2. Products
- 12.1.1.3. Company Financials
- 12.1.1.4. SWOT Analysis
- 12.1.2 Kitchen Craft
- 12.1.2.1. Company Overview
- 12.1.2.2. Products
- 12.1.2.3. Company Financials
- 12.1.2.4. SWOT Analysis
- 12.1.3 Bosch Group
- 12.1.3.1. Company Overview
- 12.1.3.2. Products
- 12.1.3.3. Company Financials
- 12.1.3.4. SWOT Analysis
- 12.1.4 Cuisinart
- 12.1.4.1. Company Overview
- 12.1.4.2. Products
- 12.1.4.3. Company Financials
- 12.1.4.4. SWOT Analysis
- 12.1.5 Dyson
- 12.1.5.1. Company Overview
- 12.1.5.2. Products
- 12.1.5.3. Company Financials
- 12.1.5.4. SWOT Analysis
- 12.1.6 Milliken
- 12.1.6.1. Company Overview
- 12.1.6.2. Products
- 12.1.6.3. Company Financials
- 12.1.6.4. SWOT Analysis
- 12.1.7 Bed Bath and Beyond UK
- 12.1.7.1. Company Overview
- 12.1.7.2. Products
- 12.1.7.3. Company Financials
- 12.1.7.4. SWOT Analysis
- 12.1.8 DFS Furniture PLC
- 12.1.8.1. Company Overview
- 12.1.8.2. Products
- 12.1.8.3. Company Financials
- 12.1.8.4. SWOT Analysis
- 12.1.9 Koninklijke Philips NV
- 12.1.9.1. Company Overview
- 12.1.9.2. Products
- 12.1.9.3. Company Financials
- 12.1.9.4. SWOT Analysis
- 12.1.10 Villeroy and Boch
- 12.1.10.1. Company Overview
- 12.1.10.2. Products
- 12.1.10.3. Company Financials
- 12.1.10.4. SWOT Analysis
- 12.1.11 Victoria PLC
- 12.1.11.1. Company Overview
- 12.1.11.2. Products
- 12.1.11.3. Company Financials
- 12.1.11.4. SWOT Analysis
- 12.1.12 Way Fair UK
- 12.1.12.1. Company Overview
- 12.1.12.2. Products
- 12.1.12.3. Company Financials
- 12.1.12.4. SWOT Analysis
- 12.1.13 Victoria PLC
- 12.1.13.1. Company Overview
- 12.1.13.2. Products
- 12.1.13.3. Company Financials
- 12.1.13.4. SWOT Analysis
- 12.1.14 Gerflor
- 12.1.14.1. Company Overview
- 12.1.14.2. Products
- 12.1.14.3. Company Financials
- 12.1.14.4. SWOT Analysis
- 12.1.1 Inter IKEA Group
- 12.2. Market Entropy
- 12.2.1 Company's Key Areas Served
- 12.2.2 Recent Developments
- 12.3. Company Market Share Analysis 2025
- 12.3.1 Top 5 Companies Market Share Analysis
- 12.3.2 Top 3 Companies Market Share Analysis
- 12.4. List of Potential Customers
- 13. Research Methodology
List of Figures
- Figure 1: Global UK Homeware Industry Revenue Breakdown (Million, %) by Region 2025 & 2033
- Figure 2: Global UK Homeware Industry Volume Breakdown (K Unit, %) by Region 2025 & 2033
- Figure 3: North America UK Homeware Industry Revenue (Million), by Product 2025 & 2033
- Figure 4: North America UK Homeware Industry Volume (K Unit), by Product 2025 & 2033
- Figure 5: North America UK Homeware Industry Revenue Share (%), by Product 2025 & 2033
- Figure 6: North America UK Homeware Industry Volume Share (%), by Product 2025 & 2033
- Figure 7: North America UK Homeware Industry Revenue (Million), by Distribution Channel 2025 & 2033
- Figure 8: North America UK Homeware Industry Volume (K Unit), by Distribution Channel 2025 & 2033
- Figure 9: North America UK Homeware Industry Revenue Share (%), by Distribution Channel 2025 & 2033
- Figure 10: North America UK Homeware Industry Volume Share (%), by Distribution Channel 2025 & 2033
- Figure 11: North America UK Homeware Industry Revenue (Million), by Country 2025 & 2033
- Figure 12: North America UK Homeware Industry Volume (K Unit), by Country 2025 & 2033
- Figure 13: North America UK Homeware Industry Revenue Share (%), by Country 2025 & 2033
- Figure 14: North America UK Homeware Industry Volume Share (%), by Country 2025 & 2033
- Figure 15: South America UK Homeware Industry Revenue (Million), by Product 2025 & 2033
- Figure 16: South America UK Homeware Industry Volume (K Unit), by Product 2025 & 2033
- Figure 17: South America UK Homeware Industry Revenue Share (%), by Product 2025 & 2033
- Figure 18: South America UK Homeware Industry Volume Share (%), by Product 2025 & 2033
- Figure 19: South America UK Homeware Industry Revenue (Million), by Distribution Channel 2025 & 2033
- Figure 20: South America UK Homeware Industry Volume (K Unit), by Distribution Channel 2025 & 2033
- Figure 21: South America UK Homeware Industry Revenue Share (%), by Distribution Channel 2025 & 2033
- Figure 22: South America UK Homeware Industry Volume Share (%), by Distribution Channel 2025 & 2033
- Figure 23: South America UK Homeware Industry Revenue (Million), by Country 2025 & 2033
- Figure 24: South America UK Homeware Industry Volume (K Unit), by Country 2025 & 2033
- Figure 25: South America UK Homeware Industry Revenue Share (%), by Country 2025 & 2033
- Figure 26: South America UK Homeware Industry Volume Share (%), by Country 2025 & 2033
- Figure 27: Europe UK Homeware Industry Revenue (Million), by Product 2025 & 2033
- Figure 28: Europe UK Homeware Industry Volume (K Unit), by Product 2025 & 2033
- Figure 29: Europe UK Homeware Industry Revenue Share (%), by Product 2025 & 2033
- Figure 30: Europe UK Homeware Industry Volume Share (%), by Product 2025 & 2033
- Figure 31: Europe UK Homeware Industry Revenue (Million), by Distribution Channel 2025 & 2033
- Figure 32: Europe UK Homeware Industry Volume (K Unit), by Distribution Channel 2025 & 2033
- Figure 33: Europe UK Homeware Industry Revenue Share (%), by Distribution Channel 2025 & 2033
- Figure 34: Europe UK Homeware Industry Volume Share (%), by Distribution Channel 2025 & 2033
- Figure 35: Europe UK Homeware Industry Revenue (Million), by Country 2025 & 2033
- Figure 36: Europe UK Homeware Industry Volume (K Unit), by Country 2025 & 2033
- Figure 37: Europe UK Homeware Industry Revenue Share (%), by Country 2025 & 2033
- Figure 38: Europe UK Homeware Industry Volume Share (%), by Country 2025 & 2033
- Figure 39: Middle East & Africa UK Homeware Industry Revenue (Million), by Product 2025 & 2033
- Figure 40: Middle East & Africa UK Homeware Industry Volume (K Unit), by Product 2025 & 2033
- Figure 41: Middle East & Africa UK Homeware Industry Revenue Share (%), by Product 2025 & 2033
- Figure 42: Middle East & Africa UK Homeware Industry Volume Share (%), by Product 2025 & 2033
- Figure 43: Middle East & Africa UK Homeware Industry Revenue (Million), by Distribution Channel 2025 & 2033
- Figure 44: Middle East & Africa UK Homeware Industry Volume (K Unit), by Distribution Channel 2025 & 2033
- Figure 45: Middle East & Africa UK Homeware Industry Revenue Share (%), by Distribution Channel 2025 & 2033
- Figure 46: Middle East & Africa UK Homeware Industry Volume Share (%), by Distribution Channel 2025 & 2033
- Figure 47: Middle East & Africa UK Homeware Industry Revenue (Million), by Country 2025 & 2033
- Figure 48: Middle East & Africa UK Homeware Industry Volume (K Unit), by Country 2025 & 2033
- Figure 49: Middle East & Africa UK Homeware Industry Revenue Share (%), by Country 2025 & 2033
- Figure 50: Middle East & Africa UK Homeware Industry Volume Share (%), by Country 2025 & 2033
- Figure 51: Asia Pacific UK Homeware Industry Revenue (Million), by Product 2025 & 2033
- Figure 52: Asia Pacific UK Homeware Industry Volume (K Unit), by Product 2025 & 2033
- Figure 53: Asia Pacific UK Homeware Industry Revenue Share (%), by Product 2025 & 2033
- Figure 54: Asia Pacific UK Homeware Industry Volume Share (%), by Product 2025 & 2033
- Figure 55: Asia Pacific UK Homeware Industry Revenue (Million), by Distribution Channel 2025 & 2033
- Figure 56: Asia Pacific UK Homeware Industry Volume (K Unit), by Distribution Channel 2025 & 2033
- Figure 57: Asia Pacific UK Homeware Industry Revenue Share (%), by Distribution Channel 2025 & 2033
- Figure 58: Asia Pacific UK Homeware Industry Volume Share (%), by Distribution Channel 2025 & 2033
- Figure 59: Asia Pacific UK Homeware Industry Revenue (Million), by Country 2025 & 2033
- Figure 60: Asia Pacific UK Homeware Industry Volume (K Unit), by Country 2025 & 2033
- Figure 61: Asia Pacific UK Homeware Industry Revenue Share (%), by Country 2025 & 2033
- Figure 62: Asia Pacific UK Homeware Industry Volume Share (%), by Country 2025 & 2033
List of Tables
- Table 1: Global UK Homeware Industry Revenue Million Forecast, by Product 2020 & 2033
- Table 2: Global UK Homeware Industry Volume K Unit Forecast, by Product 2020 & 2033
- Table 3: Global UK Homeware Industry Revenue Million Forecast, by Distribution Channel 2020 & 2033
- Table 4: Global UK Homeware Industry Volume K Unit Forecast, by Distribution Channel 2020 & 2033
- Table 5: Global UK Homeware Industry Revenue Million Forecast, by Region 2020 & 2033
- Table 6: Global UK Homeware Industry Volume K Unit Forecast, by Region 2020 & 2033
- Table 7: Global UK Homeware Industry Revenue Million Forecast, by Product 2020 & 2033
- Table 8: Global UK Homeware Industry Volume K Unit Forecast, by Product 2020 & 2033
- Table 9: Global UK Homeware Industry Revenue Million Forecast, by Distribution Channel 2020 & 2033
- Table 10: Global UK Homeware Industry Volume K Unit Forecast, by Distribution Channel 2020 & 2033
- Table 11: Global UK Homeware Industry Revenue Million Forecast, by Country 2020 & 2033
- Table 12: Global UK Homeware Industry Volume K Unit Forecast, by Country 2020 & 2033
- Table 13: United States UK Homeware Industry Revenue (Million) Forecast, by Application 2020 & 2033
- Table 14: United States UK Homeware Industry Volume (K Unit) Forecast, by Application 2020 & 2033
- Table 15: Canada UK Homeware Industry Revenue (Million) Forecast, by Application 2020 & 2033
- Table 16: Canada UK Homeware Industry Volume (K Unit) Forecast, by Application 2020 & 2033
- Table 17: Mexico UK Homeware Industry Revenue (Million) Forecast, by Application 2020 & 2033
- Table 18: Mexico UK Homeware Industry Volume (K Unit) Forecast, by Application 2020 & 2033
- Table 19: Global UK Homeware Industry Revenue Million Forecast, by Product 2020 & 2033
- Table 20: Global UK Homeware Industry Volume K Unit Forecast, by Product 2020 & 2033
- Table 21: Global UK Homeware Industry Revenue Million Forecast, by Distribution Channel 2020 & 2033
- Table 22: Global UK Homeware Industry Volume K Unit Forecast, by Distribution Channel 2020 & 2033
- Table 23: Global UK Homeware Industry Revenue Million Forecast, by Country 2020 & 2033
- Table 24: Global UK Homeware Industry Volume K Unit Forecast, by Country 2020 & 2033
- Table 25: Brazil UK Homeware Industry Revenue (Million) Forecast, by Application 2020 & 2033
- Table 26: Brazil UK Homeware Industry Volume (K Unit) Forecast, by Application 2020 & 2033
- Table 27: Argentina UK Homeware Industry Revenue (Million) Forecast, by Application 2020 & 2033
- Table 28: Argentina UK Homeware Industry Volume (K Unit) Forecast, by Application 2020 & 2033
- Table 29: Rest of South America UK Homeware Industry Revenue (Million) Forecast, by Application 2020 & 2033
- Table 30: Rest of South America UK Homeware Industry Volume (K Unit) Forecast, by Application 2020 & 2033
- Table 31: Global UK Homeware Industry Revenue Million Forecast, by Product 2020 & 2033
- Table 32: Global UK Homeware Industry Volume K Unit Forecast, by Product 2020 & 2033
- Table 33: Global UK Homeware Industry Revenue Million Forecast, by Distribution Channel 2020 & 2033
- Table 34: Global UK Homeware Industry Volume K Unit Forecast, by Distribution Channel 2020 & 2033
- Table 35: Global UK Homeware Industry Revenue Million Forecast, by Country 2020 & 2033
- Table 36: Global UK Homeware Industry Volume K Unit Forecast, by Country 2020 & 2033
- Table 37: United Kingdom UK Homeware Industry Revenue (Million) Forecast, by Application 2020 & 2033
- Table 38: United Kingdom UK Homeware Industry Volume (K Unit) Forecast, by Application 2020 & 2033
- Table 39: Germany UK Homeware Industry Revenue (Million) Forecast, by Application 2020 & 2033
- Table 40: Germany UK Homeware Industry Volume (K Unit) Forecast, by Application 2020 & 2033
- Table 41: France UK Homeware Industry Revenue (Million) Forecast, by Application 2020 & 2033
- Table 42: France UK Homeware Industry Volume (K Unit) Forecast, by Application 2020 & 2033
- Table 43: Italy UK Homeware Industry Revenue (Million) Forecast, by Application 2020 & 2033
- Table 44: Italy UK Homeware Industry Volume (K Unit) Forecast, by Application 2020 & 2033
- Table 45: Spain UK Homeware Industry Revenue (Million) Forecast, by Application 2020 & 2033
- Table 46: Spain UK Homeware Industry Volume (K Unit) Forecast, by Application 2020 & 2033
- Table 47: Russia UK Homeware Industry Revenue (Million) Forecast, by Application 2020 & 2033
- Table 48: Russia UK Homeware Industry Volume (K Unit) Forecast, by Application 2020 & 2033
- Table 49: Benelux UK Homeware Industry Revenue (Million) Forecast, by Application 2020 & 2033
- Table 50: Benelux UK Homeware Industry Volume (K Unit) Forecast, by Application 2020 & 2033
- Table 51: Nordics UK Homeware Industry Revenue (Million) Forecast, by Application 2020 & 2033
- Table 52: Nordics UK Homeware Industry Volume (K Unit) Forecast, by Application 2020 & 2033
- Table 53: Rest of Europe UK Homeware Industry Revenue (Million) Forecast, by Application 2020 & 2033
- Table 54: Rest of Europe UK Homeware Industry Volume (K Unit) Forecast, by Application 2020 & 2033
- Table 55: Global UK Homeware Industry Revenue Million Forecast, by Product 2020 & 2033
- Table 56: Global UK Homeware Industry Volume K Unit Forecast, by Product 2020 & 2033
- Table 57: Global UK Homeware Industry Revenue Million Forecast, by Distribution Channel 2020 & 2033
- Table 58: Global UK Homeware Industry Volume K Unit Forecast, by Distribution Channel 2020 & 2033
- Table 59: Global UK Homeware Industry Revenue Million Forecast, by Country 2020 & 2033
- Table 60: Global UK Homeware Industry Volume K Unit Forecast, by Country 2020 & 2033
- Table 61: Turkey UK Homeware Industry Revenue (Million) Forecast, by Application 2020 & 2033
- Table 62: Turkey UK Homeware Industry Volume (K Unit) Forecast, by Application 2020 & 2033
- Table 63: Israel UK Homeware Industry Revenue (Million) Forecast, by Application 2020 & 2033
- Table 64: Israel UK Homeware Industry Volume (K Unit) Forecast, by Application 2020 & 2033
- Table 65: GCC UK Homeware Industry Revenue (Million) Forecast, by Application 2020 & 2033
- Table 66: GCC UK Homeware Industry Volume (K Unit) Forecast, by Application 2020 & 2033
- Table 67: North Africa UK Homeware Industry Revenue (Million) Forecast, by Application 2020 & 2033
- Table 68: North Africa UK Homeware Industry Volume (K Unit) Forecast, by Application 2020 & 2033
- Table 69: South Africa UK Homeware Industry Revenue (Million) Forecast, by Application 2020 & 2033
- Table 70: South Africa UK Homeware Industry Volume (K Unit) Forecast, by Application 2020 & 2033
- Table 71: Rest of Middle East & Africa UK Homeware Industry Revenue (Million) Forecast, by Application 2020 & 2033
- Table 72: Rest of Middle East & Africa UK Homeware Industry Volume (K Unit) Forecast, by Application 2020 & 2033
- Table 73: Global UK Homeware Industry Revenue Million Forecast, by Product 2020 & 2033
- Table 74: Global UK Homeware Industry Volume K Unit Forecast, by Product 2020 & 2033
- Table 75: Global UK Homeware Industry Revenue Million Forecast, by Distribution Channel 2020 & 2033
- Table 76: Global UK Homeware Industry Volume K Unit Forecast, by Distribution Channel 2020 & 2033
- Table 77: Global UK Homeware Industry Revenue Million Forecast, by Country 2020 & 2033
- Table 78: Global UK Homeware Industry Volume K Unit Forecast, by Country 2020 & 2033
- Table 79: China UK Homeware Industry Revenue (Million) Forecast, by Application 2020 & 2033
- Table 80: China UK Homeware Industry Volume (K Unit) Forecast, by Application 2020 & 2033
- Table 81: India UK Homeware Industry Revenue (Million) Forecast, by Application 2020 & 2033
- Table 82: India UK Homeware Industry Volume (K Unit) Forecast, by Application 2020 & 2033
- Table 83: Japan UK Homeware Industry Revenue (Million) Forecast, by Application 2020 & 2033
- Table 84: Japan UK Homeware Industry Volume (K Unit) Forecast, by Application 2020 & 2033
- Table 85: South Korea UK Homeware Industry Revenue (Million) Forecast, by Application 2020 & 2033
- Table 86: South Korea UK Homeware Industry Volume (K Unit) Forecast, by Application 2020 & 2033
- Table 87: ASEAN UK Homeware Industry Revenue (Million) Forecast, by Application 2020 & 2033
- Table 88: ASEAN UK Homeware Industry Volume (K Unit) Forecast, by Application 2020 & 2033
- Table 89: Oceania UK Homeware Industry Revenue (Million) Forecast, by Application 2020 & 2033
- Table 90: Oceania UK Homeware Industry Volume (K Unit) Forecast, by Application 2020 & 2033
- Table 91: Rest of Asia Pacific UK Homeware Industry Revenue (Million) Forecast, by Application 2020 & 2033
- Table 92: Rest of Asia Pacific UK Homeware Industry Volume (K Unit) Forecast, by Application 2020 & 2033
Frequently Asked Questions
1. What is the projected Compound Annual Growth Rate (CAGR) of the UK Homeware Industry?
The projected CAGR is approximately 4.17%.
2. Which companies are prominent players in the UK Homeware Industry?
Key companies in the market include Inter IKEA Group, Kitchen Craft, Bosch Group, Cuisinart, Dyson, Milliken, Bed Bath and Beyond UK, DFS Furniture PLC, Koninklijke Philips NV, Villeroy and Boch, Victoria PLC, Way Fair UK, Victoria PLC, Gerflor.
3. What are the main segments of the UK Homeware Industry?
The market segments include Product, Distribution Channel.
4. Can you provide details about the market size?
The market size is estimated to be USD 21.20 Million as of 2022.
5. What are some drivers contributing to market growth?
Increase in Restaurants and Food Chains globally; Rise in the share of people opting for vegan and vegetarian foods.
6. What are the notable trends driving market growth?
Increased Spending on Furniture and Appliances is Driving the Market's Growth.
7. Are there any restraints impacting market growth?
Rise in price of electric appliances globally; Rising inflation decreasing the purchasing power.
8. Can you provide examples of recent developments in the market?
October 2022: Victoria PLC, the United Kingdom-based flooring designer, manufacturer, and distributor, announced the acquisition of Florida-based International Wholesale Tile LLC (IWT).
9. What pricing options are available for accessing the report?
Pricing options include single-user, multi-user, and enterprise licenses priced at USD 3800, USD 4500, and USD 5800 respectively.
10. Is the market size provided in terms of value or volume?
The market size is provided in terms of value, measured in Million and volume, measured in K Unit.
11. Are there any specific market keywords associated with the report?
Yes, the market keyword associated with the report is "UK Homeware Industry," which aids in identifying and referencing the specific market segment covered.
12. How do I determine which pricing option suits my needs best?
The pricing options vary based on user requirements and access needs. Individual users may opt for single-user licenses, while businesses requiring broader access may choose multi-user or enterprise licenses for cost-effective access to the report.
13. Are there any additional resources or data provided in the UK Homeware Industry report?
While the report offers comprehensive insights, it's advisable to review the specific contents or supplementary materials provided to ascertain if additional resources or data are available.
14. How can I stay updated on further developments or reports in the UK Homeware Industry?
To stay informed about further developments, trends, and reports in the UK Homeware Industry, consider subscribing to industry newsletters, following relevant companies and organizations, or regularly checking reputable industry news sources and publications.
Methodology
Step 1 - Identification of Relevant Samples Size from Population Database


Step 2 - Approaches for Defining Global Market Size (Value, Volume* & Price*)

Note*: In applicable scenarios
Step 3 - Data Sources
Primary Research
- Web Analytics
- Survey Reports
- Research Institute
- Latest Research Reports
- Opinion Leaders
Secondary Research
- Annual Reports
- White Paper
- Latest Press Release
- Industry Association
- Paid Database
- Investor Presentations

Step 4 - Data Triangulation
Involves using different sources of information in order to increase the validity of a study
These sources are likely to be stakeholders in a program - participants, other researchers, program staff, other community members, and so on.
Then we put all data in single framework & apply various statistical tools to find out the dynamic on the market.
During the analysis stage, feedback from the stakeholder groups would be compared to determine areas of agreement as well as areas of divergence