

Key Insights
The global snack bar market is projected to reach $14.79 billion by 2025, exhibiting a Compound Annual Growth Rate (CAGR) of 8.13% from a base year of 2025. This expansion is propelled by the escalating demand for convenient, on-the-go nutritional solutions driven by increasingly busy lifestyles. Consumers are actively seeking healthier snack alternatives, favoring bars rich in nuts, seeds, fruits, and whole grains. This trend is reinforced by heightened health consciousness and a growing understanding of balanced dietary needs. The market is also characterized by significant product innovation in flavors and formats, with manufacturers diversifying offerings to meet dynamic consumer preferences. Leading companies are investing in R&D for product development and market expansion. Strategic alliances, acquisitions, and product diversification are further contributing to market growth. The competitive environment is fragmented, featuring both major global corporations and specialized niche businesses.
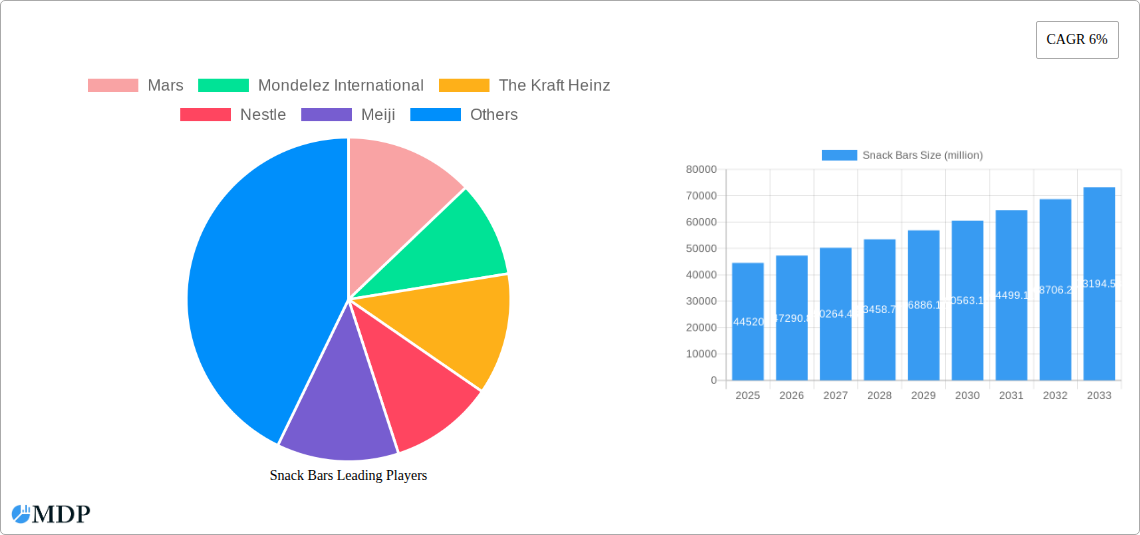
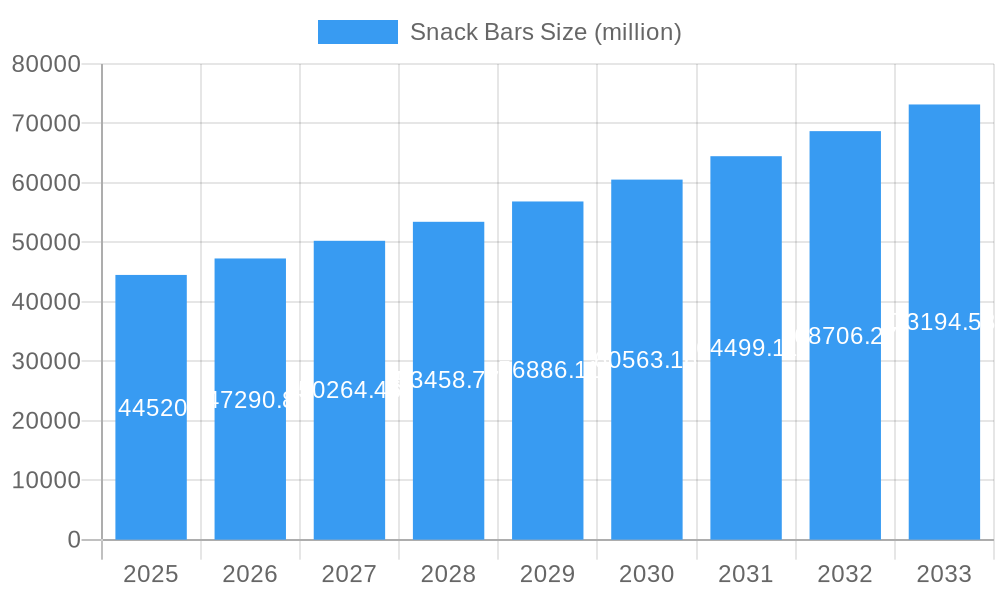
Snack Bars Market Size (In Billion)
Conversely, the market encounters certain limitations. Volatility in raw material costs, especially for ingredients like cocoa and nuts, can affect profitability. Growing consumer apprehension regarding added sugars and artificial ingredients is compelling manufacturers to reformulate products and emphasize natural components. This pivot to clean-label products necessitates substantial R&D investment and may influence production expenses. Heightened consumer awareness of sustainability issues presents both challenges and opportunities, urging manufacturers to prioritize ethical sourcing and environmentally friendly packaging. Despite these hurdles, the snack bar market's outlook remains optimistic, with sustained growth anticipated. Future market dynamics will depend on manufacturers' adaptability to evolving consumer demands, their embrace of innovation, and their commitment to addressing concerns related to health, sustainability, and cost.
Snack Bars Company Market Share
Snack Bars Market Report: 2019-2033 - A Comprehensive Analysis of a Multi-Billion Dollar Industry
This comprehensive report provides an in-depth analysis of the global snack bars market, projecting a value exceeding $XX billion by 2033. It offers crucial insights into market dynamics, key players, and emerging trends, equipping stakeholders with the knowledge needed to navigate this rapidly evolving sector. The report covers the period 2019-2033, with a focus on the estimated year 2025 and a forecast period of 2025-2033. This report is invaluable for investors, manufacturers, distributors, and anyone seeking to understand the complexities and opportunities within the snack bar industry.
Snack Bars Market Dynamics & Concentration
The global snack bar market is characterized by a high level of concentration, with a few major players dominating the landscape. Companies like Mars, Mondelez International, Nestlé, and PepsiCo hold significant market share, collectively accounting for an estimated XX% of the market in 2025. This concentration is driven by substantial brand recognition, established distribution networks, and significant R&D investments. However, smaller players and niche brands are also contributing to market growth, particularly through innovative product offerings and targeted marketing campaigns.
- Market Concentration: High, with top 5 players controlling approximately XX% of the market (2025 estimate).
- Innovation Drivers: Consumer demand for healthier options, functional ingredients, and unique flavor profiles.
- Regulatory Frameworks: Varying regulations across different regions impacting ingredient usage and labeling requirements.
- Product Substitutes: Other convenient snacks, including energy bars, protein bars, and fruit-based snacks.
- End-User Trends: Growing preference for on-the-go snacking, increasing health consciousness, and a shift towards sustainable and ethically sourced products.
- M&A Activities: A moderate number of mergers and acquisitions have occurred in the historical period (2019-2024), with an estimated XX deals recorded. This activity is expected to continue, driven by the desire to expand product portfolios and geographical reach.
Snack Bars Industry Trends & Analysis
The global snack bars market is experiencing robust growth, driven by several key factors. Consumer demand for convenient, portable, and nutritious snacks continues to fuel expansion. The industry has seen a substantial increase in the popularity of healthier options, including gluten-free, vegan, and high-protein bars, with this segment experiencing a CAGR of approximately XX% during the forecast period (2025-2033). Technological advancements in food processing and packaging are further boosting growth.
The market penetration of snack bars, especially in developing economies, is also a significant growth driver. Increased disposable incomes and changing lifestyles are creating new opportunities for snack bar manufacturers. Competitive dynamics are intense, with companies investing heavily in marketing and product innovation to gain market share. The projected market CAGR during 2025-2033 is approximately XX%.
Leading Markets & Segments in Snack Bars
The North American market currently holds the largest share of the global snack bar market, driven by high consumer demand, strong brand presence, and well-established distribution channels. However, significant growth is expected in Asia-Pacific region, particularly in emerging markets like India and China, due to rapidly increasing populations, rising disposable incomes, and changing dietary preferences.
- Key Drivers for North American Dominance:
- Strong brand loyalty
- Established distribution networks
- High consumer spending power
- Innovation in product development.
- Key Drivers for Asia-Pacific Growth:
- Rapidly expanding middle class
- Increased disposable income
- Growing preference for convenient snacks
- Favorable government policies supporting food processing industries.
- Key Segment: The high-protein snack bar segment is experiencing significant growth, fuelled by the increasing popularity of fitness and health-conscious consumers.
Snack Bars Product Developments
Recent years have witnessed significant innovation in snack bar products. Manufacturers are focusing on developing healthier options with added functional ingredients, such as protein, fiber, and vitamins. There is also a trend towards organic and sustainably sourced ingredients. Technological advancements in formulation and processing are enabling the creation of snack bars with improved texture, taste, and shelf life. These innovations are enhancing the appeal of snack bars to a wider range of consumers, driving market growth.
Key Drivers of Snack Bars Growth
The snack bar market's growth is propelled by several key factors:
- Health and Wellness Trends: Increasing consumer awareness of health and nutrition is driving demand for healthier snack options.
- Convenience: Snack bars offer a convenient and portable snacking solution for busy lifestyles.
- Technological Advancements: Innovation in ingredients and processing techniques is leading to new and improved products.
- Economic Growth: Rising disposable incomes in emerging markets are fueling consumption growth.
Challenges in the Snack Bars Market
Several factors are hindering the growth of the snack bar market:
- Increasing Raw Material Costs: Fluctuations in the prices of key ingredients, like nuts and grains, are impacting profitability.
- Intense Competition: The presence of numerous established and emerging players leads to fierce competition.
- Stringent Regulations: Compliance with food safety and labeling regulations adds to operational costs.
Emerging Opportunities in Snack Bars
Several emerging trends offer significant opportunities for growth:
- Functional Snack Bars: The demand for snack bars with functional benefits like increased energy, improved immunity, or better digestion is rising rapidly.
- Sustainable Packaging: Consumers are increasingly demanding eco-friendly packaging, creating opportunities for innovative solutions.
- Expansion in Emerging Markets: Untapped potential exists in developing economies with growing populations and rising middle classes.
Leading Players in the Snack Bars Sector
- Mars
- Mondelez International
- The Kraft Heinz Company
- Nestlé
- Meiji
- Ferrero
- Hershey's
- Lindt
- Glico
- Grupo Arcor
- General Mills
- Haribo
- Lotte Food
- Orion Confectionery
- Kellogg's
- Morinaga
- Pladis Global
- KIND Snacks
- PepsiCo
- Intersnack
- Calbee
- Fujian Yakefood
- Want Want
- Tenwow Food
Key Milestones in Snack Bars Industry
- 2020: Increased focus on plant-based and vegan snack bars.
- 2021: Several major players launched new products with added functional ingredients (protein, fiber).
- 2022: Growing adoption of sustainable packaging solutions.
- 2023: Significant investments in R&D for healthier and more innovative snack bars.
Strategic Outlook for Snack Bars Market
The future of the snack bar market appears promising, with sustained growth expected throughout the forecast period. Strategic partnerships, product diversification, and expansion into new markets will be crucial for success. Companies that successfully adapt to evolving consumer preferences and leverage technological advancements are poised to capture a greater share of this dynamic market. A focus on health, convenience, and sustainability will be paramount for long-term growth and profitability.
Snack Bars Segmentation
-
1. Application
- 1.1. Online Sales
- 1.2. Offline Sales
-
2. Type
- 2.1. Gluten Free Protein Bars
- 2.2. Vegetarian Protein Bars
- 2.3. Others
Snack Bars Segmentation By Geography
-
1. North America
- 1.1. United States
- 1.2. Canada
- 1.3. Mexico
-
2. South America
- 2.1. Brazil
- 2.2. Argentina
- 2.3. Rest of South America
-
3. Europe
- 3.1. United Kingdom
- 3.2. Germany
- 3.3. France
- 3.4. Italy
- 3.5. Spain
- 3.6. Russia
- 3.7. Benelux
- 3.8. Nordics
- 3.9. Rest of Europe
-
4. Middle East & Africa
- 4.1. Turkey
- 4.2. Israel
- 4.3. GCC
- 4.4. North Africa
- 4.5. South Africa
- 4.6. Rest of Middle East & Africa
-
5. Asia Pacific
- 5.1. China
- 5.2. India
- 5.3. Japan
- 5.4. South Korea
- 5.5. ASEAN
- 5.6. Oceania
- 5.7. Rest of Asia Pacific
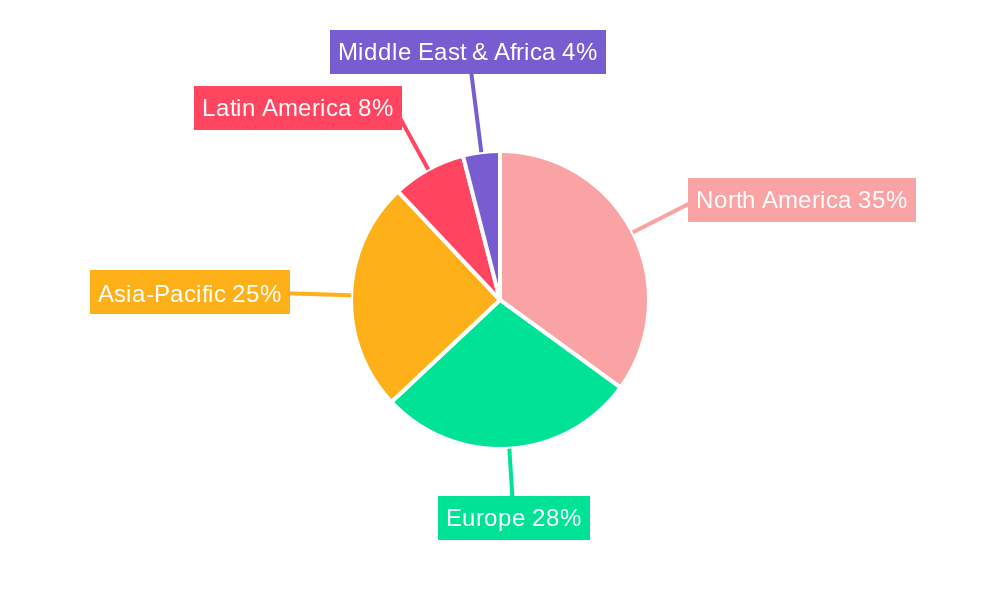
Snack Bars Regional Market Share
Geographic Coverage of Snack Bars
Snack Bars REPORT HIGHLIGHTS
| Aspects | Details |
|---|---|
| Study Period | 2020-2034 |
| Base Year | 2025 |
| Estimated Year | 2026 |
| Forecast Period | 2026-2034 |
| Historical Period | 2020-2025 |
| Growth Rate | CAGR of 8.13% from 2020-2034 |
| Segmentation |
|
Table of Contents
- 1. Introduction
- 1.1. Research Scope
- 1.2. Market Segmentation
- 1.3. Research Methodology
- 1.4. Definitions and Assumptions
- 2. Executive Summary
- 2.1. Introduction
- 3. Market Dynamics
- 3.1. Introduction
- 3.2. Market Drivers
- 3.3. Market Restrains
- 3.4. Market Trends
- 4. Market Factor Analysis
- 4.1. Porters Five Forces
- 4.2. Supply/Value Chain
- 4.3. PESTEL analysis
- 4.4. Market Entropy
- 4.5. Patent/Trademark Analysis
- 5. Global Snack Bars Analysis, Insights and Forecast, 2020-2032
- 5.1. Market Analysis, Insights and Forecast - by Application
- 5.1.1. Online Sales
- 5.1.2. Offline Sales
- 5.2. Market Analysis, Insights and Forecast - by Type
- 5.2.1. Gluten Free Protein Bars
- 5.2.2. Vegetarian Protein Bars
- 5.2.3. Others
- 5.3. Market Analysis, Insights and Forecast - by Region
- 5.3.1. North America
- 5.3.2. South America
- 5.3.3. Europe
- 5.3.4. Middle East & Africa
- 5.3.5. Asia Pacific
- 5.1. Market Analysis, Insights and Forecast - by Application
- 6. North America Snack Bars Analysis, Insights and Forecast, 2020-2032
- 6.1. Market Analysis, Insights and Forecast - by Application
- 6.1.1. Online Sales
- 6.1.2. Offline Sales
- 6.2. Market Analysis, Insights and Forecast - by Type
- 6.2.1. Gluten Free Protein Bars
- 6.2.2. Vegetarian Protein Bars
- 6.2.3. Others
- 6.1. Market Analysis, Insights and Forecast - by Application
- 7. South America Snack Bars Analysis, Insights and Forecast, 2020-2032
- 7.1. Market Analysis, Insights and Forecast - by Application
- 7.1.1. Online Sales
- 7.1.2. Offline Sales
- 7.2. Market Analysis, Insights and Forecast - by Type
- 7.2.1. Gluten Free Protein Bars
- 7.2.2. Vegetarian Protein Bars
- 7.2.3. Others
- 7.1. Market Analysis, Insights and Forecast - by Application
- 8. Europe Snack Bars Analysis, Insights and Forecast, 2020-2032
- 8.1. Market Analysis, Insights and Forecast - by Application
- 8.1.1. Online Sales
- 8.1.2. Offline Sales
- 8.2. Market Analysis, Insights and Forecast - by Type
- 8.2.1. Gluten Free Protein Bars
- 8.2.2. Vegetarian Protein Bars
- 8.2.3. Others
- 8.1. Market Analysis, Insights and Forecast - by Application
- 9. Middle East & Africa Snack Bars Analysis, Insights and Forecast, 2020-2032
- 9.1. Market Analysis, Insights and Forecast - by Application
- 9.1.1. Online Sales
- 9.1.2. Offline Sales
- 9.2. Market Analysis, Insights and Forecast - by Type
- 9.2.1. Gluten Free Protein Bars
- 9.2.2. Vegetarian Protein Bars
- 9.2.3. Others
- 9.1. Market Analysis, Insights and Forecast - by Application
- 10. Asia Pacific Snack Bars Analysis, Insights and Forecast, 2020-2032
- 10.1. Market Analysis, Insights and Forecast - by Application
- 10.1.1. Online Sales
- 10.1.2. Offline Sales
- 10.2. Market Analysis, Insights and Forecast - by Type
- 10.2.1. Gluten Free Protein Bars
- 10.2.2. Vegetarian Protein Bars
- 10.2.3. Others
- 10.1. Market Analysis, Insights and Forecast - by Application
- 11. Competitive Analysis
- 11.1. Global Market Share Analysis 2025
- 11.2. Company Profiles
- 11.2.1 Mars
- 11.2.1.1. Overview
- 11.2.1.2. Products
- 11.2.1.3. SWOT Analysis
- 11.2.1.4. Recent Developments
- 11.2.1.5. Financials (Based on Availability)
- 11.2.2 Mondelez International
- 11.2.2.1. Overview
- 11.2.2.2. Products
- 11.2.2.3. SWOT Analysis
- 11.2.2.4. Recent Developments
- 11.2.2.5. Financials (Based on Availability)
- 11.2.3 The Kraft Heinz
- 11.2.3.1. Overview
- 11.2.3.2. Products
- 11.2.3.3. SWOT Analysis
- 11.2.3.4. Recent Developments
- 11.2.3.5. Financials (Based on Availability)
- 11.2.4 Nestle
- 11.2.4.1. Overview
- 11.2.4.2. Products
- 11.2.4.3. SWOT Analysis
- 11.2.4.4. Recent Developments
- 11.2.4.5. Financials (Based on Availability)
- 11.2.5 Meiji
- 11.2.5.1. Overview
- 11.2.5.2. Products
- 11.2.5.3. SWOT Analysis
- 11.2.5.4. Recent Developments
- 11.2.5.5. Financials (Based on Availability)
- 11.2.6 Ferrero
- 11.2.6.1. Overview
- 11.2.6.2. Products
- 11.2.6.3. SWOT Analysis
- 11.2.6.4. Recent Developments
- 11.2.6.5. Financials (Based on Availability)
- 11.2.7 Hershey
- 11.2.7.1. Overview
- 11.2.7.2. Products
- 11.2.7.3. SWOT Analysis
- 11.2.7.4. Recent Developments
- 11.2.7.5. Financials (Based on Availability)
- 11.2.8 Lindt
- 11.2.8.1. Overview
- 11.2.8.2. Products
- 11.2.8.3. SWOT Analysis
- 11.2.8.4. Recent Developments
- 11.2.8.5. Financials (Based on Availability)
- 11.2.9 Glico
- 11.2.9.1. Overview
- 11.2.9.2. Products
- 11.2.9.3. SWOT Analysis
- 11.2.9.4. Recent Developments
- 11.2.9.5. Financials (Based on Availability)
- 11.2.10 Grupo Arcor
- 11.2.10.1. Overview
- 11.2.10.2. Products
- 11.2.10.3. SWOT Analysis
- 11.2.10.4. Recent Developments
- 11.2.10.5. Financials (Based on Availability)
- 11.2.11 General Mills
- 11.2.11.1. Overview
- 11.2.11.2. Products
- 11.2.11.3. SWOT Analysis
- 11.2.11.4. Recent Developments
- 11.2.11.5. Financials (Based on Availability)
- 11.2.12 Haribo
- 11.2.12.1. Overview
- 11.2.12.2. Products
- 11.2.12.3. SWOT Analysis
- 11.2.12.4. Recent Developments
- 11.2.12.5. Financials (Based on Availability)
- 11.2.13 Lotte Food
- 11.2.13.1. Overview
- 11.2.13.2. Products
- 11.2.13.3. SWOT Analysis
- 11.2.13.4. Recent Developments
- 11.2.13.5. Financials (Based on Availability)
- 11.2.14 Orion Confectionery
- 11.2.14.1. Overview
- 11.2.14.2. Products
- 11.2.14.3. SWOT Analysis
- 11.2.14.4. Recent Developments
- 11.2.14.5. Financials (Based on Availability)
- 11.2.15 Kellogg's
- 11.2.15.1. Overview
- 11.2.15.2. Products
- 11.2.15.3. SWOT Analysis
- 11.2.15.4. Recent Developments
- 11.2.15.5. Financials (Based on Availability)
- 11.2.16 Morinaga
- 11.2.16.1. Overview
- 11.2.16.2. Products
- 11.2.16.3. SWOT Analysis
- 11.2.16.4. Recent Developments
- 11.2.16.5. Financials (Based on Availability)
- 11.2.17 Pladis Global
- 11.2.17.1. Overview
- 11.2.17.2. Products
- 11.2.17.3. SWOT Analysis
- 11.2.17.4. Recent Developments
- 11.2.17.5. Financials (Based on Availability)
- 11.2.18 KIND Snacks
- 11.2.18.1. Overview
- 11.2.18.2. Products
- 11.2.18.3. SWOT Analysis
- 11.2.18.4. Recent Developments
- 11.2.18.5. Financials (Based on Availability)
- 11.2.19 PepsiCo
- 11.2.19.1. Overview
- 11.2.19.2. Products
- 11.2.19.3. SWOT Analysis
- 11.2.19.4. Recent Developments
- 11.2.19.5. Financials (Based on Availability)
- 11.2.20 Intersnack
- 11.2.20.1. Overview
- 11.2.20.2. Products
- 11.2.20.3. SWOT Analysis
- 11.2.20.4. Recent Developments
- 11.2.20.5. Financials (Based on Availability)
- 11.2.21 Calbee
- 11.2.21.1. Overview
- 11.2.21.2. Products
- 11.2.21.3. SWOT Analysis
- 11.2.21.4. Recent Developments
- 11.2.21.5. Financials (Based on Availability)
- 11.2.22 Fujian Yakefood
- 11.2.22.1. Overview
- 11.2.22.2. Products
- 11.2.22.3. SWOT Analysis
- 11.2.22.4. Recent Developments
- 11.2.22.5. Financials (Based on Availability)
- 11.2.23 Want Want
- 11.2.23.1. Overview
- 11.2.23.2. Products
- 11.2.23.3. SWOT Analysis
- 11.2.23.4. Recent Developments
- 11.2.23.5. Financials (Based on Availability)
- 11.2.24 Tenwow Food
- 11.2.24.1. Overview
- 11.2.24.2. Products
- 11.2.24.3. SWOT Analysis
- 11.2.24.4. Recent Developments
- 11.2.24.5. Financials (Based on Availability)
- 11.2.1 Mars
List of Figures
- Figure 1: Global Snack Bars Revenue Breakdown (billion, %) by Region 2025 & 2033
- Figure 2: Global Snack Bars Volume Breakdown (K, %) by Region 2025 & 2033
- Figure 3: North America Snack Bars Revenue (billion), by Application 2025 & 2033
- Figure 4: North America Snack Bars Volume (K), by Application 2025 & 2033
- Figure 5: North America Snack Bars Revenue Share (%), by Application 2025 & 2033
- Figure 6: North America Snack Bars Volume Share (%), by Application 2025 & 2033
- Figure 7: North America Snack Bars Revenue (billion), by Type 2025 & 2033
- Figure 8: North America Snack Bars Volume (K), by Type 2025 & 2033
- Figure 9: North America Snack Bars Revenue Share (%), by Type 2025 & 2033
- Figure 10: North America Snack Bars Volume Share (%), by Type 2025 & 2033
- Figure 11: North America Snack Bars Revenue (billion), by Country 2025 & 2033
- Figure 12: North America Snack Bars Volume (K), by Country 2025 & 2033
- Figure 13: North America Snack Bars Revenue Share (%), by Country 2025 & 2033
- Figure 14: North America Snack Bars Volume Share (%), by Country 2025 & 2033
- Figure 15: South America Snack Bars Revenue (billion), by Application 2025 & 2033
- Figure 16: South America Snack Bars Volume (K), by Application 2025 & 2033
- Figure 17: South America Snack Bars Revenue Share (%), by Application 2025 & 2033
- Figure 18: South America Snack Bars Volume Share (%), by Application 2025 & 2033
- Figure 19: South America Snack Bars Revenue (billion), by Type 2025 & 2033
- Figure 20: South America Snack Bars Volume (K), by Type 2025 & 2033
- Figure 21: South America Snack Bars Revenue Share (%), by Type 2025 & 2033
- Figure 22: South America Snack Bars Volume Share (%), by Type 2025 & 2033
- Figure 23: South America Snack Bars Revenue (billion), by Country 2025 & 2033
- Figure 24: South America Snack Bars Volume (K), by Country 2025 & 2033
- Figure 25: South America Snack Bars Revenue Share (%), by Country 2025 & 2033
- Figure 26: South America Snack Bars Volume Share (%), by Country 2025 & 2033
- Figure 27: Europe Snack Bars Revenue (billion), by Application 2025 & 2033
- Figure 28: Europe Snack Bars Volume (K), by Application 2025 & 2033
- Figure 29: Europe Snack Bars Revenue Share (%), by Application 2025 & 2033
- Figure 30: Europe Snack Bars Volume Share (%), by Application 2025 & 2033
- Figure 31: Europe Snack Bars Revenue (billion), by Type 2025 & 2033
- Figure 32: Europe Snack Bars Volume (K), by Type 2025 & 2033
- Figure 33: Europe Snack Bars Revenue Share (%), by Type 2025 & 2033
- Figure 34: Europe Snack Bars Volume Share (%), by Type 2025 & 2033
- Figure 35: Europe Snack Bars Revenue (billion), by Country 2025 & 2033
- Figure 36: Europe Snack Bars Volume (K), by Country 2025 & 2033
- Figure 37: Europe Snack Bars Revenue Share (%), by Country 2025 & 2033
- Figure 38: Europe Snack Bars Volume Share (%), by Country 2025 & 2033
- Figure 39: Middle East & Africa Snack Bars Revenue (billion), by Application 2025 & 2033
- Figure 40: Middle East & Africa Snack Bars Volume (K), by Application 2025 & 2033
- Figure 41: Middle East & Africa Snack Bars Revenue Share (%), by Application 2025 & 2033
- Figure 42: Middle East & Africa Snack Bars Volume Share (%), by Application 2025 & 2033
- Figure 43: Middle East & Africa Snack Bars Revenue (billion), by Type 2025 & 2033
- Figure 44: Middle East & Africa Snack Bars Volume (K), by Type 2025 & 2033
- Figure 45: Middle East & Africa Snack Bars Revenue Share (%), by Type 2025 & 2033
- Figure 46: Middle East & Africa Snack Bars Volume Share (%), by Type 2025 & 2033
- Figure 47: Middle East & Africa Snack Bars Revenue (billion), by Country 2025 & 2033
- Figure 48: Middle East & Africa Snack Bars Volume (K), by Country 2025 & 2033
- Figure 49: Middle East & Africa Snack Bars Revenue Share (%), by Country 2025 & 2033
- Figure 50: Middle East & Africa Snack Bars Volume Share (%), by Country 2025 & 2033
- Figure 51: Asia Pacific Snack Bars Revenue (billion), by Application 2025 & 2033
- Figure 52: Asia Pacific Snack Bars Volume (K), by Application 2025 & 2033
- Figure 53: Asia Pacific Snack Bars Revenue Share (%), by Application 2025 & 2033
- Figure 54: Asia Pacific Snack Bars Volume Share (%), by Application 2025 & 2033
- Figure 55: Asia Pacific Snack Bars Revenue (billion), by Type 2025 & 2033
- Figure 56: Asia Pacific Snack Bars Volume (K), by Type 2025 & 2033
- Figure 57: Asia Pacific Snack Bars Revenue Share (%), by Type 2025 & 2033
- Figure 58: Asia Pacific Snack Bars Volume Share (%), by Type 2025 & 2033
- Figure 59: Asia Pacific Snack Bars Revenue (billion), by Country 2025 & 2033
- Figure 60: Asia Pacific Snack Bars Volume (K), by Country 2025 & 2033
- Figure 61: Asia Pacific Snack Bars Revenue Share (%), by Country 2025 & 2033
- Figure 62: Asia Pacific Snack Bars Volume Share (%), by Country 2025 & 2033
List of Tables
- Table 1: Global Snack Bars Revenue billion Forecast, by Application 2020 & 2033
- Table 2: Global Snack Bars Volume K Forecast, by Application 2020 & 2033
- Table 3: Global Snack Bars Revenue billion Forecast, by Type 2020 & 2033
- Table 4: Global Snack Bars Volume K Forecast, by Type 2020 & 2033
- Table 5: Global Snack Bars Revenue billion Forecast, by Region 2020 & 2033
- Table 6: Global Snack Bars Volume K Forecast, by Region 2020 & 2033
- Table 7: Global Snack Bars Revenue billion Forecast, by Application 2020 & 2033
- Table 8: Global Snack Bars Volume K Forecast, by Application 2020 & 2033
- Table 9: Global Snack Bars Revenue billion Forecast, by Type 2020 & 2033
- Table 10: Global Snack Bars Volume K Forecast, by Type 2020 & 2033
- Table 11: Global Snack Bars Revenue billion Forecast, by Country 2020 & 2033
- Table 12: Global Snack Bars Volume K Forecast, by Country 2020 & 2033
- Table 13: United States Snack Bars Revenue (billion) Forecast, by Application 2020 & 2033
- Table 14: United States Snack Bars Volume (K) Forecast, by Application 2020 & 2033
- Table 15: Canada Snack Bars Revenue (billion) Forecast, by Application 2020 & 2033
- Table 16: Canada Snack Bars Volume (K) Forecast, by Application 2020 & 2033
- Table 17: Mexico Snack Bars Revenue (billion) Forecast, by Application 2020 & 2033
- Table 18: Mexico Snack Bars Volume (K) Forecast, by Application 2020 & 2033
- Table 19: Global Snack Bars Revenue billion Forecast, by Application 2020 & 2033
- Table 20: Global Snack Bars Volume K Forecast, by Application 2020 & 2033
- Table 21: Global Snack Bars Revenue billion Forecast, by Type 2020 & 2033
- Table 22: Global Snack Bars Volume K Forecast, by Type 2020 & 2033
- Table 23: Global Snack Bars Revenue billion Forecast, by Country 2020 & 2033
- Table 24: Global Snack Bars Volume K Forecast, by Country 2020 & 2033
- Table 25: Brazil Snack Bars Revenue (billion) Forecast, by Application 2020 & 2033
- Table 26: Brazil Snack Bars Volume (K) Forecast, by Application 2020 & 2033
- Table 27: Argentina Snack Bars Revenue (billion) Forecast, by Application 2020 & 2033
- Table 28: Argentina Snack Bars Volume (K) Forecast, by Application 2020 & 2033
- Table 29: Rest of South America Snack Bars Revenue (billion) Forecast, by Application 2020 & 2033
- Table 30: Rest of South America Snack Bars Volume (K) Forecast, by Application 2020 & 2033
- Table 31: Global Snack Bars Revenue billion Forecast, by Application 2020 & 2033
- Table 32: Global Snack Bars Volume K Forecast, by Application 2020 & 2033
- Table 33: Global Snack Bars Revenue billion Forecast, by Type 2020 & 2033
- Table 34: Global Snack Bars Volume K Forecast, by Type 2020 & 2033
- Table 35: Global Snack Bars Revenue billion Forecast, by Country 2020 & 2033
- Table 36: Global Snack Bars Volume K Forecast, by Country 2020 & 2033
- Table 37: United Kingdom Snack Bars Revenue (billion) Forecast, by Application 2020 & 2033
- Table 38: United Kingdom Snack Bars Volume (K) Forecast, by Application 2020 & 2033
- Table 39: Germany Snack Bars Revenue (billion) Forecast, by Application 2020 & 2033
- Table 40: Germany Snack Bars Volume (K) Forecast, by Application 2020 & 2033
- Table 41: France Snack Bars Revenue (billion) Forecast, by Application 2020 & 2033
- Table 42: France Snack Bars Volume (K) Forecast, by Application 2020 & 2033
- Table 43: Italy Snack Bars Revenue (billion) Forecast, by Application 2020 & 2033
- Table 44: Italy Snack Bars Volume (K) Forecast, by Application 2020 & 2033
- Table 45: Spain Snack Bars Revenue (billion) Forecast, by Application 2020 & 2033
- Table 46: Spain Snack Bars Volume (K) Forecast, by Application 2020 & 2033
- Table 47: Russia Snack Bars Revenue (billion) Forecast, by Application 2020 & 2033
- Table 48: Russia Snack Bars Volume (K) Forecast, by Application 2020 & 2033
- Table 49: Benelux Snack Bars Revenue (billion) Forecast, by Application 2020 & 2033
- Table 50: Benelux Snack Bars Volume (K) Forecast, by Application 2020 & 2033
- Table 51: Nordics Snack Bars Revenue (billion) Forecast, by Application 2020 & 2033
- Table 52: Nordics Snack Bars Volume (K) Forecast, by Application 2020 & 2033
- Table 53: Rest of Europe Snack Bars Revenue (billion) Forecast, by Application 2020 & 2033
- Table 54: Rest of Europe Snack Bars Volume (K) Forecast, by Application 2020 & 2033
- Table 55: Global Snack Bars Revenue billion Forecast, by Application 2020 & 2033
- Table 56: Global Snack Bars Volume K Forecast, by Application 2020 & 2033
- Table 57: Global Snack Bars Revenue billion Forecast, by Type 2020 & 2033
- Table 58: Global Snack Bars Volume K Forecast, by Type 2020 & 2033
- Table 59: Global Snack Bars Revenue billion Forecast, by Country 2020 & 2033
- Table 60: Global Snack Bars Volume K Forecast, by Country 2020 & 2033
- Table 61: Turkey Snack Bars Revenue (billion) Forecast, by Application 2020 & 2033
- Table 62: Turkey Snack Bars Volume (K) Forecast, by Application 2020 & 2033
- Table 63: Israel Snack Bars Revenue (billion) Forecast, by Application 2020 & 2033
- Table 64: Israel Snack Bars Volume (K) Forecast, by Application 2020 & 2033
- Table 65: GCC Snack Bars Revenue (billion) Forecast, by Application 2020 & 2033
- Table 66: GCC Snack Bars Volume (K) Forecast, by Application 2020 & 2033
- Table 67: North Africa Snack Bars Revenue (billion) Forecast, by Application 2020 & 2033
- Table 68: North Africa Snack Bars Volume (K) Forecast, by Application 2020 & 2033
- Table 69: South Africa Snack Bars Revenue (billion) Forecast, by Application 2020 & 2033
- Table 70: South Africa Snack Bars Volume (K) Forecast, by Application 2020 & 2033
- Table 71: Rest of Middle East & Africa Snack Bars Revenue (billion) Forecast, by Application 2020 & 2033
- Table 72: Rest of Middle East & Africa Snack Bars Volume (K) Forecast, by Application 2020 & 2033
- Table 73: Global Snack Bars Revenue billion Forecast, by Application 2020 & 2033
- Table 74: Global Snack Bars Volume K Forecast, by Application 2020 & 2033
- Table 75: Global Snack Bars Revenue billion Forecast, by Type 2020 & 2033
- Table 76: Global Snack Bars Volume K Forecast, by Type 2020 & 2033
- Table 77: Global Snack Bars Revenue billion Forecast, by Country 2020 & 2033
- Table 78: Global Snack Bars Volume K Forecast, by Country 2020 & 2033
- Table 79: China Snack Bars Revenue (billion) Forecast, by Application 2020 & 2033
- Table 80: China Snack Bars Volume (K) Forecast, by Application 2020 & 2033
- Table 81: India Snack Bars Revenue (billion) Forecast, by Application 2020 & 2033
- Table 82: India Snack Bars Volume (K) Forecast, by Application 2020 & 2033
- Table 83: Japan Snack Bars Revenue (billion) Forecast, by Application 2020 & 2033
- Table 84: Japan Snack Bars Volume (K) Forecast, by Application 2020 & 2033
- Table 85: South Korea Snack Bars Revenue (billion) Forecast, by Application 2020 & 2033
- Table 86: South Korea Snack Bars Volume (K) Forecast, by Application 2020 & 2033
- Table 87: ASEAN Snack Bars Revenue (billion) Forecast, by Application 2020 & 2033
- Table 88: ASEAN Snack Bars Volume (K) Forecast, by Application 2020 & 2033
- Table 89: Oceania Snack Bars Revenue (billion) Forecast, by Application 2020 & 2033
- Table 90: Oceania Snack Bars Volume (K) Forecast, by Application 2020 & 2033
- Table 91: Rest of Asia Pacific Snack Bars Revenue (billion) Forecast, by Application 2020 & 2033
- Table 92: Rest of Asia Pacific Snack Bars Volume (K) Forecast, by Application 2020 & 2033
Frequently Asked Questions
1. What is the projected Compound Annual Growth Rate (CAGR) of the Snack Bars?
The projected CAGR is approximately 8.13%.
2. Which companies are prominent players in the Snack Bars?
Key companies in the market include Mars, Mondelez International, The Kraft Heinz, Nestle, Meiji, Ferrero, Hershey, Lindt, Glico, Grupo Arcor, General Mills, Haribo, Lotte Food, Orion Confectionery, Kellogg's, Morinaga, Pladis Global, KIND Snacks, PepsiCo, Intersnack, Calbee, Fujian Yakefood, Want Want, Tenwow Food.
3. What are the main segments of the Snack Bars?
The market segments include Application, Type.
4. Can you provide details about the market size?
The market size is estimated to be USD 14.79 billion as of 2022.
5. What are some drivers contributing to market growth?
N/A
6. What are the notable trends driving market growth?
N/A
7. Are there any restraints impacting market growth?
N/A
8. Can you provide examples of recent developments in the market?
N/A
9. What pricing options are available for accessing the report?
Pricing options include single-user, multi-user, and enterprise licenses priced at USD 3950.00, USD 5925.00, and USD 7900.00 respectively.
10. Is the market size provided in terms of value or volume?
The market size is provided in terms of value, measured in billion and volume, measured in K.
11. Are there any specific market keywords associated with the report?
Yes, the market keyword associated with the report is "Snack Bars," which aids in identifying and referencing the specific market segment covered.
12. How do I determine which pricing option suits my needs best?
The pricing options vary based on user requirements and access needs. Individual users may opt for single-user licenses, while businesses requiring broader access may choose multi-user or enterprise licenses for cost-effective access to the report.
13. Are there any additional resources or data provided in the Snack Bars report?
While the report offers comprehensive insights, it's advisable to review the specific contents or supplementary materials provided to ascertain if additional resources or data are available.
14. How can I stay updated on further developments or reports in the Snack Bars?
To stay informed about further developments, trends, and reports in the Snack Bars, consider subscribing to industry newsletters, following relevant companies and organizations, or regularly checking reputable industry news sources and publications.
Methodology
Step 1 - Identification of Relevant Samples Size from Population Database


Step 2 - Approaches for Defining Global Market Size (Value, Volume* & Price*)

Note*: In applicable scenarios
Step 3 - Data Sources
Primary Research
- Web Analytics
- Survey Reports
- Research Institute
- Latest Research Reports
- Opinion Leaders
Secondary Research
- Annual Reports
- White Paper
- Latest Press Release
- Industry Association
- Paid Database
- Investor Presentations

Step 4 - Data Triangulation
Involves using different sources of information in order to increase the validity of a study
These sources are likely to be stakeholders in a program - participants, other researchers, program staff, other community members, and so on.
Then we put all data in single framework & apply various statistical tools to find out the dynamic on the market.
During the analysis stage, feedback from the stakeholder groups would be compared to determine areas of agreement as well as areas of divergence