

Key Insights
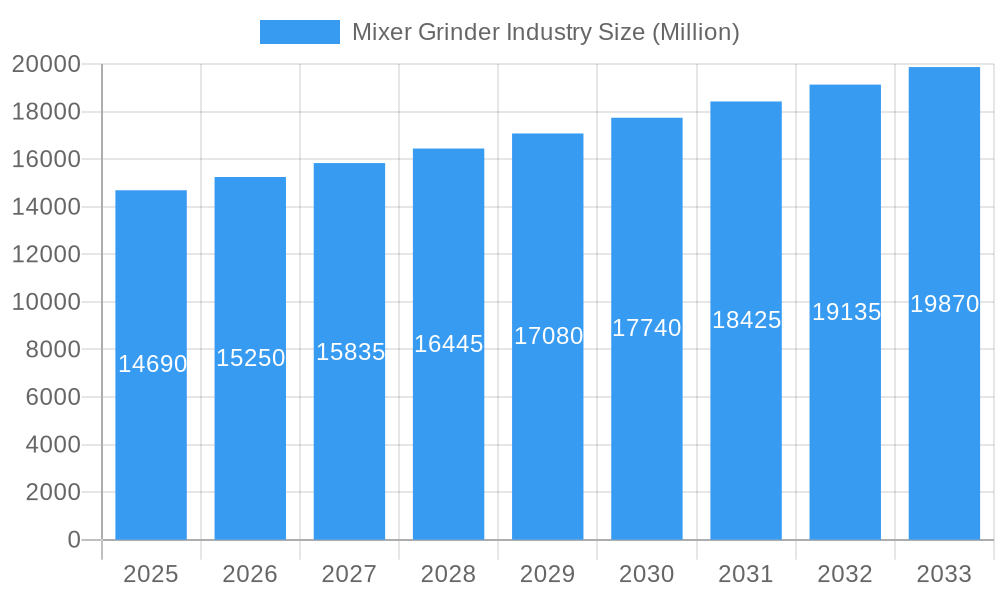
The global mixer grinder market, valued at $14.69 billion in 2025, is projected to experience steady growth, driven by increasing urbanization, changing lifestyles, and a rising preference for convenient kitchen appliances. The 3.71% CAGR from 2019 to 2024 indicates a consistent demand, fueled by factors such as rising disposable incomes in developing economies and the growing popularity of home cooking. The market segmentation reveals strong demand across both residential and commercial sectors, with stand mixers and traditional mixers catering to diverse consumer needs. Multi-brand stores currently dominate the distribution channels, although online sales are anticipated to gain significant traction in the forecast period (2025-2033) due to increased internet penetration and e-commerce expansion. Key players like Panasonic, Whirlpool, LG, and others are constantly innovating to enhance product features, such as increased power, durability, and user-friendly designs, further stimulating market growth. However, factors such as the fluctuating prices of raw materials and increasing competition could potentially pose challenges to market expansion. The regional breakdown suggests strong performance in North America and Asia Pacific, driven by high consumer spending and a significant population base.
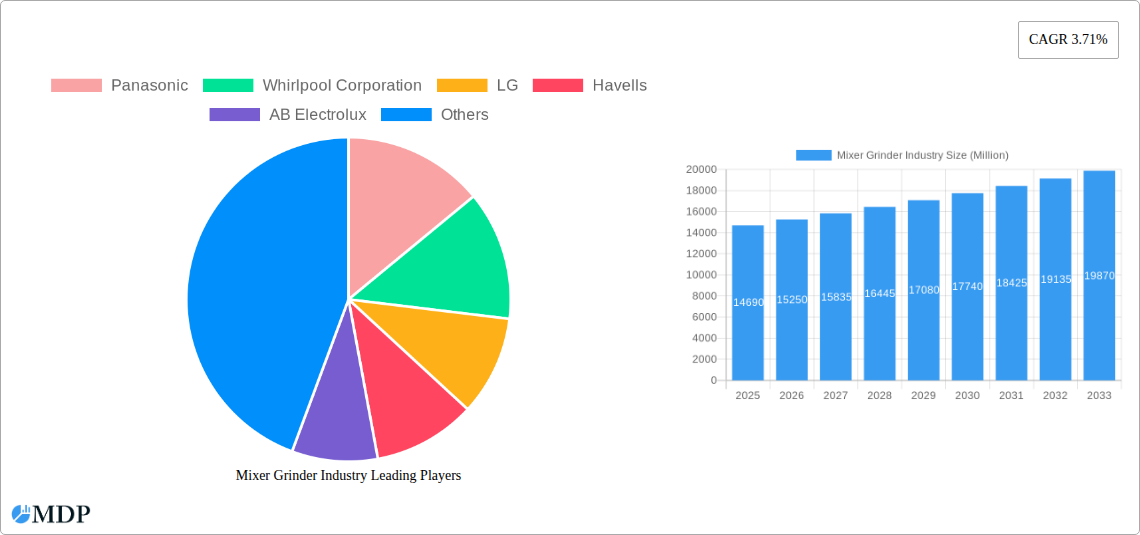
Mixer Grinder Industry Market Size (In Billion)
The forecast period (2025-2033) presents opportunities for market expansion through strategic collaborations, product diversification, and targeted marketing campaigns focused on specific demographics and geographic locations. Companies are likely to focus on developing energy-efficient and technologically advanced mixer grinders to meet evolving consumer preferences. Furthermore, growth in the food processing industry and increasing demand for healthy and quick meal preparation are expected to boost demand. Penetration in under-served markets, particularly in developing regions, coupled with the expansion of e-commerce platforms, presents significant potential for growth. While challenges remain, the inherent functionality of mixer grinders and evolving lifestyles are expected to drive consistent, if moderate, growth in the coming years.
Mixer Grinder Industry Company Market Share
Mixer Grinder Industry Market Report: 2019-2033
Dive deep into the comprehensive analysis of the Mixer Grinder Industry, covering market dynamics, leading players, emerging trends, and future projections from 2019 to 2033. This report provides actionable insights for industry stakeholders, investors, and market entrants, equipping them with a strategic advantage in this dynamic market. The report uses 2025 as the base and estimated year and covers the historical period (2019-2024) and forecast period (2025-2033). The global market size is estimated at xx Million in 2025 and is projected to reach xx Million by 2033.
Mixer Grinder Industry Market Dynamics & Concentration
This section analyzes the competitive landscape of the mixer grinder industry, encompassing market concentration, innovation drivers, regulatory influences, product substitutions, end-user trends, and mergers and acquisitions (M&A) activities. The market is characterized by a moderate level of concentration, with key players such as Panasonic, Whirlpool Corporation, LG, Havells, AB Electrolux, Bosch Global, Philips, Samsung, Haier Inc, and Morphy Richards holding significant market share. However, the presence of numerous smaller players also contributes to competitive intensity.
- Market Share: The top 5 players account for approximately xx% of the global market share in 2025, while the remaining share is distributed among numerous smaller players.
- Innovation Drivers: Continuous innovation in motor technology, blade design, and safety features drives market growth. The increasing demand for energy-efficient and multi-functional models fuels this drive.
- Regulatory Frameworks: Government regulations concerning energy efficiency and product safety standards influence manufacturers' strategies and product development.
- Product Substitutes: Other food processing appliances, such as food processors and blenders, pose a degree of substitution threat, but the unique features of mixer grinders continue to maintain their market position.
- End-User Trends: The growing adoption of mixer grinders in both residential and commercial settings, driven by changing lifestyles and increasing demand for convenient food preparation, propels market growth.
- M&A Activities: The industry has witnessed a moderate level of M&A activity in recent years, with xx major deals recorded between 2019 and 2024. This includes significant acquisitions such as Electrolux Professional's acquisition of Tosei Corporation in December 2023. These activities can lead to increased market consolidation and influence future competition.
Mixer Grinder Industry Industry Trends & Analysis
The mixer grinder market exhibits robust growth, fueled by several key factors. The rising disposable incomes and changing lifestyles in developing economies are expanding the market base considerably. Technological advancements, such as the integration of smart features and improved durability, are enhancing product appeal. Consumers' growing preference for convenient and time-saving kitchen appliances boosts demand. The competitive dynamics are intense, with established brands and new entrants vying for market share through product innovation and aggressive marketing strategies. The Compound Annual Growth Rate (CAGR) for the mixer grinder industry is estimated at xx% during the forecast period (2025-2033). Market penetration is highest in Asia, followed by North America and Europe. The shift towards online sales channels also significantly influences market dynamics.
Leading Markets & Segments in Mixer Grinder Industry
The residential segment dominates the mixer grinder market, accounting for approximately xx% of total sales in 2025. Asia-Pacific remains the leading market, driven by high population density, rising disposable incomes, and increasing urbanization.
Key Drivers by Segment:
- Residential: Growing urbanization, changing lifestyles, and rising disposable incomes.
- Commercial: Growth of the food service industry, increasing demand for consistent food preparation in restaurants and hotels.
- Stand Mixer: Premium pricing, enhanced functionality, and appeal to a niche market segment.
- Traditional Mixer: Cost-effectiveness, reliability, and widespread adoption across various demographics.
- Multi-brand Stores: Wide distribution network, ease of access for consumers.
- Exclusive Stores: Brand building, higher margins, stronger customer relationships.
- Online Stores: Convenience, wider reach, increasing accessibility.
- Other Distribution Channels: Direct sales, smaller retailers, and specialized dealers.
Dominance Analysis: The Asia-Pacific region’s dominance is attributed to factors such as high population density, increasing disposable incomes, and a growing preference for convenient kitchen appliances. India and China are significant contributors to this growth. Developed markets like North America and Europe showcase sustained growth, driven by technological advancements and product diversification.
Mixer Grinder Industry Product Developments
Recent product innovations in the mixer grinder industry focus on enhanced functionality, improved safety features, and energy efficiency. Manufacturers are incorporating smart features such as remote control and automated settings. The development of compact, lightweight designs addresses space constraints in modern kitchens. These innovations cater to evolving consumer needs and preferences, enhancing the competitive landscape.
Key Drivers of Mixer Grinder Industry Growth
Technological advancements leading to greater efficiency and user-friendliness are key growth drivers. Rising disposable incomes in developing economies create substantial demand. Favorable government policies promoting energy-efficient appliances and favorable economic conditions further stimulate growth.
Challenges in the Mixer Grinder Industry Market
Intense competition among numerous established and emerging players presents a significant challenge. Supply chain disruptions can impact production and availability. Stringent regulatory requirements related to safety and energy efficiency impose additional costs on manufacturers. The industry faces fluctuations in raw material prices, impacting profitability.
Emerging Opportunities in Mixer Grinder Industry
The integration of smart technology and connectivity into mixer grinders presents significant opportunities for growth. Strategic partnerships and collaborations among manufacturers and distributors enhance market penetration and brand visibility. Expansion into new and emerging markets creates opportunities for growth and diversification. The development of sustainable and eco-friendly mixer grinders aligns with growing consumer preferences for environmentally conscious products.
Leading Players in the Mixer Grinder Industry Sector
- Panasonic
- Whirlpool Corporation
- LG
- Havells
- AB Electrolux
- Bosch Global
- Philips
- Samsung
- Haier Inc
- Morphy Richards
Key Milestones in Mixer Grinder Industry Industry
- April 2023: Bosch announced plans to acquire TSI Semiconductors.
- August 31, 2023: Bosch finalized the acquisition of TSI Semiconductors, forming Robert Bosch Semiconductor LLC.
- December 2023: Electrolux Professional completed the acquisition of Tosei Corporation.
These acquisitions showcase strategic moves by major players to expand their technological capabilities and market reach, impacting the competitive landscape.
Strategic Outlook for Mixer Grinder Industry Market
The mixer grinder industry is poised for sustained growth, driven by technological innovation, expanding consumer base, and strategic market expansion. Focus on sustainability, smart features, and diverse product offerings will shape the future of the industry. Companies that successfully adapt to changing consumer preferences and leverage technological advancements will gain a competitive edge.
Mixer Grinder Industry Segmentation
-
1. Product Type
- 1.1. Stand Mixer
- 1.2. Traditional Mixer
-
2. Distribution Channel
- 2.1. Multi-brands Stores
- 2.2. Exclusive Stores
- 2.3. Online Stores
- 2.4. Other Distribution Channels
-
3. End User
- 3.1. Residential
- 3.2. Commercial
Mixer Grinder Industry Segmentation By Geography
- 1. North America
- 2. Europe
- 3. Asia Pacific
- 4. Latin America
- 5. Middle East and Africa
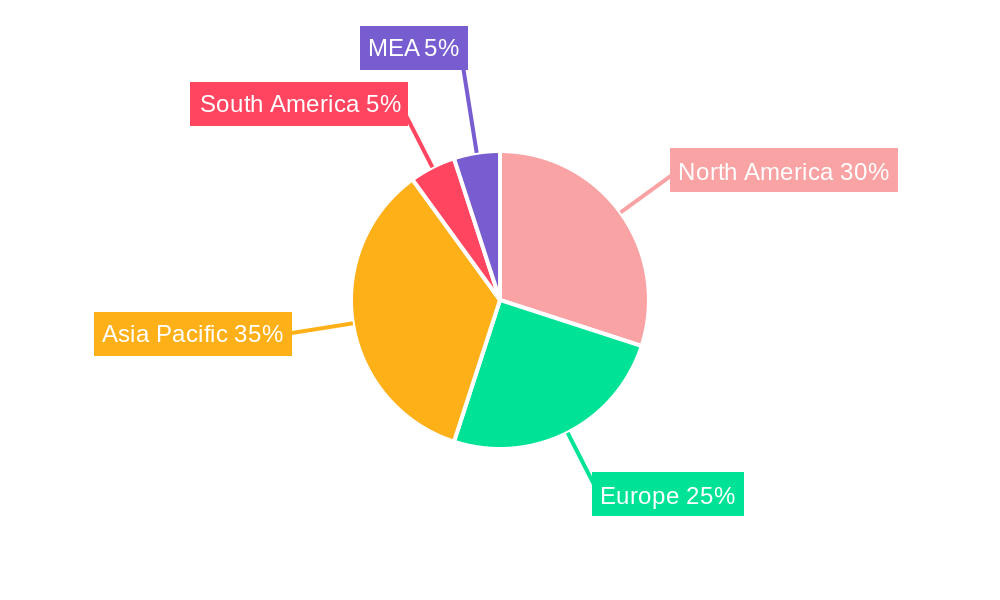
Mixer Grinder Industry Regional Market Share
Geographic Coverage of Mixer Grinder Industry
Mixer Grinder Industry REPORT HIGHLIGHTS
| Aspects | Details |
|---|---|
| Study Period | 2020-2034 |
| Base Year | 2025 |
| Estimated Year | 2026 |
| Forecast Period | 2026-2034 |
| Historical Period | 2020-2025 |
| Growth Rate | CAGR of 3.71% from 2020-2034 |
| Segmentation |
|
Table of Contents
- 1. Introduction
- 1.1. Research Scope
- 1.2. Market Segmentation
- 1.3. Research Objective
- 1.4. Definitions and Assumptions
- 2. Executive Summary
- 2.1. Market Snapshot
- 3. Market Dynamics
- 3.1. Market Drivers
- 3.2. Market Restrains
- 3.3. Market Trends
- 3.4. Market Opportunities
- 4. Market Factor Analysis
- 4.1. Porters Five Forces
- 4.1.1. Bargaining Power of Suppliers
- 4.1.2. Bargaining Power of Buyers
- 4.1.3. Threat of New Entrants
- 4.1.4. Threat of Substitutes
- 4.1.5. Competitive Rivalry
- 4.2. PESTEL analysis
- 4.3. BCG Analysis
- 4.3.1. Stars (High Growth, High Market Share)
- 4.3.2. Cash Cows (Low Growth, High Market Share)
- 4.3.3. Question Mark (High Growth, Low Market Share)
- 4.3.4. Dogs (Low Growth, Low Market Share)
- 4.4. Ansoff Matrix Analysis
- 4.5. Supply Chain Analysis
- 4.6. Regulatory Landscape
- 4.7. Current Market Potential and Opportunity Assessment (TAM–SAM–SOM Framework)
- 4.8. MDP Analyst Note
- 4.1. Porters Five Forces
- 5. Market Analysis, Insights and Forecast 2021-2033
- 5.1. Market Analysis, Insights and Forecast - by Product Type
- 5.1.1. Stand Mixer
- 5.1.2. Traditional Mixer
- 5.2. Market Analysis, Insights and Forecast - by Distribution Channel
- 5.2.1. Multi-brands Stores
- 5.2.2. Exclusive Stores
- 5.2.3. Online Stores
- 5.2.4. Other Distribution Channels
- 5.3. Market Analysis, Insights and Forecast - by End User
- 5.3.1. Residential
- 5.3.2. Commercial
- 5.4. Market Analysis, Insights and Forecast - by Region
- 5.4.1. North America
- 5.4.2. Europe
- 5.4.3. Asia Pacific
- 5.4.4. Latin America
- 5.4.5. Middle East and Africa
- 5.1. Market Analysis, Insights and Forecast - by Product Type
- 6. Global Mixer Grinder Industry Analysis, Insights and Forecast, 2021-2033
- 6.1. Market Analysis, Insights and Forecast - by Product Type
- 6.1.1. Stand Mixer
- 6.1.2. Traditional Mixer
- 6.2. Market Analysis, Insights and Forecast - by Distribution Channel
- 6.2.1. Multi-brands Stores
- 6.2.2. Exclusive Stores
- 6.2.3. Online Stores
- 6.2.4. Other Distribution Channels
- 6.3. Market Analysis, Insights and Forecast - by End User
- 6.3.1. Residential
- 6.3.2. Commercial
- 6.1. Market Analysis, Insights and Forecast - by Product Type
- 7. North America Mixer Grinder Industry Analysis, Insights and Forecast, 2020-2032
- 7.1. Market Analysis, Insights and Forecast - by Product Type
- 7.1.1. Stand Mixer
- 7.1.2. Traditional Mixer
- 7.2. Market Analysis, Insights and Forecast - by Distribution Channel
- 7.2.1. Multi-brands Stores
- 7.2.2. Exclusive Stores
- 7.2.3. Online Stores
- 7.2.4. Other Distribution Channels
- 7.3. Market Analysis, Insights and Forecast - by End User
- 7.3.1. Residential
- 7.3.2. Commercial
- 7.1. Market Analysis, Insights and Forecast - by Product Type
- 8. Europe Mixer Grinder Industry Analysis, Insights and Forecast, 2020-2032
- 8.1. Market Analysis, Insights and Forecast - by Product Type
- 8.1.1. Stand Mixer
- 8.1.2. Traditional Mixer
- 8.2. Market Analysis, Insights and Forecast - by Distribution Channel
- 8.2.1. Multi-brands Stores
- 8.2.2. Exclusive Stores
- 8.2.3. Online Stores
- 8.2.4. Other Distribution Channels
- 8.3. Market Analysis, Insights and Forecast - by End User
- 8.3.1. Residential
- 8.3.2. Commercial
- 8.1. Market Analysis, Insights and Forecast - by Product Type
- 9. Asia Pacific Mixer Grinder Industry Analysis, Insights and Forecast, 2020-2032
- 9.1. Market Analysis, Insights and Forecast - by Product Type
- 9.1.1. Stand Mixer
- 9.1.2. Traditional Mixer
- 9.2. Market Analysis, Insights and Forecast - by Distribution Channel
- 9.2.1. Multi-brands Stores
- 9.2.2. Exclusive Stores
- 9.2.3. Online Stores
- 9.2.4. Other Distribution Channels
- 9.3. Market Analysis, Insights and Forecast - by End User
- 9.3.1. Residential
- 9.3.2. Commercial
- 9.1. Market Analysis, Insights and Forecast - by Product Type
- 10. Latin America Mixer Grinder Industry Analysis, Insights and Forecast, 2020-2032
- 10.1. Market Analysis, Insights and Forecast - by Product Type
- 10.1.1. Stand Mixer
- 10.1.2. Traditional Mixer
- 10.2. Market Analysis, Insights and Forecast - by Distribution Channel
- 10.2.1. Multi-brands Stores
- 10.2.2. Exclusive Stores
- 10.2.3. Online Stores
- 10.2.4. Other Distribution Channels
- 10.3. Market Analysis, Insights and Forecast - by End User
- 10.3.1. Residential
- 10.3.2. Commercial
- 10.1. Market Analysis, Insights and Forecast - by Product Type
- 11. Middle East and Africa Mixer Grinder Industry Analysis, Insights and Forecast, 2020-2032
- 11.1. Market Analysis, Insights and Forecast - by Product Type
- 11.1.1. Stand Mixer
- 11.1.2. Traditional Mixer
- 11.2. Market Analysis, Insights and Forecast - by Distribution Channel
- 11.2.1. Multi-brands Stores
- 11.2.2. Exclusive Stores
- 11.2.3. Online Stores
- 11.2.4. Other Distribution Channels
- 11.3. Market Analysis, Insights and Forecast - by End User
- 11.3.1. Residential
- 11.3.2. Commercial
- 11.1. Market Analysis, Insights and Forecast - by Product Type
- 12. Competitive Analysis
- 12.1. Company Profiles
- 12.1.1 Panasonic
- 12.1.1.1. Company Overview
- 12.1.1.2. Products
- 12.1.1.3. Company Financials
- 12.1.1.4. SWOT Analysis
- 12.1.2 Whirlpool Corporation
- 12.1.2.1. Company Overview
- 12.1.2.2. Products
- 12.1.2.3. Company Financials
- 12.1.2.4. SWOT Analysis
- 12.1.3 LG
- 12.1.3.1. Company Overview
- 12.1.3.2. Products
- 12.1.3.3. Company Financials
- 12.1.3.4. SWOT Analysis
- 12.1.4 Havells
- 12.1.4.1. Company Overview
- 12.1.4.2. Products
- 12.1.4.3. Company Financials
- 12.1.4.4. SWOT Analysis
- 12.1.5 AB Electrolux
- 12.1.5.1. Company Overview
- 12.1.5.2. Products
- 12.1.5.3. Company Financials
- 12.1.5.4. SWOT Analysis
- 12.1.6 Bosch Global
- 12.1.6.1. Company Overview
- 12.1.6.2. Products
- 12.1.6.3. Company Financials
- 12.1.6.4. SWOT Analysis
- 12.1.7 Philips
- 12.1.7.1. Company Overview
- 12.1.7.2. Products
- 12.1.7.3. Company Financials
- 12.1.7.4. SWOT Analysis
- 12.1.8 Samsung
- 12.1.8.1. Company Overview
- 12.1.8.2. Products
- 12.1.8.3. Company Financials
- 12.1.8.4. SWOT Analysis
- 12.1.9 Haier Inc
- 12.1.9.1. Company Overview
- 12.1.9.2. Products
- 12.1.9.3. Company Financials
- 12.1.9.4. SWOT Analysis
- 12.1.10 Morphy Richards
- 12.1.10.1. Company Overview
- 12.1.10.2. Products
- 12.1.10.3. Company Financials
- 12.1.10.4. SWOT Analysis
- 12.1.1 Panasonic
- 12.2. Market Entropy
- 12.2.1 Company's Key Areas Served
- 12.2.2 Recent Developments
- 12.3. Company Market Share Analysis 2025
- 12.3.1 Top 5 Companies Market Share Analysis
- 12.3.2 Top 3 Companies Market Share Analysis
- 12.4. List of Potential Customers
- 13. Research Methodology
List of Figures
- Figure 1: Global Mixer Grinder Industry Revenue Breakdown (Million, %) by Region 2025 & 2033
- Figure 2: Global Mixer Grinder Industry Volume Breakdown (K Unit, %) by Region 2025 & 2033
- Figure 3: North America Mixer Grinder Industry Revenue (Million), by Product Type 2025 & 2033
- Figure 4: North America Mixer Grinder Industry Volume (K Unit), by Product Type 2025 & 2033
- Figure 5: North America Mixer Grinder Industry Revenue Share (%), by Product Type 2025 & 2033
- Figure 6: North America Mixer Grinder Industry Volume Share (%), by Product Type 2025 & 2033
- Figure 7: North America Mixer Grinder Industry Revenue (Million), by Distribution Channel 2025 & 2033
- Figure 8: North America Mixer Grinder Industry Volume (K Unit), by Distribution Channel 2025 & 2033
- Figure 9: North America Mixer Grinder Industry Revenue Share (%), by Distribution Channel 2025 & 2033
- Figure 10: North America Mixer Grinder Industry Volume Share (%), by Distribution Channel 2025 & 2033
- Figure 11: North America Mixer Grinder Industry Revenue (Million), by End User 2025 & 2033
- Figure 12: North America Mixer Grinder Industry Volume (K Unit), by End User 2025 & 2033
- Figure 13: North America Mixer Grinder Industry Revenue Share (%), by End User 2025 & 2033
- Figure 14: North America Mixer Grinder Industry Volume Share (%), by End User 2025 & 2033
- Figure 15: North America Mixer Grinder Industry Revenue (Million), by Country 2025 & 2033
- Figure 16: North America Mixer Grinder Industry Volume (K Unit), by Country 2025 & 2033
- Figure 17: North America Mixer Grinder Industry Revenue Share (%), by Country 2025 & 2033
- Figure 18: North America Mixer Grinder Industry Volume Share (%), by Country 2025 & 2033
- Figure 19: Europe Mixer Grinder Industry Revenue (Million), by Product Type 2025 & 2033
- Figure 20: Europe Mixer Grinder Industry Volume (K Unit), by Product Type 2025 & 2033
- Figure 21: Europe Mixer Grinder Industry Revenue Share (%), by Product Type 2025 & 2033
- Figure 22: Europe Mixer Grinder Industry Volume Share (%), by Product Type 2025 & 2033
- Figure 23: Europe Mixer Grinder Industry Revenue (Million), by Distribution Channel 2025 & 2033
- Figure 24: Europe Mixer Grinder Industry Volume (K Unit), by Distribution Channel 2025 & 2033
- Figure 25: Europe Mixer Grinder Industry Revenue Share (%), by Distribution Channel 2025 & 2033
- Figure 26: Europe Mixer Grinder Industry Volume Share (%), by Distribution Channel 2025 & 2033
- Figure 27: Europe Mixer Grinder Industry Revenue (Million), by End User 2025 & 2033
- Figure 28: Europe Mixer Grinder Industry Volume (K Unit), by End User 2025 & 2033
- Figure 29: Europe Mixer Grinder Industry Revenue Share (%), by End User 2025 & 2033
- Figure 30: Europe Mixer Grinder Industry Volume Share (%), by End User 2025 & 2033
- Figure 31: Europe Mixer Grinder Industry Revenue (Million), by Country 2025 & 2033
- Figure 32: Europe Mixer Grinder Industry Volume (K Unit), by Country 2025 & 2033
- Figure 33: Europe Mixer Grinder Industry Revenue Share (%), by Country 2025 & 2033
- Figure 34: Europe Mixer Grinder Industry Volume Share (%), by Country 2025 & 2033
- Figure 35: Asia Pacific Mixer Grinder Industry Revenue (Million), by Product Type 2025 & 2033
- Figure 36: Asia Pacific Mixer Grinder Industry Volume (K Unit), by Product Type 2025 & 2033
- Figure 37: Asia Pacific Mixer Grinder Industry Revenue Share (%), by Product Type 2025 & 2033
- Figure 38: Asia Pacific Mixer Grinder Industry Volume Share (%), by Product Type 2025 & 2033
- Figure 39: Asia Pacific Mixer Grinder Industry Revenue (Million), by Distribution Channel 2025 & 2033
- Figure 40: Asia Pacific Mixer Grinder Industry Volume (K Unit), by Distribution Channel 2025 & 2033
- Figure 41: Asia Pacific Mixer Grinder Industry Revenue Share (%), by Distribution Channel 2025 & 2033
- Figure 42: Asia Pacific Mixer Grinder Industry Volume Share (%), by Distribution Channel 2025 & 2033
- Figure 43: Asia Pacific Mixer Grinder Industry Revenue (Million), by End User 2025 & 2033
- Figure 44: Asia Pacific Mixer Grinder Industry Volume (K Unit), by End User 2025 & 2033
- Figure 45: Asia Pacific Mixer Grinder Industry Revenue Share (%), by End User 2025 & 2033
- Figure 46: Asia Pacific Mixer Grinder Industry Volume Share (%), by End User 2025 & 2033
- Figure 47: Asia Pacific Mixer Grinder Industry Revenue (Million), by Country 2025 & 2033
- Figure 48: Asia Pacific Mixer Grinder Industry Volume (K Unit), by Country 2025 & 2033
- Figure 49: Asia Pacific Mixer Grinder Industry Revenue Share (%), by Country 2025 & 2033
- Figure 50: Asia Pacific Mixer Grinder Industry Volume Share (%), by Country 2025 & 2033
- Figure 51: Latin America Mixer Grinder Industry Revenue (Million), by Product Type 2025 & 2033
- Figure 52: Latin America Mixer Grinder Industry Volume (K Unit), by Product Type 2025 & 2033
- Figure 53: Latin America Mixer Grinder Industry Revenue Share (%), by Product Type 2025 & 2033
- Figure 54: Latin America Mixer Grinder Industry Volume Share (%), by Product Type 2025 & 2033
- Figure 55: Latin America Mixer Grinder Industry Revenue (Million), by Distribution Channel 2025 & 2033
- Figure 56: Latin America Mixer Grinder Industry Volume (K Unit), by Distribution Channel 2025 & 2033
- Figure 57: Latin America Mixer Grinder Industry Revenue Share (%), by Distribution Channel 2025 & 2033
- Figure 58: Latin America Mixer Grinder Industry Volume Share (%), by Distribution Channel 2025 & 2033
- Figure 59: Latin America Mixer Grinder Industry Revenue (Million), by End User 2025 & 2033
- Figure 60: Latin America Mixer Grinder Industry Volume (K Unit), by End User 2025 & 2033
- Figure 61: Latin America Mixer Grinder Industry Revenue Share (%), by End User 2025 & 2033
- Figure 62: Latin America Mixer Grinder Industry Volume Share (%), by End User 2025 & 2033
- Figure 63: Latin America Mixer Grinder Industry Revenue (Million), by Country 2025 & 2033
- Figure 64: Latin America Mixer Grinder Industry Volume (K Unit), by Country 2025 & 2033
- Figure 65: Latin America Mixer Grinder Industry Revenue Share (%), by Country 2025 & 2033
- Figure 66: Latin America Mixer Grinder Industry Volume Share (%), by Country 2025 & 2033
- Figure 67: Middle East and Africa Mixer Grinder Industry Revenue (Million), by Product Type 2025 & 2033
- Figure 68: Middle East and Africa Mixer Grinder Industry Volume (K Unit), by Product Type 2025 & 2033
- Figure 69: Middle East and Africa Mixer Grinder Industry Revenue Share (%), by Product Type 2025 & 2033
- Figure 70: Middle East and Africa Mixer Grinder Industry Volume Share (%), by Product Type 2025 & 2033
- Figure 71: Middle East and Africa Mixer Grinder Industry Revenue (Million), by Distribution Channel 2025 & 2033
- Figure 72: Middle East and Africa Mixer Grinder Industry Volume (K Unit), by Distribution Channel 2025 & 2033
- Figure 73: Middle East and Africa Mixer Grinder Industry Revenue Share (%), by Distribution Channel 2025 & 2033
- Figure 74: Middle East and Africa Mixer Grinder Industry Volume Share (%), by Distribution Channel 2025 & 2033
- Figure 75: Middle East and Africa Mixer Grinder Industry Revenue (Million), by End User 2025 & 2033
- Figure 76: Middle East and Africa Mixer Grinder Industry Volume (K Unit), by End User 2025 & 2033
- Figure 77: Middle East and Africa Mixer Grinder Industry Revenue Share (%), by End User 2025 & 2033
- Figure 78: Middle East and Africa Mixer Grinder Industry Volume Share (%), by End User 2025 & 2033
- Figure 79: Middle East and Africa Mixer Grinder Industry Revenue (Million), by Country 2025 & 2033
- Figure 80: Middle East and Africa Mixer Grinder Industry Volume (K Unit), by Country 2025 & 2033
- Figure 81: Middle East and Africa Mixer Grinder Industry Revenue Share (%), by Country 2025 & 2033
- Figure 82: Middle East and Africa Mixer Grinder Industry Volume Share (%), by Country 2025 & 2033
List of Tables
- Table 1: Global Mixer Grinder Industry Revenue Million Forecast, by Product Type 2020 & 2033
- Table 2: Global Mixer Grinder Industry Volume K Unit Forecast, by Product Type 2020 & 2033
- Table 3: Global Mixer Grinder Industry Revenue Million Forecast, by Distribution Channel 2020 & 2033
- Table 4: Global Mixer Grinder Industry Volume K Unit Forecast, by Distribution Channel 2020 & 2033
- Table 5: Global Mixer Grinder Industry Revenue Million Forecast, by End User 2020 & 2033
- Table 6: Global Mixer Grinder Industry Volume K Unit Forecast, by End User 2020 & 2033
- Table 7: Global Mixer Grinder Industry Revenue Million Forecast, by Region 2020 & 2033
- Table 8: Global Mixer Grinder Industry Volume K Unit Forecast, by Region 2020 & 2033
- Table 9: Global Mixer Grinder Industry Revenue Million Forecast, by Product Type 2020 & 2033
- Table 10: Global Mixer Grinder Industry Volume K Unit Forecast, by Product Type 2020 & 2033
- Table 11: Global Mixer Grinder Industry Revenue Million Forecast, by Distribution Channel 2020 & 2033
- Table 12: Global Mixer Grinder Industry Volume K Unit Forecast, by Distribution Channel 2020 & 2033
- Table 13: Global Mixer Grinder Industry Revenue Million Forecast, by End User 2020 & 2033
- Table 14: Global Mixer Grinder Industry Volume K Unit Forecast, by End User 2020 & 2033
- Table 15: Global Mixer Grinder Industry Revenue Million Forecast, by Country 2020 & 2033
- Table 16: Global Mixer Grinder Industry Volume K Unit Forecast, by Country 2020 & 2033
- Table 17: Global Mixer Grinder Industry Revenue Million Forecast, by Product Type 2020 & 2033
- Table 18: Global Mixer Grinder Industry Volume K Unit Forecast, by Product Type 2020 & 2033
- Table 19: Global Mixer Grinder Industry Revenue Million Forecast, by Distribution Channel 2020 & 2033
- Table 20: Global Mixer Grinder Industry Volume K Unit Forecast, by Distribution Channel 2020 & 2033
- Table 21: Global Mixer Grinder Industry Revenue Million Forecast, by End User 2020 & 2033
- Table 22: Global Mixer Grinder Industry Volume K Unit Forecast, by End User 2020 & 2033
- Table 23: Global Mixer Grinder Industry Revenue Million Forecast, by Country 2020 & 2033
- Table 24: Global Mixer Grinder Industry Volume K Unit Forecast, by Country 2020 & 2033
- Table 25: Global Mixer Grinder Industry Revenue Million Forecast, by Product Type 2020 & 2033
- Table 26: Global Mixer Grinder Industry Volume K Unit Forecast, by Product Type 2020 & 2033
- Table 27: Global Mixer Grinder Industry Revenue Million Forecast, by Distribution Channel 2020 & 2033
- Table 28: Global Mixer Grinder Industry Volume K Unit Forecast, by Distribution Channel 2020 & 2033
- Table 29: Global Mixer Grinder Industry Revenue Million Forecast, by End User 2020 & 2033
- Table 30: Global Mixer Grinder Industry Volume K Unit Forecast, by End User 2020 & 2033
- Table 31: Global Mixer Grinder Industry Revenue Million Forecast, by Country 2020 & 2033
- Table 32: Global Mixer Grinder Industry Volume K Unit Forecast, by Country 2020 & 2033
- Table 33: Global Mixer Grinder Industry Revenue Million Forecast, by Product Type 2020 & 2033
- Table 34: Global Mixer Grinder Industry Volume K Unit Forecast, by Product Type 2020 & 2033
- Table 35: Global Mixer Grinder Industry Revenue Million Forecast, by Distribution Channel 2020 & 2033
- Table 36: Global Mixer Grinder Industry Volume K Unit Forecast, by Distribution Channel 2020 & 2033
- Table 37: Global Mixer Grinder Industry Revenue Million Forecast, by End User 2020 & 2033
- Table 38: Global Mixer Grinder Industry Volume K Unit Forecast, by End User 2020 & 2033
- Table 39: Global Mixer Grinder Industry Revenue Million Forecast, by Country 2020 & 2033
- Table 40: Global Mixer Grinder Industry Volume K Unit Forecast, by Country 2020 & 2033
- Table 41: Global Mixer Grinder Industry Revenue Million Forecast, by Product Type 2020 & 2033
- Table 42: Global Mixer Grinder Industry Volume K Unit Forecast, by Product Type 2020 & 2033
- Table 43: Global Mixer Grinder Industry Revenue Million Forecast, by Distribution Channel 2020 & 2033
- Table 44: Global Mixer Grinder Industry Volume K Unit Forecast, by Distribution Channel 2020 & 2033
- Table 45: Global Mixer Grinder Industry Revenue Million Forecast, by End User 2020 & 2033
- Table 46: Global Mixer Grinder Industry Volume K Unit Forecast, by End User 2020 & 2033
- Table 47: Global Mixer Grinder Industry Revenue Million Forecast, by Country 2020 & 2033
- Table 48: Global Mixer Grinder Industry Volume K Unit Forecast, by Country 2020 & 2033
Frequently Asked Questions
1. What is the projected Compound Annual Growth Rate (CAGR) of the Mixer Grinder Industry?
The projected CAGR is approximately 3.71%.
2. Which companies are prominent players in the Mixer Grinder Industry?
Key companies in the market include Panasonic, Whirlpool Corporation, LG, Havells, AB Electrolux, Bosch Global, Philips, Samsung, Haier Inc, Morphy Richards.
3. What are the main segments of the Mixer Grinder Industry?
The market segments include Product Type, Distribution Channel, End User.
4. Can you provide details about the market size?
The market size is estimated to be USD 14.69 Million as of 2022.
5. What are some drivers contributing to market growth?
Increasing Urbanization is Driving the Market; Increase in Usage of Smart Kitchen Appliances is Driving the Market.
6. What are the notable trends driving market growth?
E-commerce Emerges as a Fastest Growing Distribution Channel for Mixer Grinders.
7. Are there any restraints impacting market growth?
High Power Consumption.
8. Can you provide examples of recent developments in the market?
In April 2023, Bosch revealed plans to acquire the assets of TSI Semiconductors, including its Roseville, California campus. The acquisition was finalized on August 31, 2023, and the newly formed company will operate under the name Robert Bosch Semiconductor LLC.
9. What pricing options are available for accessing the report?
Pricing options include single-user, multi-user, and enterprise licenses priced at USD 4750, USD 5250, and USD 8750 respectively.
10. Is the market size provided in terms of value or volume?
The market size is provided in terms of value, measured in Million and volume, measured in K Unit.
11. Are there any specific market keywords associated with the report?
Yes, the market keyword associated with the report is "Mixer Grinder Industry," which aids in identifying and referencing the specific market segment covered.
12. How do I determine which pricing option suits my needs best?
The pricing options vary based on user requirements and access needs. Individual users may opt for single-user licenses, while businesses requiring broader access may choose multi-user or enterprise licenses for cost-effective access to the report.
13. Are there any additional resources or data provided in the Mixer Grinder Industry report?
While the report offers comprehensive insights, it's advisable to review the specific contents or supplementary materials provided to ascertain if additional resources or data are available.
14. How can I stay updated on further developments or reports in the Mixer Grinder Industry?
To stay informed about further developments, trends, and reports in the Mixer Grinder Industry, consider subscribing to industry newsletters, following relevant companies and organizations, or regularly checking reputable industry news sources and publications.
Methodology
Step 1 - Identification of Relevant Samples Size from Population Database


Step 2 - Approaches for Defining Global Market Size (Value, Volume* & Price*)

Note*: In applicable scenarios
Step 3 - Data Sources
Primary Research
- Web Analytics
- Survey Reports
- Research Institute
- Latest Research Reports
- Opinion Leaders
Secondary Research
- Annual Reports
- White Paper
- Latest Press Release
- Industry Association
- Paid Database
- Investor Presentations

Step 4 - Data Triangulation
Involves using different sources of information in order to increase the validity of a study
These sources are likely to be stakeholders in a program - participants, other researchers, program staff, other community members, and so on.
Then we put all data in single framework & apply various statistical tools to find out the dynamic on the market.
During the analysis stage, feedback from the stakeholder groups would be compared to determine areas of agreement as well as areas of divergence