

Key Insights
The MEA plastic packaging market, currently experiencing robust growth, is projected to maintain a significant expansion trajectory throughout the forecast period (2025-2033). Driven by factors such as the burgeoning food and beverage sector, increasing demand for consumer goods, and a rising population across the region, the market demonstrates substantial potential. Key segments within the industry, including bottles and jars, flexible packaging, and PET materials, are anticipated to witness above-average growth rates. The preference for lightweight and convenient packaging solutions is further fueling market expansion. However, environmental concerns surrounding plastic waste and increasing regulatory scrutiny related to sustainable packaging are likely to present challenges. Companies in the MEA region are actively seeking sustainable alternatives and adopting circular economy principles to mitigate these concerns. This necessitates investments in advanced recycling technologies and the development of biodegradable or compostable packaging materials. The competitive landscape is characterized by both established multinational corporations and regional players, each employing distinct strategies to capture market share. Successful players are those that focus on innovation, product diversification, and a strong commitment to sustainability.
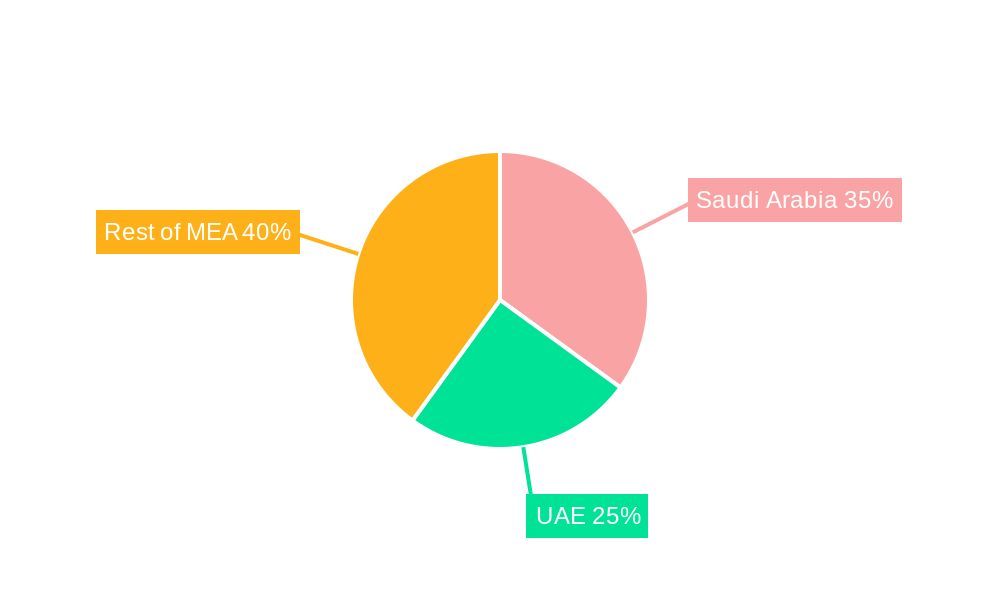
The Saudi Arabian market, within the broader MEA region, is a particularly strong driver, largely due to its significant investments in infrastructure development and industrial growth. The United Arab Emirates also contributes considerably, thanks to its robust tourism and retail sectors. Growth within the healthcare and pharmaceutical segments also indicates significant opportunities for specialized plastic packaging solutions. The market is further segmented by packaging type (rigid versus flexible) and material type (PET, PP, PE, etc.), reflecting varying material properties and end-use applications. Furthermore, projections suggest continued growth in e-commerce, which will likely stimulate demand for protective and efficient packaging solutions across a wider range of product categories. Companies must continue to adapt to evolving consumer preferences and environmental regulations to ensure sustained success in this dynamic market.
MEA Plastic Packaging Industry: A Comprehensive Market Report (2019-2033)
This in-depth report provides a comprehensive analysis of the Middle East and Africa (MEA) plastic packaging industry, offering valuable insights for stakeholders, investors, and industry professionals. With a forecast period spanning 2025-2033 and a base year of 2025, this report covers the historical period of 2019-2024 and utilizes a study period of 2019-2033. The market is segmented by product, packaging type, material, and end-user industry, providing a granular understanding of current dynamics and future trends. The report features detailed analyses of leading companies like SABIC, Napco Group, and many more. Expect data-driven insights on market size (in Millions), CAGR, and key market drivers, enabling informed decision-making for strategic planning and growth within this dynamic sector.
MEA Plastic Packaging Industry Market Dynamics & Concentration
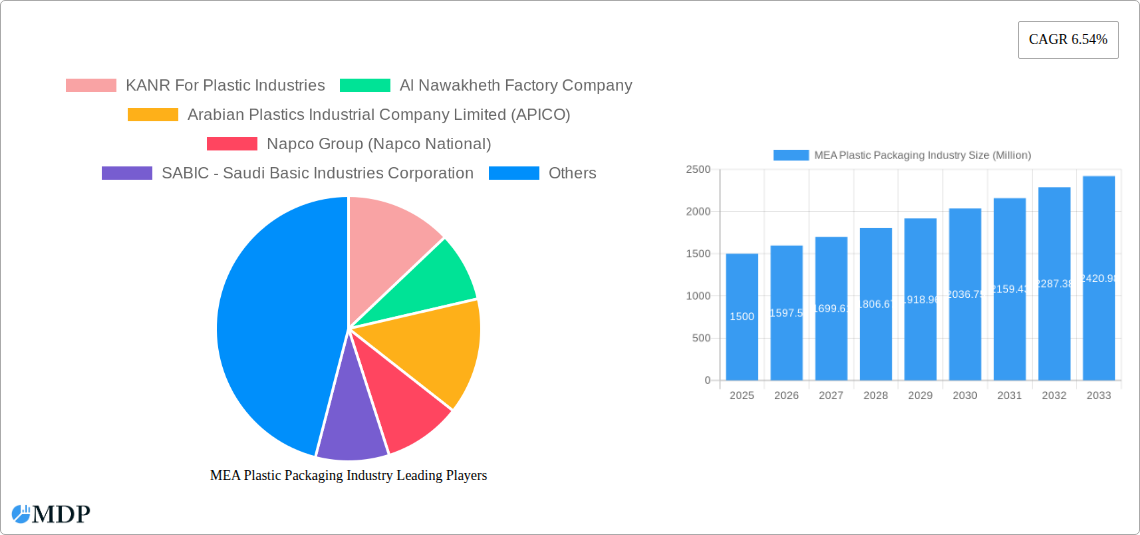
The MEA plastic packaging market exhibits a moderately concentrated landscape, with several large players commanding significant market share. Market concentration is influenced by factors such as economies of scale, technological advancements, and access to raw materials. Innovation in sustainable packaging solutions is a key driver, pushing companies to develop recyclable and biodegradable alternatives. Stringent environmental regulations and evolving consumer preferences towards eco-friendly products are also shaping the market. Mergers and acquisitions (M&A) activity within the sector is moderately high, with companies seeking to expand their product portfolios and geographical reach. The estimated number of M&A deals in the period 2019-2024 is approximately xx. Furthermore, fluctuating oil prices, a primary raw material cost, significantly impacts industry profitability.
- Market Share Concentration: The top 5 players account for approximately xx% of the market share (2024).
- Innovation Drivers: Sustainable packaging, lightweighting technologies, improved barrier properties.
- Regulatory Frameworks: Increasingly stringent environmental regulations driving demand for eco-friendly packaging.
- Product Substitutes: Growing interest in alternative packaging materials (e.g., paper, bioplastics).
- End-User Trends: Shifting consumer preferences towards convenience, sustainability, and brand experience.
- M&A Activities: xx M&A deals recorded between 2019-2024, indicative of consolidation and expansion strategies.
MEA Plastic Packaging Industry Industry Trends & Analysis
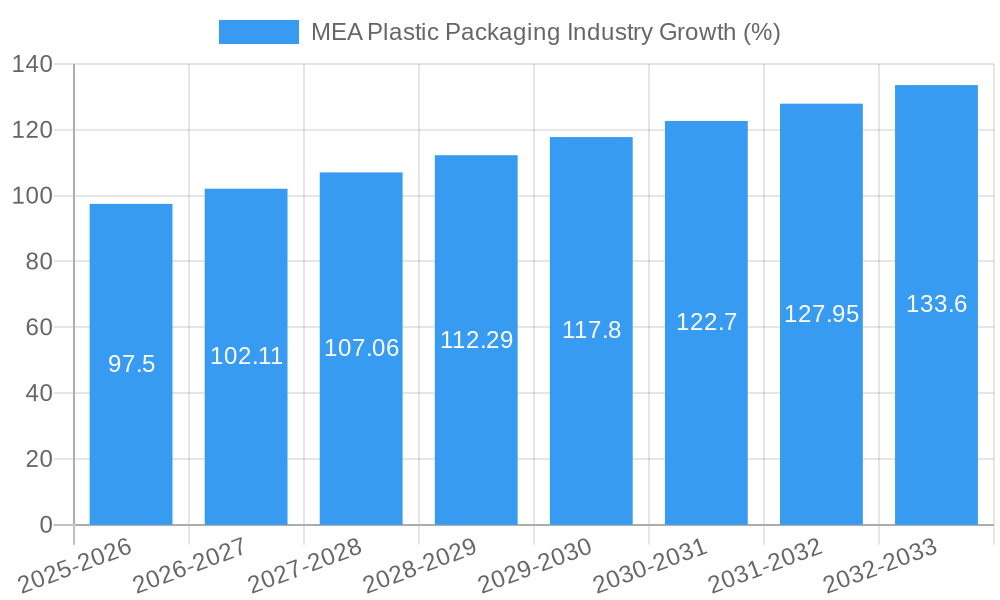
The MEA plastic packaging industry is experiencing robust growth, driven by factors such as rising disposable incomes, population growth, urbanization, and an expanding food and beverage sector. The Compound Annual Growth Rate (CAGR) for the period 2019-2024 was estimated at xx%, and is projected to remain at xx% during 2025-2033. Technological disruptions, such as the adoption of advanced packaging technologies like active and intelligent packaging, are further driving market expansion. Consumer preferences for convenience and product safety are influencing packaging design and material selection. Competitive dynamics are characterized by intense price competition, product differentiation, and a focus on innovation. Market penetration of sustainable packaging options is slowly increasing, reaching approximately xx% in 2024, fueled by heightened environmental awareness and regulatory pressures.
Leading Markets & Segments in MEA Plastic Packaging Industry
The report identifies Saudi Arabia and the UAE as leading markets within the MEA region, primarily driven by robust economic growth and significant investments in infrastructure development. Within the product segment, Bottles and Jars hold the largest market share, followed by Pouches and Tubs, Cups, Bowls, and Trays. In terms of packaging type, Flexible packaging dominates the market, reflecting the significant demand for flexible packaging in the food and beverage sector. Polyethylene (PE) and Polyethylene Terephthalate (PET) are the leading materials in terms of volume consumption. The Food and Beverage end-user industries constitute the largest segment, driven by the thriving food processing and retail sectors.
- Key Drivers in Leading Markets:
- Saudi Arabia: Government investments in infrastructure, growing food and beverage sector, rising disposable incomes.
- UAE: Strong economic growth, tourism, and a significant retail sector.
- Dominant Segments:
- By Product: Bottles and Jars
- By Packaging Type: Flexible
- By Material: Polyethylene (PE) and Polyethylene Terephthalate (PET)
- By End-user Industry: Food and Beverage
MEA Plastic Packaging Industry Product Developments
Recent innovations in MEA plastic packaging include the introduction of lightweight packaging designs, improved barrier properties to enhance product shelf life, and the growing adoption of recyclable and compostable materials. These advancements are driven by increasing environmental concerns and stricter regulatory frameworks. Companies are also focusing on developing active and intelligent packaging that can extend product shelf life and improve consumer safety. The market is seeing increased adoption of flexible packaging due to cost-effectiveness and ease of use.
Key Drivers of MEA Plastic Packaging Industry Growth
The MEA plastic packaging industry's growth is propelled by several factors, including robust economic growth across the region, increasing urbanization leading to higher consumption, a growing food and beverage sector driving demand for packaging, and technological advancements leading to new and improved packaging solutions. Government initiatives promoting sustainable packaging and favorable regulatory policies further boost market expansion. The rising disposable income of consumers is also contributing to increased demand for packaged goods.
Challenges in the MEA Plastic Packaging Industry Market
Significant challenges face the MEA plastic packaging industry, including fluctuating raw material prices (especially oil-based polymers), stringent environmental regulations imposing limitations on the use of certain plastics, and a growing need to address plastic waste management. Supply chain disruptions also pose a risk, while price competition keeps margins tight. The estimated impact of these challenges on the industry's profitability is xx% in 2024.
Emerging Opportunities in MEA Plastic Packaging Industry
The long-term outlook for the MEA plastic packaging industry is positive. Growing adoption of sustainable and eco-friendly packaging solutions presents significant opportunities. Strategic partnerships between packaging manufacturers and raw material suppliers, as well as exploring new markets within the region, will drive future growth. The development and adoption of advanced packaging technologies offer additional avenues for expansion.
Leading Players in the MEA Plastic Packaging Industry Sector
- KANR For Plastic Industries
- Al Nawakheth Factory Company
- Arabian Plastics Industrial Company Limited (APICO)
- Napco Group (Napco National)
- SABIC - Saudi Basic Industries Corporation (SABIC)
- Zamil Plastic Industries Co
- Sealed Air Corporation (Sealed Air Saudi Arabia)
- Takween Advanced Industries
- AL-Ghandoura Co Manuf Plastic (GhanPlast)
- Saudi Arabian Packaging Industry WLL (SAPIN)
- Saudi Plastic Factory Company
- Arnon Plastic Industry Co Ltd
- Plastico SPS
- Coloredsun
- National Plastic Factory LLC
- Packaging Products Company (PPC)
Key Milestones in MEA Plastic Packaging Industry Industry
- June 2022: SABIC's collaboration with Heinz, Tesco, and Berry on a UK recycling trial showcases circular economy initiatives, setting a precedent for sustainable practices within the MEA region and globally, potentially impacting consumer perception and driving demand for recycled content packaging.
Strategic Outlook for MEA Plastic Packaging Industry Market
The future of the MEA plastic packaging industry is bright, with considerable potential for growth fueled by economic expansion, population increase, and a rising demand for packaged goods. Focusing on sustainable practices, innovative product development, and strategic partnerships will be crucial for long-term success. Companies that embrace eco-friendly packaging solutions and adopt advanced technologies are poised to capture significant market share and achieve sustained profitability in the coming years.
MEA Plastic Packaging Industry Segmentation
-
1. Packaging Type
-
1.1. Rigid
-
1.1.1. By Material
- 1.1.1.1. Polyethylene (PE)
- 1.1.1.2. Polyethylene Terephthalate (PET)
- 1.1.1.3. Polypropylene (PP)
- 1.1.1.4. Polystyrene (PS) and Expanded Polystyrene (EPS)
- 1.1.1.5. Polyvinyl Chloride (PVC)
-
1.1.2. By End-user Industry
- 1.1.2.1. Food
- 1.1.2.2. Beverage
- 1.1.2.3. Healthcare and Pharmaceutical
- 1.1.2.4. Cosmetics and Personal Care
- 1.1.2.5. Other End-user Industries
-
1.1.1. By Material
-
1.2. Flexible
- 1.2.1. Polyethene (PE)
- 1.2.2. Bi-orientated Polypropylene (BOPP)
- 1.2.3. Cast Polypropylene (CPP)
- 1.2.4. Other Flexible Plastic Packaging Materials
-
1.1. Rigid
-
2. Product
- 2.1. Bottles and Jars
- 2.2. Tubs, Cups, Bowls, and Trays
- 2.3. Intermediate Bulk Containers
- 2.4. Pouches
- 2.5. Other Products
-
3. Geography
- 3.1. United Arab Emirates
- 3.2. Saudi Arabia
- 3.3. Egypt
- 3.4. South Africa
- 3.5. Rest of Middle East and Africa
MEA Plastic Packaging Industry Segmentation By Geography
- 1. United Arab Emirates
- 2. Saudi Arabia
- 3. Egypt
- 4. South Africa
- 5. Rest of Middle East and Africa
MEA Plastic Packaging Industry REPORT HIGHLIGHTS
| Aspects | Details |
|---|---|
| Study Period | 2019-2033 |
| Base Year | 2024 |
| Estimated Year | 2025 |
| Forecast Period | 2025-2033 |
| Historical Period | 2019-2024 |
| Growth Rate | CAGR of 6.54% from 2019-2033 |
| Segmentation |
|
Table of Contents
- 1. Introduction
- 1.1. Research Scope
- 1.2. Market Segmentation
- 1.3. Research Methodology
- 1.4. Definitions and Assumptions
- 2. Executive Summary
- 2.1. Introduction
- 3. Market Dynamics
- 3.1. Introduction
- 3.2. Market Drivers
- 3.2.1. Demand for Oxo-Degradable Plastics
- 3.3. Market Restrains
- 3.3.1. Environmental Concerns Over Recycling and Safe Disposal and Price Volatility of Raw Materials
- 3.4. Market Trends
- 3.4.1. Flexible Packaging is Expected to Witness Significant Growth
- 4. Market Factor Analysis
- 4.1. Porters Five Forces
- 4.2. Supply/Value Chain
- 4.3. PESTEL analysis
- 4.4. Market Entropy
- 4.5. Patent/Trademark Analysis
- 5. Global MEA Plastic Packaging Industry Analysis, Insights and Forecast, 2019-2031
- 5.1. Market Analysis, Insights and Forecast - by Packaging Type
- 5.1.1. Rigid
- 5.1.1.1. By Material
- 5.1.1.1.1. Polyethylene (PE)
- 5.1.1.1.2. Polyethylene Terephthalate (PET)
- 5.1.1.1.3. Polypropylene (PP)
- 5.1.1.1.4. Polystyrene (PS) and Expanded Polystyrene (EPS)
- 5.1.1.1.5. Polyvinyl Chloride (PVC)
- 5.1.1.2. By End-user Industry
- 5.1.1.2.1. Food
- 5.1.1.2.2. Beverage
- 5.1.1.2.3. Healthcare and Pharmaceutical
- 5.1.1.2.4. Cosmetics and Personal Care
- 5.1.1.2.5. Other End-user Industries
- 5.1.1.1. By Material
- 5.1.2. Flexible
- 5.1.2.1. Polyethene (PE)
- 5.1.2.2. Bi-orientated Polypropylene (BOPP)
- 5.1.2.3. Cast Polypropylene (CPP)
- 5.1.2.4. Other Flexible Plastic Packaging Materials
- 5.1.1. Rigid
- 5.2. Market Analysis, Insights and Forecast - by Product
- 5.2.1. Bottles and Jars
- 5.2.2. Tubs, Cups, Bowls, and Trays
- 5.2.3. Intermediate Bulk Containers
- 5.2.4. Pouches
- 5.2.5. Other Products
- 5.3. Market Analysis, Insights and Forecast - by Geography
- 5.3.1. United Arab Emirates
- 5.3.2. Saudi Arabia
- 5.3.3. Egypt
- 5.3.4. South Africa
- 5.3.5. Rest of Middle East and Africa
- 5.4. Market Analysis, Insights and Forecast - by Region
- 5.4.1. United Arab Emirates
- 5.4.2. Saudi Arabia
- 5.4.3. Egypt
- 5.4.4. South Africa
- 5.4.5. Rest of Middle East and Africa
- 5.1. Market Analysis, Insights and Forecast - by Packaging Type
- 6. United Arab Emirates MEA Plastic Packaging Industry Analysis, Insights and Forecast, 2019-2031
- 6.1. Market Analysis, Insights and Forecast - by Packaging Type
- 6.1.1. Rigid
- 6.1.1.1. By Material
- 6.1.1.1.1. Polyethylene (PE)
- 6.1.1.1.2. Polyethylene Terephthalate (PET)
- 6.1.1.1.3. Polypropylene (PP)
- 6.1.1.1.4. Polystyrene (PS) and Expanded Polystyrene (EPS)
- 6.1.1.1.5. Polyvinyl Chloride (PVC)
- 6.1.1.2. By End-user Industry
- 6.1.1.2.1. Food
- 6.1.1.2.2. Beverage
- 6.1.1.2.3. Healthcare and Pharmaceutical
- 6.1.1.2.4. Cosmetics and Personal Care
- 6.1.1.2.5. Other End-user Industries
- 6.1.1.1. By Material
- 6.1.2. Flexible
- 6.1.2.1. Polyethene (PE)
- 6.1.2.2. Bi-orientated Polypropylene (BOPP)
- 6.1.2.3. Cast Polypropylene (CPP)
- 6.1.2.4. Other Flexible Plastic Packaging Materials
- 6.1.1. Rigid
- 6.2. Market Analysis, Insights and Forecast - by Product
- 6.2.1. Bottles and Jars
- 6.2.2. Tubs, Cups, Bowls, and Trays
- 6.2.3. Intermediate Bulk Containers
- 6.2.4. Pouches
- 6.2.5. Other Products
- 6.3. Market Analysis, Insights and Forecast - by Geography
- 6.3.1. United Arab Emirates
- 6.3.2. Saudi Arabia
- 6.3.3. Egypt
- 6.3.4. South Africa
- 6.3.5. Rest of Middle East and Africa
- 6.1. Market Analysis, Insights and Forecast - by Packaging Type
- 7. Saudi Arabia MEA Plastic Packaging Industry Analysis, Insights and Forecast, 2019-2031
- 7.1. Market Analysis, Insights and Forecast - by Packaging Type
- 7.1.1. Rigid
- 7.1.1.1. By Material
- 7.1.1.1.1. Polyethylene (PE)
- 7.1.1.1.2. Polyethylene Terephthalate (PET)
- 7.1.1.1.3. Polypropylene (PP)
- 7.1.1.1.4. Polystyrene (PS) and Expanded Polystyrene (EPS)
- 7.1.1.1.5. Polyvinyl Chloride (PVC)
- 7.1.1.2. By End-user Industry
- 7.1.1.2.1. Food
- 7.1.1.2.2. Beverage
- 7.1.1.2.3. Healthcare and Pharmaceutical
- 7.1.1.2.4. Cosmetics and Personal Care
- 7.1.1.2.5. Other End-user Industries
- 7.1.1.1. By Material
- 7.1.2. Flexible
- 7.1.2.1. Polyethene (PE)
- 7.1.2.2. Bi-orientated Polypropylene (BOPP)
- 7.1.2.3. Cast Polypropylene (CPP)
- 7.1.2.4. Other Flexible Plastic Packaging Materials
- 7.1.1. Rigid
- 7.2. Market Analysis, Insights and Forecast - by Product
- 7.2.1. Bottles and Jars
- 7.2.2. Tubs, Cups, Bowls, and Trays
- 7.2.3. Intermediate Bulk Containers
- 7.2.4. Pouches
- 7.2.5. Other Products
- 7.3. Market Analysis, Insights and Forecast - by Geography
- 7.3.1. United Arab Emirates
- 7.3.2. Saudi Arabia
- 7.3.3. Egypt
- 7.3.4. South Africa
- 7.3.5. Rest of Middle East and Africa
- 7.1. Market Analysis, Insights and Forecast - by Packaging Type
- 8. Egypt MEA Plastic Packaging Industry Analysis, Insights and Forecast, 2019-2031
- 8.1. Market Analysis, Insights and Forecast - by Packaging Type
- 8.1.1. Rigid
- 8.1.1.1. By Material
- 8.1.1.1.1. Polyethylene (PE)
- 8.1.1.1.2. Polyethylene Terephthalate (PET)
- 8.1.1.1.3. Polypropylene (PP)
- 8.1.1.1.4. Polystyrene (PS) and Expanded Polystyrene (EPS)
- 8.1.1.1.5. Polyvinyl Chloride (PVC)
- 8.1.1.2. By End-user Industry
- 8.1.1.2.1. Food
- 8.1.1.2.2. Beverage
- 8.1.1.2.3. Healthcare and Pharmaceutical
- 8.1.1.2.4. Cosmetics and Personal Care
- 8.1.1.2.5. Other End-user Industries
- 8.1.1.1. By Material
- 8.1.2. Flexible
- 8.1.2.1. Polyethene (PE)
- 8.1.2.2. Bi-orientated Polypropylene (BOPP)
- 8.1.2.3. Cast Polypropylene (CPP)
- 8.1.2.4. Other Flexible Plastic Packaging Materials
- 8.1.1. Rigid
- 8.2. Market Analysis, Insights and Forecast - by Product
- 8.2.1. Bottles and Jars
- 8.2.2. Tubs, Cups, Bowls, and Trays
- 8.2.3. Intermediate Bulk Containers
- 8.2.4. Pouches
- 8.2.5. Other Products
- 8.3. Market Analysis, Insights and Forecast - by Geography
- 8.3.1. United Arab Emirates
- 8.3.2. Saudi Arabia
- 8.3.3. Egypt
- 8.3.4. South Africa
- 8.3.5. Rest of Middle East and Africa
- 8.1. Market Analysis, Insights and Forecast - by Packaging Type
- 9. South Africa MEA Plastic Packaging Industry Analysis, Insights and Forecast, 2019-2031
- 9.1. Market Analysis, Insights and Forecast - by Packaging Type
- 9.1.1. Rigid
- 9.1.1.1. By Material
- 9.1.1.1.1. Polyethylene (PE)
- 9.1.1.1.2. Polyethylene Terephthalate (PET)
- 9.1.1.1.3. Polypropylene (PP)
- 9.1.1.1.4. Polystyrene (PS) and Expanded Polystyrene (EPS)
- 9.1.1.1.5. Polyvinyl Chloride (PVC)
- 9.1.1.2. By End-user Industry
- 9.1.1.2.1. Food
- 9.1.1.2.2. Beverage
- 9.1.1.2.3. Healthcare and Pharmaceutical
- 9.1.1.2.4. Cosmetics and Personal Care
- 9.1.1.2.5. Other End-user Industries
- 9.1.1.1. By Material
- 9.1.2. Flexible
- 9.1.2.1. Polyethene (PE)
- 9.1.2.2. Bi-orientated Polypropylene (BOPP)
- 9.1.2.3. Cast Polypropylene (CPP)
- 9.1.2.4. Other Flexible Plastic Packaging Materials
- 9.1.1. Rigid
- 9.2. Market Analysis, Insights and Forecast - by Product
- 9.2.1. Bottles and Jars
- 9.2.2. Tubs, Cups, Bowls, and Trays
- 9.2.3. Intermediate Bulk Containers
- 9.2.4. Pouches
- 9.2.5. Other Products
- 9.3. Market Analysis, Insights and Forecast - by Geography
- 9.3.1. United Arab Emirates
- 9.3.2. Saudi Arabia
- 9.3.3. Egypt
- 9.3.4. South Africa
- 9.3.5. Rest of Middle East and Africa
- 9.1. Market Analysis, Insights and Forecast - by Packaging Type
- 10. Rest of Middle East and Africa MEA Plastic Packaging Industry Analysis, Insights and Forecast, 2019-2031
- 10.1. Market Analysis, Insights and Forecast - by Packaging Type
- 10.1.1. Rigid
- 10.1.1.1. By Material
- 10.1.1.1.1. Polyethylene (PE)
- 10.1.1.1.2. Polyethylene Terephthalate (PET)
- 10.1.1.1.3. Polypropylene (PP)
- 10.1.1.1.4. Polystyrene (PS) and Expanded Polystyrene (EPS)
- 10.1.1.1.5. Polyvinyl Chloride (PVC)
- 10.1.1.2. By End-user Industry
- 10.1.1.2.1. Food
- 10.1.1.2.2. Beverage
- 10.1.1.2.3. Healthcare and Pharmaceutical
- 10.1.1.2.4. Cosmetics and Personal Care
- 10.1.1.2.5. Other End-user Industries
- 10.1.1.1. By Material
- 10.1.2. Flexible
- 10.1.2.1. Polyethene (PE)
- 10.1.2.2. Bi-orientated Polypropylene (BOPP)
- 10.1.2.3. Cast Polypropylene (CPP)
- 10.1.2.4. Other Flexible Plastic Packaging Materials
- 10.1.1. Rigid
- 10.2. Market Analysis, Insights and Forecast - by Product
- 10.2.1. Bottles and Jars
- 10.2.2. Tubs, Cups, Bowls, and Trays
- 10.2.3. Intermediate Bulk Containers
- 10.2.4. Pouches
- 10.2.5. Other Products
- 10.3. Market Analysis, Insights and Forecast - by Geography
- 10.3.1. United Arab Emirates
- 10.3.2. Saudi Arabia
- 10.3.3. Egypt
- 10.3.4. South Africa
- 10.3.5. Rest of Middle East and Africa
- 10.1. Market Analysis, Insights and Forecast - by Packaging Type
- 11. North America MEA Plastic Packaging Industry Analysis, Insights and Forecast, 2019-2031
- 11.1. Market Analysis, Insights and Forecast - By Country/Sub-region
- 11.1.1 United States
- 11.1.2 Canada
- 11.1.3 Mexico
- 12. Europe MEA Plastic Packaging Industry Analysis, Insights and Forecast, 2019-2031
- 12.1. Market Analysis, Insights and Forecast - By Country/Sub-region
- 12.1.1 Germany
- 12.1.2 United Kingdom
- 12.1.3 France
- 12.1.4 Spain
- 12.1.5 Italy
- 12.1.6 Spain
- 12.1.7 Belgium
- 12.1.8 Netherland
- 12.1.9 Nordics
- 12.1.10 Rest of Europe
- 13. Asia Pacific MEA Plastic Packaging Industry Analysis, Insights and Forecast, 2019-2031
- 13.1. Market Analysis, Insights and Forecast - By Country/Sub-region
- 13.1.1 China
- 13.1.2 Japan
- 13.1.3 India
- 13.1.4 South Korea
- 13.1.5 Southeast Asia
- 13.1.6 Australia
- 13.1.7 Indonesia
- 13.1.8 Phillipes
- 13.1.9 Singapore
- 13.1.10 Thailandc
- 13.1.11 Rest of Asia Pacific
- 14. South America MEA Plastic Packaging Industry Analysis, Insights and Forecast, 2019-2031
- 14.1. Market Analysis, Insights and Forecast - By Country/Sub-region
- 14.1.1 Brazil
- 14.1.2 Argentina
- 14.1.3 Peru
- 14.1.4 Chile
- 14.1.5 Colombia
- 14.1.6 Ecuador
- 14.1.7 Venezuela
- 14.1.8 Rest of South America
- 15. North America MEA Plastic Packaging Industry Analysis, Insights and Forecast, 2019-2031
- 15.1. Market Analysis, Insights and Forecast - By Country/Sub-region
- 15.1.1 United States
- 15.1.2 Canada
- 15.1.3 Mexico
- 16. MEA MEA Plastic Packaging Industry Analysis, Insights and Forecast, 2019-2031
- 16.1. Market Analysis, Insights and Forecast - By Country/Sub-region
- 16.1.1 United Arab Emirates
- 16.1.2 Saudi Arabia
- 16.1.3 South Africa
- 16.1.4 Rest of Middle East and Africa
- 17. Competitive Analysis
- 17.1. Global Market Share Analysis 2024
- 17.2. Company Profiles
- 17.2.1 KANR For Plastic Industries
- 17.2.1.1. Overview
- 17.2.1.2. Products
- 17.2.1.3. SWOT Analysis
- 17.2.1.4. Recent Developments
- 17.2.1.5. Financials (Based on Availability)
- 17.2.2 Al Nawakheth Factory Company
- 17.2.2.1. Overview
- 17.2.2.2. Products
- 17.2.2.3. SWOT Analysis
- 17.2.2.4. Recent Developments
- 17.2.2.5. Financials (Based on Availability)
- 17.2.3 Arabian Plastics Industrial Company Limited (APICO)
- 17.2.3.1. Overview
- 17.2.3.2. Products
- 17.2.3.3. SWOT Analysis
- 17.2.3.4. Recent Developments
- 17.2.3.5. Financials (Based on Availability)
- 17.2.4 Napco Group (Napco National)
- 17.2.4.1. Overview
- 17.2.4.2. Products
- 17.2.4.3. SWOT Analysis
- 17.2.4.4. Recent Developments
- 17.2.4.5. Financials (Based on Availability)
- 17.2.5 SABIC - Saudi Basic Industries Corporation
- 17.2.5.1. Overview
- 17.2.5.2. Products
- 17.2.5.3. SWOT Analysis
- 17.2.5.4. Recent Developments
- 17.2.5.5. Financials (Based on Availability)
- 17.2.6 Zamil Plastic Industries Co
- 17.2.6.1. Overview
- 17.2.6.2. Products
- 17.2.6.3. SWOT Analysis
- 17.2.6.4. Recent Developments
- 17.2.6.5. Financials (Based on Availability)
- 17.2.7 Sealed Air Corporation (Sealed Air Saudi Arabia)*List Not Exhaustive
- 17.2.7.1. Overview
- 17.2.7.2. Products
- 17.2.7.3. SWOT Analysis
- 17.2.7.4. Recent Developments
- 17.2.7.5. Financials (Based on Availability)
- 17.2.8 Takween Advanced Industries
- 17.2.8.1. Overview
- 17.2.8.2. Products
- 17.2.8.3. SWOT Analysis
- 17.2.8.4. Recent Developments
- 17.2.8.5. Financials (Based on Availability)
- 17.2.9 AL-Ghandoura Co Manuf Plastic GhanPlast)
- 17.2.9.1. Overview
- 17.2.9.2. Products
- 17.2.9.3. SWOT Analysis
- 17.2.9.4. Recent Developments
- 17.2.9.5. Financials (Based on Availability)
- 17.2.10 Saudi Arabian Packaging Industry WLL (SAPIN)
- 17.2.10.1. Overview
- 17.2.10.2. Products
- 17.2.10.3. SWOT Analysis
- 17.2.10.4. Recent Developments
- 17.2.10.5. Financials (Based on Availability)
- 17.2.11 Saudi Plastic Factory Company
- 17.2.11.1. Overview
- 17.2.11.2. Products
- 17.2.11.3. SWOT Analysis
- 17.2.11.4. Recent Developments
- 17.2.11.5. Financials (Based on Availability)
- 17.2.12 Arnon Plastic Industry Co Ltd
- 17.2.12.1. Overview
- 17.2.12.2. Products
- 17.2.12.3. SWOT Analysis
- 17.2.12.4. Recent Developments
- 17.2.12.5. Financials (Based on Availability)
- 17.2.13 Plastico SPS
- 17.2.13.1. Overview
- 17.2.13.2. Products
- 17.2.13.3. SWOT Analysis
- 17.2.13.4. Recent Developments
- 17.2.13.5. Financials (Based on Availability)
- 17.2.14 Coloredsun
- 17.2.14.1. Overview
- 17.2.14.2. Products
- 17.2.14.3. SWOT Analysis
- 17.2.14.4. Recent Developments
- 17.2.14.5. Financials (Based on Availability)
- 17.2.15 National Plastic Factory LLC
- 17.2.15.1. Overview
- 17.2.15.2. Products
- 17.2.15.3. SWOT Analysis
- 17.2.15.4. Recent Developments
- 17.2.15.5. Financials (Based on Availability)
- 17.2.16 Packaging Products Company (PPC)
- 17.2.16.1. Overview
- 17.2.16.2. Products
- 17.2.16.3. SWOT Analysis
- 17.2.16.4. Recent Developments
- 17.2.16.5. Financials (Based on Availability)
- 17.2.1 KANR For Plastic Industries
List of Figures
- Figure 1: Global MEA Plastic Packaging Industry Revenue Breakdown (Million, %) by Region 2024 & 2032
- Figure 2: North America MEA Plastic Packaging Industry Revenue (Million), by Country 2024 & 2032
- Figure 3: North America MEA Plastic Packaging Industry Revenue Share (%), by Country 2024 & 2032
- Figure 4: Europe MEA Plastic Packaging Industry Revenue (Million), by Country 2024 & 2032
- Figure 5: Europe MEA Plastic Packaging Industry Revenue Share (%), by Country 2024 & 2032
- Figure 6: Asia Pacific MEA Plastic Packaging Industry Revenue (Million), by Country 2024 & 2032
- Figure 7: Asia Pacific MEA Plastic Packaging Industry Revenue Share (%), by Country 2024 & 2032
- Figure 8: South America MEA Plastic Packaging Industry Revenue (Million), by Country 2024 & 2032
- Figure 9: South America MEA Plastic Packaging Industry Revenue Share (%), by Country 2024 & 2032
- Figure 10: North America MEA Plastic Packaging Industry Revenue (Million), by Country 2024 & 2032
- Figure 11: North America MEA Plastic Packaging Industry Revenue Share (%), by Country 2024 & 2032
- Figure 12: MEA MEA Plastic Packaging Industry Revenue (Million), by Country 2024 & 2032
- Figure 13: MEA MEA Plastic Packaging Industry Revenue Share (%), by Country 2024 & 2032
- Figure 14: United Arab Emirates MEA Plastic Packaging Industry Revenue (Million), by Packaging Type 2024 & 2032
- Figure 15: United Arab Emirates MEA Plastic Packaging Industry Revenue Share (%), by Packaging Type 2024 & 2032
- Figure 16: United Arab Emirates MEA Plastic Packaging Industry Revenue (Million), by Product 2024 & 2032
- Figure 17: United Arab Emirates MEA Plastic Packaging Industry Revenue Share (%), by Product 2024 & 2032
- Figure 18: United Arab Emirates MEA Plastic Packaging Industry Revenue (Million), by Geography 2024 & 2032
- Figure 19: United Arab Emirates MEA Plastic Packaging Industry Revenue Share (%), by Geography 2024 & 2032
- Figure 20: United Arab Emirates MEA Plastic Packaging Industry Revenue (Million), by Country 2024 & 2032
- Figure 21: United Arab Emirates MEA Plastic Packaging Industry Revenue Share (%), by Country 2024 & 2032
- Figure 22: Saudi Arabia MEA Plastic Packaging Industry Revenue (Million), by Packaging Type 2024 & 2032
- Figure 23: Saudi Arabia MEA Plastic Packaging Industry Revenue Share (%), by Packaging Type 2024 & 2032
- Figure 24: Saudi Arabia MEA Plastic Packaging Industry Revenue (Million), by Product 2024 & 2032
- Figure 25: Saudi Arabia MEA Plastic Packaging Industry Revenue Share (%), by Product 2024 & 2032
- Figure 26: Saudi Arabia MEA Plastic Packaging Industry Revenue (Million), by Geography 2024 & 2032
- Figure 27: Saudi Arabia MEA Plastic Packaging Industry Revenue Share (%), by Geography 2024 & 2032
- Figure 28: Saudi Arabia MEA Plastic Packaging Industry Revenue (Million), by Country 2024 & 2032
- Figure 29: Saudi Arabia MEA Plastic Packaging Industry Revenue Share (%), by Country 2024 & 2032
- Figure 30: Egypt MEA Plastic Packaging Industry Revenue (Million), by Packaging Type 2024 & 2032
- Figure 31: Egypt MEA Plastic Packaging Industry Revenue Share (%), by Packaging Type 2024 & 2032
- Figure 32: Egypt MEA Plastic Packaging Industry Revenue (Million), by Product 2024 & 2032
- Figure 33: Egypt MEA Plastic Packaging Industry Revenue Share (%), by Product 2024 & 2032
- Figure 34: Egypt MEA Plastic Packaging Industry Revenue (Million), by Geography 2024 & 2032
- Figure 35: Egypt MEA Plastic Packaging Industry Revenue Share (%), by Geography 2024 & 2032
- Figure 36: Egypt MEA Plastic Packaging Industry Revenue (Million), by Country 2024 & 2032
- Figure 37: Egypt MEA Plastic Packaging Industry Revenue Share (%), by Country 2024 & 2032
- Figure 38: South Africa MEA Plastic Packaging Industry Revenue (Million), by Packaging Type 2024 & 2032
- Figure 39: South Africa MEA Plastic Packaging Industry Revenue Share (%), by Packaging Type 2024 & 2032
- Figure 40: South Africa MEA Plastic Packaging Industry Revenue (Million), by Product 2024 & 2032
- Figure 41: South Africa MEA Plastic Packaging Industry Revenue Share (%), by Product 2024 & 2032
- Figure 42: South Africa MEA Plastic Packaging Industry Revenue (Million), by Geography 2024 & 2032
- Figure 43: South Africa MEA Plastic Packaging Industry Revenue Share (%), by Geography 2024 & 2032
- Figure 44: South Africa MEA Plastic Packaging Industry Revenue (Million), by Country 2024 & 2032
- Figure 45: South Africa MEA Plastic Packaging Industry Revenue Share (%), by Country 2024 & 2032
- Figure 46: Rest of Middle East and Africa MEA Plastic Packaging Industry Revenue (Million), by Packaging Type 2024 & 2032
- Figure 47: Rest of Middle East and Africa MEA Plastic Packaging Industry Revenue Share (%), by Packaging Type 2024 & 2032
- Figure 48: Rest of Middle East and Africa MEA Plastic Packaging Industry Revenue (Million), by Product 2024 & 2032
- Figure 49: Rest of Middle East and Africa MEA Plastic Packaging Industry Revenue Share (%), by Product 2024 & 2032
- Figure 50: Rest of Middle East and Africa MEA Plastic Packaging Industry Revenue (Million), by Geography 2024 & 2032
- Figure 51: Rest of Middle East and Africa MEA Plastic Packaging Industry Revenue Share (%), by Geography 2024 & 2032
- Figure 52: Rest of Middle East and Africa MEA Plastic Packaging Industry Revenue (Million), by Country 2024 & 2032
- Figure 53: Rest of Middle East and Africa MEA Plastic Packaging Industry Revenue Share (%), by Country 2024 & 2032
List of Tables
- Table 1: Global MEA Plastic Packaging Industry Revenue Million Forecast, by Region 2019 & 2032
- Table 2: Global MEA Plastic Packaging Industry Revenue Million Forecast, by Packaging Type 2019 & 2032
- Table 3: Global MEA Plastic Packaging Industry Revenue Million Forecast, by Product 2019 & 2032
- Table 4: Global MEA Plastic Packaging Industry Revenue Million Forecast, by Geography 2019 & 2032
- Table 5: Global MEA Plastic Packaging Industry Revenue Million Forecast, by Region 2019 & 2032
- Table 6: Global MEA Plastic Packaging Industry Revenue Million Forecast, by Country 2019 & 2032
- Table 7: United States MEA Plastic Packaging Industry Revenue (Million) Forecast, by Application 2019 & 2032
- Table 8: Canada MEA Plastic Packaging Industry Revenue (Million) Forecast, by Application 2019 & 2032
- Table 9: Mexico MEA Plastic Packaging Industry Revenue (Million) Forecast, by Application 2019 & 2032
- Table 10: Global MEA Plastic Packaging Industry Revenue Million Forecast, by Country 2019 & 2032
- Table 11: Germany MEA Plastic Packaging Industry Revenue (Million) Forecast, by Application 2019 & 2032
- Table 12: United Kingdom MEA Plastic Packaging Industry Revenue (Million) Forecast, by Application 2019 & 2032
- Table 13: France MEA Plastic Packaging Industry Revenue (Million) Forecast, by Application 2019 & 2032
- Table 14: Spain MEA Plastic Packaging Industry Revenue (Million) Forecast, by Application 2019 & 2032
- Table 15: Italy MEA Plastic Packaging Industry Revenue (Million) Forecast, by Application 2019 & 2032
- Table 16: Spain MEA Plastic Packaging Industry Revenue (Million) Forecast, by Application 2019 & 2032
- Table 17: Belgium MEA Plastic Packaging Industry Revenue (Million) Forecast, by Application 2019 & 2032
- Table 18: Netherland MEA Plastic Packaging Industry Revenue (Million) Forecast, by Application 2019 & 2032
- Table 19: Nordics MEA Plastic Packaging Industry Revenue (Million) Forecast, by Application 2019 & 2032
- Table 20: Rest of Europe MEA Plastic Packaging Industry Revenue (Million) Forecast, by Application 2019 & 2032
- Table 21: Global MEA Plastic Packaging Industry Revenue Million Forecast, by Country 2019 & 2032
- Table 22: China MEA Plastic Packaging Industry Revenue (Million) Forecast, by Application 2019 & 2032
- Table 23: Japan MEA Plastic Packaging Industry Revenue (Million) Forecast, by Application 2019 & 2032
- Table 24: India MEA Plastic Packaging Industry Revenue (Million) Forecast, by Application 2019 & 2032
- Table 25: South Korea MEA Plastic Packaging Industry Revenue (Million) Forecast, by Application 2019 & 2032
- Table 26: Southeast Asia MEA Plastic Packaging Industry Revenue (Million) Forecast, by Application 2019 & 2032
- Table 27: Australia MEA Plastic Packaging Industry Revenue (Million) Forecast, by Application 2019 & 2032
- Table 28: Indonesia MEA Plastic Packaging Industry Revenue (Million) Forecast, by Application 2019 & 2032
- Table 29: Phillipes MEA Plastic Packaging Industry Revenue (Million) Forecast, by Application 2019 & 2032
- Table 30: Singapore MEA Plastic Packaging Industry Revenue (Million) Forecast, by Application 2019 & 2032
- Table 31: Thailandc MEA Plastic Packaging Industry Revenue (Million) Forecast, by Application 2019 & 2032
- Table 32: Rest of Asia Pacific MEA Plastic Packaging Industry Revenue (Million) Forecast, by Application 2019 & 2032
- Table 33: Global MEA Plastic Packaging Industry Revenue Million Forecast, by Country 2019 & 2032
- Table 34: Brazil MEA Plastic Packaging Industry Revenue (Million) Forecast, by Application 2019 & 2032
- Table 35: Argentina MEA Plastic Packaging Industry Revenue (Million) Forecast, by Application 2019 & 2032
- Table 36: Peru MEA Plastic Packaging Industry Revenue (Million) Forecast, by Application 2019 & 2032
- Table 37: Chile MEA Plastic Packaging Industry Revenue (Million) Forecast, by Application 2019 & 2032
- Table 38: Colombia MEA Plastic Packaging Industry Revenue (Million) Forecast, by Application 2019 & 2032
- Table 39: Ecuador MEA Plastic Packaging Industry Revenue (Million) Forecast, by Application 2019 & 2032
- Table 40: Venezuela MEA Plastic Packaging Industry Revenue (Million) Forecast, by Application 2019 & 2032
- Table 41: Rest of South America MEA Plastic Packaging Industry Revenue (Million) Forecast, by Application 2019 & 2032
- Table 42: Global MEA Plastic Packaging Industry Revenue Million Forecast, by Country 2019 & 2032
- Table 43: United States MEA Plastic Packaging Industry Revenue (Million) Forecast, by Application 2019 & 2032
- Table 44: Canada MEA Plastic Packaging Industry Revenue (Million) Forecast, by Application 2019 & 2032
- Table 45: Mexico MEA Plastic Packaging Industry Revenue (Million) Forecast, by Application 2019 & 2032
- Table 46: Global MEA Plastic Packaging Industry Revenue Million Forecast, by Country 2019 & 2032
- Table 47: United Arab Emirates MEA Plastic Packaging Industry Revenue (Million) Forecast, by Application 2019 & 2032
- Table 48: Saudi Arabia MEA Plastic Packaging Industry Revenue (Million) Forecast, by Application 2019 & 2032
- Table 49: South Africa MEA Plastic Packaging Industry Revenue (Million) Forecast, by Application 2019 & 2032
- Table 50: Rest of Middle East and Africa MEA Plastic Packaging Industry Revenue (Million) Forecast, by Application 2019 & 2032
- Table 51: Global MEA Plastic Packaging Industry Revenue Million Forecast, by Packaging Type 2019 & 2032
- Table 52: Global MEA Plastic Packaging Industry Revenue Million Forecast, by Product 2019 & 2032
- Table 53: Global MEA Plastic Packaging Industry Revenue Million Forecast, by Geography 2019 & 2032
- Table 54: Global MEA Plastic Packaging Industry Revenue Million Forecast, by Country 2019 & 2032
- Table 55: Global MEA Plastic Packaging Industry Revenue Million Forecast, by Packaging Type 2019 & 2032
- Table 56: Global MEA Plastic Packaging Industry Revenue Million Forecast, by Product 2019 & 2032
- Table 57: Global MEA Plastic Packaging Industry Revenue Million Forecast, by Geography 2019 & 2032
- Table 58: Global MEA Plastic Packaging Industry Revenue Million Forecast, by Country 2019 & 2032
- Table 59: Global MEA Plastic Packaging Industry Revenue Million Forecast, by Packaging Type 2019 & 2032
- Table 60: Global MEA Plastic Packaging Industry Revenue Million Forecast, by Product 2019 & 2032
- Table 61: Global MEA Plastic Packaging Industry Revenue Million Forecast, by Geography 2019 & 2032
- Table 62: Global MEA Plastic Packaging Industry Revenue Million Forecast, by Country 2019 & 2032
- Table 63: Global MEA Plastic Packaging Industry Revenue Million Forecast, by Packaging Type 2019 & 2032
- Table 64: Global MEA Plastic Packaging Industry Revenue Million Forecast, by Product 2019 & 2032
- Table 65: Global MEA Plastic Packaging Industry Revenue Million Forecast, by Geography 2019 & 2032
- Table 66: Global MEA Plastic Packaging Industry Revenue Million Forecast, by Country 2019 & 2032
- Table 67: Global MEA Plastic Packaging Industry Revenue Million Forecast, by Packaging Type 2019 & 2032
- Table 68: Global MEA Plastic Packaging Industry Revenue Million Forecast, by Product 2019 & 2032
- Table 69: Global MEA Plastic Packaging Industry Revenue Million Forecast, by Geography 2019 & 2032
- Table 70: Global MEA Plastic Packaging Industry Revenue Million Forecast, by Country 2019 & 2032
Frequently Asked Questions
1. What is the projected Compound Annual Growth Rate (CAGR) of the MEA Plastic Packaging Industry?
The projected CAGR is approximately 6.54%.
2. Which companies are prominent players in the MEA Plastic Packaging Industry?
Key companies in the market include KANR For Plastic Industries, Al Nawakheth Factory Company, Arabian Plastics Industrial Company Limited (APICO), Napco Group (Napco National), SABIC - Saudi Basic Industries Corporation, Zamil Plastic Industries Co, Sealed Air Corporation (Sealed Air Saudi Arabia)*List Not Exhaustive, Takween Advanced Industries, AL-Ghandoura Co Manuf Plastic GhanPlast), Saudi Arabian Packaging Industry WLL (SAPIN), Saudi Plastic Factory Company, Arnon Plastic Industry Co Ltd, Plastico SPS, Coloredsun, National Plastic Factory LLC, Packaging Products Company (PPC).
3. What are the main segments of the MEA Plastic Packaging Industry?
The market segments include Packaging Type, Product, Geography.
4. Can you provide details about the market size?
The market size is estimated to be USD XX Million as of 2022.
5. What are some drivers contributing to market growth?
Demand for Oxo-Degradable Plastics.
6. What are the notable trends driving market growth?
Flexible Packaging is Expected to Witness Significant Growth.
7. Are there any restraints impacting market growth?
Environmental Concerns Over Recycling and Safe Disposal and Price Volatility of Raw Materials.
8. Can you provide examples of recent developments in the market?
June 2022: Sabic, a global leader in the chemical industry, joined forces with Heinz, Tesco, and Berry in an innovative recycling trial in the United Kingdom designed to close the loop on soft plastic food packaging. Flexible plastic packaging collected from Tesco stores has been used to produce certified circular polypropylene (PP) from Sabic's Trucircle portfolio for microwavable Heinz Beanz Snap Pots, made from 39% recycled soft plastic. Consumers are encouraged to return the soft plastic packaging to collection points at Tesco stores.
9. What pricing options are available for accessing the report?
Pricing options include single-user, multi-user, and enterprise licenses priced at USD 4750, USD 5250, and USD 8750 respectively.
10. Is the market size provided in terms of value or volume?
The market size is provided in terms of value, measured in Million.
11. Are there any specific market keywords associated with the report?
Yes, the market keyword associated with the report is "MEA Plastic Packaging Industry," which aids in identifying and referencing the specific market segment covered.
12. How do I determine which pricing option suits my needs best?
The pricing options vary based on user requirements and access needs. Individual users may opt for single-user licenses, while businesses requiring broader access may choose multi-user or enterprise licenses for cost-effective access to the report.
13. Are there any additional resources or data provided in the MEA Plastic Packaging Industry report?
While the report offers comprehensive insights, it's advisable to review the specific contents or supplementary materials provided to ascertain if additional resources or data are available.
14. How can I stay updated on further developments or reports in the MEA Plastic Packaging Industry?
To stay informed about further developments, trends, and reports in the MEA Plastic Packaging Industry, consider subscribing to industry newsletters, following relevant companies and organizations, or regularly checking reputable industry news sources and publications.
Methodology
Step 1 - Identification of Relevant Samples Size from Population Database


Step 2 - Approaches for Defining Global Market Size (Value, Volume* & Price*)

Note*: In applicable scenarios
Step 3 - Data Sources
Primary Research
- Web Analytics
- Survey Reports
- Research Institute
- Latest Research Reports
- Opinion Leaders
Secondary Research
- Annual Reports
- White Paper
- Latest Press Release
- Industry Association
- Paid Database
- Investor Presentations

Step 4 - Data Triangulation
Involves using different sources of information in order to increase the validity of a study
These sources are likely to be stakeholders in a program - participants, other researchers, program staff, other community members, and so on.
Then we put all data in single framework & apply various statistical tools to find out the dynamic on the market.
During the analysis stage, feedback from the stakeholder groups would be compared to determine areas of agreement as well as areas of divergence
