

Key Insights
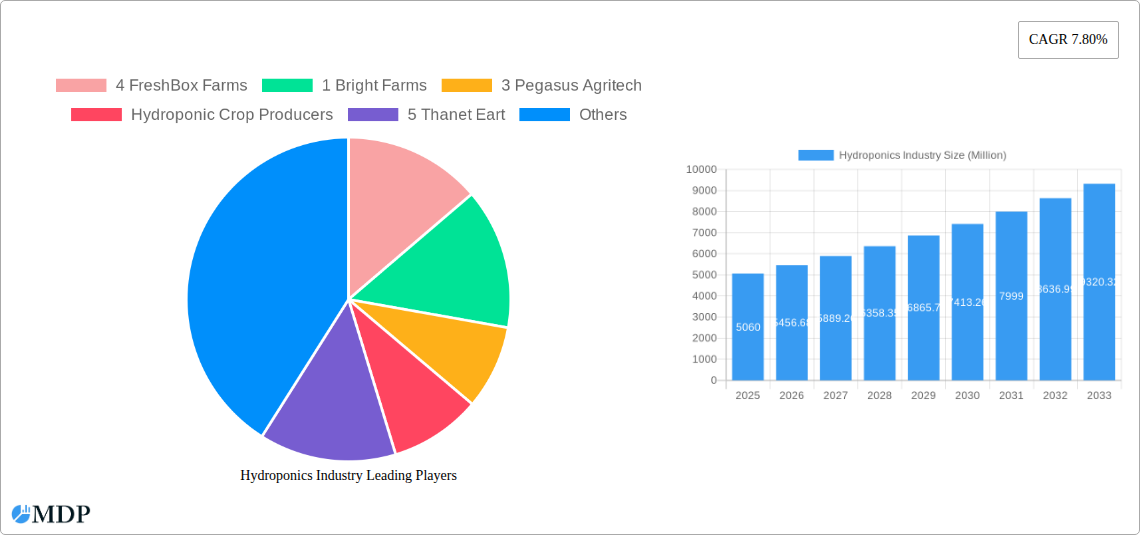
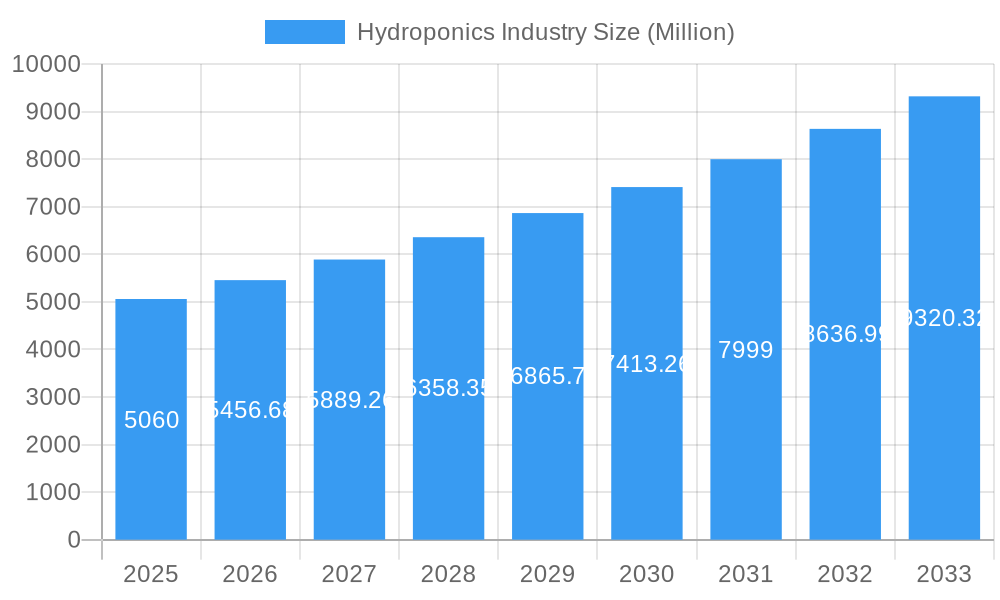
The global hydroponics industry, valued at $5.06 billion in 2025, is experiencing robust growth, projected to expand at a compound annual growth rate (CAGR) of 7.80% from 2025 to 2033. This surge is driven by several key factors. Increasing urbanization and a growing global population are placing significant pressure on traditional agricultural land, making hydroponics, with its higher yields per unit area and reduced land dependency, an increasingly attractive solution. Furthermore, rising consumer demand for fresh, locally-sourced produce fuels the adoption of hydroponic farming, which allows for year-round production regardless of climate or seasonality. Technological advancements in hydroponic systems, particularly in areas like automation and data analytics, are also boosting efficiency and profitability, driving further market expansion. The segments exhibiting the strongest growth include aggregate hydroponic systems due to their scalability and ease of management, and leafy greens (lettuce, microgreens) owing to high consumer preference and shorter growing cycles. Leading companies like Village Farms International Inc. and Bright Farms are leveraging these trends, expanding their production capacities and investing in research and development to maintain their market leadership. However, high initial investment costs and the need for specialized expertise can act as restraints, particularly for smaller-scale operations.
Hydroponics Industry Market Size (In Billion)
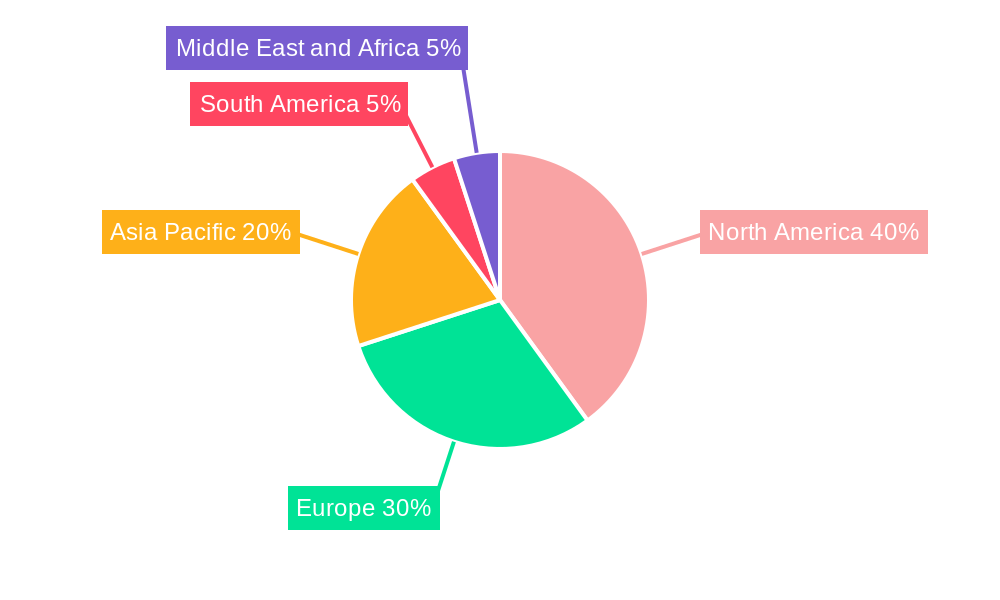
The regional distribution of the hydroponics market reflects diverse growth patterns. North America, particularly the United States, currently holds a significant market share due to established infrastructure and high consumer adoption. However, the Asia-Pacific region is poised for substantial growth in the coming years, driven by increasing disposable incomes, rising demand for healthy food options, and government initiatives supporting sustainable agriculture. Europe also represents a significant market, with increasing adoption in countries like the Netherlands and Germany. The Middle East and Africa are witnessing gradual adoption, albeit at a slower pace, due to factors such as water scarcity and infrastructural limitations in some regions. Future growth will likely hinge on continued technological innovation, government support for sustainable agriculture, and increased awareness among consumers about the benefits of hydroponically grown produce. Further market segmentation by specific crop types beyond the initially mentioned ones (tomato, pepper, cucumber) will be crucial to understand specific niche market opportunities.
Hydroponics Industry Company Market Share
Hydroponics Industry Market Report: 2019-2033
This comprehensive report provides an in-depth analysis of the global hydroponics industry, projecting a market value exceeding xx Million by 2033. The study period covers 2019-2033, with 2025 serving as the base and estimated year. This report is crucial for investors, industry stakeholders, and businesses seeking to understand the market dynamics, growth opportunities, and competitive landscape of this rapidly expanding sector. With detailed insights into market segmentation, key players, and future trends, this report empowers informed decision-making and strategic planning within the hydroponics industry.
Hydroponics Industry Market Dynamics & Concentration
The hydroponics market is characterized by a moderately concentrated landscape with several key players vying for market share. While precise market share figures for individual companies are not publicly available for all players, the overall market is experiencing significant growth, driven by several factors.
Market Concentration: The market exhibits moderate concentration, with a few large players commanding significant portions of the overall revenue. However, the presence of numerous smaller companies specializing in niche segments or regional markets contributes to a dynamic competitive landscape. The exact market share distribution varies across different segments (e.g., system type, crop type, geographic location) and requires further in-depth research beyond the scope of this brief. For instance, companies like Village Farms International Inc. and Bright Farms hold substantial market share in certain regions and crop segments.
Innovation Drivers: Technological advancements in lighting, nutrient delivery systems, automation, and data analytics are pivotal drivers. These innovations enhance efficiency, reduce resource consumption, and increase crop yields.
Regulatory Frameworks: Government policies supporting sustainable agriculture and food security are promoting hydroponics adoption. However, variations in regulations across different regions can create challenges for market expansion.
Product Substitutes: Traditional agriculture remains the primary substitute, but hydroponics offers competitive advantages in terms of yield, water efficiency, and environmental sustainability, gradually diminishing the overall impact of substitutes.
End-User Trends: Increasing consumer demand for locally sourced, fresh produce, coupled with growing awareness of sustainable agricultural practices, fuels market growth. Restaurant chains and grocery stores are increasingly sourcing hydroponically grown produce.
M&A Activities: Mergers and acquisitions (M&A) are relatively frequent, reflecting industry consolidation and expansion strategies. While precise M&A deal counts for the period are not readily available, the overall trend signifies a healthy level of investment and industry activity. The number of transactions is expected to be in the xx range within the study period.
Hydroponics Industry Industry Trends & Analysis
The hydroponics industry is experiencing robust growth, driven by several key factors. The market exhibits a Compound Annual Growth Rate (CAGR) of xx% during the forecast period (2025-2033). Market penetration is increasing steadily, particularly in developed regions and urban areas with limited arable land.
Technological advancements are central to industry growth. The introduction of advanced sensors, automation, AI-driven analytics, and improved lighting systems boosts productivity, reduces operational costs, and enhances overall efficiency. Consumer preferences for fresh, high-quality produce are also driving demand. Consumers are increasingly seeking out sustainable and locally produced food options. Competitive dynamics are shaped by both large established companies and innovative startups, leading to continuous innovation and improvement in system design, technology, and crop production techniques. This competitive landscape contributes to price competitiveness, making hydroponics an increasingly viable solution for commercial agricultural applications. The precise market penetration rate is heavily dependent on geographic region, crop type, and specific systems used, therefore, requires specific regional data for precise analysis.
Leading Markets & Segments in Hydroponics Industry
The global hydroponics market is witnessing significant growth across different regions and segments. Specific regional dominance requires a more detailed regional analysis which is beyond the scope of this summary. However, some general observations can be made.
Dominant Segments:
- Type: Both aggregate hydroponic systems and open (liquid) systems are experiencing growth, each possessing specific advantages and applications. The preference between these two systems often depends on factors such as scalability, crop type, and available resources.
- Crop Type: Lettuce and leafy greens currently dominate the hydroponic crop market due to their suitability for controlled environments and high consumer demand. However, tomatoes, peppers, cucumbers, and microgreens are showing rapid growth in production, reflecting increasing technological advancements and market demand. Other crop types, including herbs and specialty produce, represent a substantial niche market with strong future potential.
Key Drivers:
- Economic Policies: Government incentives, subsidies, and tax breaks promoting sustainable agriculture significantly contribute to regional growth.
- Infrastructure: Reliable water and energy infrastructure is essential for successful hydroponic operations. Regions with well-developed infrastructure tend to experience faster market expansion.
While precise figures on regional dominance and segment shares require detailed statistical data, it is clear that North America and Europe are currently leading the market, followed by Asia-Pacific and other regions.
Hydroponics Industry Product Developments
Recent advancements in hydroponic technology have focused on developing more efficient and cost-effective systems. This includes improvements in LED lighting, automated nutrient delivery systems, and sophisticated environmental control technologies. These innovations enhance crop yield, reduce energy consumption, and improve overall productivity. Furthermore, there's a growing trend towards modular and scalable systems that allow for easy expansion or customization based on specific needs. The development of hydroponic systems adapted to different crop types, climates, and production scales enhances their global applicability and market appeal.
Key Drivers of Hydroponics Industry Growth
Several factors are driving the growth of the hydroponics industry.
- Technological Advancements: Innovations in lighting, automation, and data analytics are boosting productivity and efficiency.
- Economic Factors: Rising food prices and growing consumer demand for fresh produce are driving market expansion.
- Regulatory Support: Government initiatives promoting sustainable agriculture are creating a favorable environment for hydroponic farming. For example, subsidies and tax benefits targeted at hydroponic operations are spurring growth in certain regions.
Challenges in the Hydroponics Industry Market
The hydroponics industry faces several challenges:
- High Initial Investment Costs: Setting up hydroponic systems requires a significant upfront investment, potentially hindering smaller-scale operations.
- Energy Consumption: Hydroponic systems rely on significant energy resources, particularly lighting and climate control.
- Disease and Pest Management: Maintaining a controlled environment is crucial to prevent diseases and pest outbreaks. Developing effective disease prevention strategies and control mechanisms is an ongoing challenge.
- Technological Complexity: Operating and maintaining advanced hydroponic systems requires specialized knowledge and expertise. The lack of skilled labor can limit market growth in some regions.
Emerging Opportunities in Hydroponics Industry
The hydroponics industry presents several attractive opportunities. Further technological breakthroughs, particularly in AI-driven automation and advanced nutrient management systems, are expected to further enhance efficiency and reduce production costs. Strategic partnerships between hydroponic companies, food retailers, and technology providers are fostering market expansion and innovation. Furthermore, significant expansion into developing regions with water scarcity issues presents a major growth opportunity, enabling increased food security and resource-efficient agriculture.
Leading Players in the Hydroponics Industry Sector
- 4 FreshBox Farms
- Bright Farms
- Pegasus Agritech
- Hydroponic Crop Producers
- Thanet Earth
- Village Farms International Inc
Key Milestones in Hydroponics Industry Industry
- July 2022: Bustanica unveils the world's largest hydroponic farm, receiving a USD 40 million investment. This signifies a significant step towards large-scale, commercial hydroponic food production.
- October 2022: GrowGeneration Corp. expands its retail presence to 17 states, highlighting the growing market for hydroponic supplies and equipment.
- January 2024: Bright Farms expands its operations to three new locations, demonstrating the increasing demand for hydroponically grown leafy greens.
- March 2024: INSONGREEN's expansion into the Middle East and Africa highlights the potential of hydroponics to address food security challenges in water-scarce regions.
Strategic Outlook for Hydroponics Industry Market
The hydroponics market shows immense long-term growth potential, driven by technological advancements, rising consumer demand, and increasing government support. Strategic opportunities include developing innovative, sustainable, and cost-effective systems, expanding into new geographic markets, and forming strategic partnerships with food retailers and technology companies. This market is poised for continued expansion and disruption, promising both significant economic returns and substantial positive impact on global food security and sustainable agriculture.
Hydroponics Industry Segmentation
- 1. Production Analysis
- 2. Consumption Analysis
- 3. Import Market Analysis (Value & Volume)
- 4. Export Market Analysis (Value & Volume)
- 5. Price Trend Analysis
Hydroponics Industry Segmentation By Geography
-
1. North America
- 1.1. United States
- 1.2. Canada
- 1.3. Mexico
-
2. South America
- 2.1. Brazil
- 2.2. Argentina
- 2.3. Rest of South America
-
3. Europe
- 3.1. United Kingdom
- 3.2. Germany
- 3.3. France
- 3.4. Italy
- 3.5. Spain
- 3.6. Russia
- 3.7. Benelux
- 3.8. Nordics
- 3.9. Rest of Europe
-
4. Middle East & Africa
- 4.1. Turkey
- 4.2. Israel
- 4.3. GCC
- 4.4. North Africa
- 4.5. South Africa
- 4.6. Rest of Middle East & Africa
-
5. Asia Pacific
- 5.1. China
- 5.2. India
- 5.3. Japan
- 5.4. South Korea
- 5.5. ASEAN
- 5.6. Oceania
- 5.7. Rest of Asia Pacific
Hydroponics Industry Regional Market Share
Geographic Coverage of Hydroponics Industry
Hydroponics Industry REPORT HIGHLIGHTS
| Aspects | Details |
|---|---|
| Study Period | 2020-2034 |
| Base Year | 2025 |
| Estimated Year | 2026 |
| Forecast Period | 2026-2034 |
| Historical Period | 2020-2025 |
| Growth Rate | CAGR of 7.80% from 2020-2034 |
| Segmentation |
|
Table of Contents
- 1. Introduction
- 1.1. Research Scope
- 1.2. Market Segmentation
- 1.3. Research Objective
- 1.4. Definitions and Assumptions
- 2. Executive Summary
- 2.1. Market Snapshot
- 3. Market Dynamics
- 3.1. Market Drivers
- 3.2. Market Restrains
- 3.3. Market Trends
- 3.4. Market Opportunities
- 4. Market Factor Analysis
- 4.1. Porters Five Forces
- 4.1.1. Bargaining Power of Suppliers
- 4.1.2. Bargaining Power of Buyers
- 4.1.3. Threat of New Entrants
- 4.1.4. Threat of Substitutes
- 4.1.5. Competitive Rivalry
- 4.2. PESTEL analysis
- 4.3. BCG Analysis
- 4.3.1. Stars (High Growth, High Market Share)
- 4.3.2. Cash Cows (Low Growth, High Market Share)
- 4.3.3. Question Mark (High Growth, Low Market Share)
- 4.3.4. Dogs (Low Growth, Low Market Share)
- 4.4. Ansoff Matrix Analysis
- 4.5. Supply Chain Analysis
- 4.6. Regulatory Landscape
- 4.7. Current Market Potential and Opportunity Assessment (TAM–SAM–SOM Framework)
- 4.8. MDP Analyst Note
- 4.1. Porters Five Forces
- 5. Market Analysis, Insights and Forecast 2021-2033
- 5.1. Market Analysis, Insights and Forecast - by Production Analysis
- 5.2. Market Analysis, Insights and Forecast - by Consumption Analysis
- 5.3. Market Analysis, Insights and Forecast - by Import Market Analysis (Value & Volume)
- 5.4. Market Analysis, Insights and Forecast - by Export Market Analysis (Value & Volume)
- 5.5. Market Analysis, Insights and Forecast - by Price Trend Analysis
- 5.6. Market Analysis, Insights and Forecast - by Region
- 5.6.1. North America
- 5.6.2. South America
- 5.6.3. Europe
- 5.6.4. Middle East & Africa
- 5.6.5. Asia Pacific
- 6. Global Hydroponics Industry Analysis, Insights and Forecast, 2021-2033
- 6.1. Market Analysis, Insights and Forecast - by Production Analysis
- 6.2. Market Analysis, Insights and Forecast - by Consumption Analysis
- 6.3. Market Analysis, Insights and Forecast - by Import Market Analysis (Value & Volume)
- 6.4. Market Analysis, Insights and Forecast - by Export Market Analysis (Value & Volume)
- 6.5. Market Analysis, Insights and Forecast - by Price Trend Analysis
- 7. North America Hydroponics Industry Analysis, Insights and Forecast, 2020-2032
- 7.1. Market Analysis, Insights and Forecast - by Production Analysis
- 7.2. Market Analysis, Insights and Forecast - by Consumption Analysis
- 7.3. Market Analysis, Insights and Forecast - by Import Market Analysis (Value & Volume)
- 7.4. Market Analysis, Insights and Forecast - by Export Market Analysis (Value & Volume)
- 7.5. Market Analysis, Insights and Forecast - by Price Trend Analysis
- 8. South America Hydroponics Industry Analysis, Insights and Forecast, 2020-2032
- 8.1. Market Analysis, Insights and Forecast - by Production Analysis
- 8.2. Market Analysis, Insights and Forecast - by Consumption Analysis
- 8.3. Market Analysis, Insights and Forecast - by Import Market Analysis (Value & Volume)
- 8.4. Market Analysis, Insights and Forecast - by Export Market Analysis (Value & Volume)
- 8.5. Market Analysis, Insights and Forecast - by Price Trend Analysis
- 9. Europe Hydroponics Industry Analysis, Insights and Forecast, 2020-2032
- 9.1. Market Analysis, Insights and Forecast - by Production Analysis
- 9.2. Market Analysis, Insights and Forecast - by Consumption Analysis
- 9.3. Market Analysis, Insights and Forecast - by Import Market Analysis (Value & Volume)
- 9.4. Market Analysis, Insights and Forecast - by Export Market Analysis (Value & Volume)
- 9.5. Market Analysis, Insights and Forecast - by Price Trend Analysis
- 10. Middle East & Africa Hydroponics Industry Analysis, Insights and Forecast, 2020-2032
- 10.1. Market Analysis, Insights and Forecast - by Production Analysis
- 10.2. Market Analysis, Insights and Forecast - by Consumption Analysis
- 10.3. Market Analysis, Insights and Forecast - by Import Market Analysis (Value & Volume)
- 10.4. Market Analysis, Insights and Forecast - by Export Market Analysis (Value & Volume)
- 10.5. Market Analysis, Insights and Forecast - by Price Trend Analysis
- 11. Asia Pacific Hydroponics Industry Analysis, Insights and Forecast, 2020-2032
- 11.1. Market Analysis, Insights and Forecast - by Production Analysis
- 11.2. Market Analysis, Insights and Forecast - by Consumption Analysis
- 11.3. Market Analysis, Insights and Forecast - by Import Market Analysis (Value & Volume)
- 11.4. Market Analysis, Insights and Forecast - by Export Market Analysis (Value & Volume)
- 11.5. Market Analysis, Insights and Forecast - by Price Trend Analysis
- 12. Competitive Analysis
- 12.1. Company Profiles
- 12.1.1 4 FreshBox Farms
- 12.1.1.1. Company Overview
- 12.1.1.2. Products
- 12.1.1.3. Company Financials
- 12.1.1.4. SWOT Analysis
- 12.1.2 1 Bright Farms
- 12.1.2.1. Company Overview
- 12.1.2.2. Products
- 12.1.2.3. Company Financials
- 12.1.2.4. SWOT Analysis
- 12.1.3 3 Pegasus Agritech
- 12.1.3.1. Company Overview
- 12.1.3.2. Products
- 12.1.3.3. Company Financials
- 12.1.3.4. SWOT Analysis
- 12.1.4 Hydroponic Crop Producers
- 12.1.4.1. Company Overview
- 12.1.4.2. Products
- 12.1.4.3. Company Financials
- 12.1.4.4. SWOT Analysis
- 12.1.5 5 Thanet Eart
- 12.1.5.1. Company Overview
- 12.1.5.2. Products
- 12.1.5.3. Company Financials
- 12.1.5.4. SWOT Analysis
- 12.1.6 2 Village Farms International Inc
- 12.1.6.1. Company Overview
- 12.1.6.2. Products
- 12.1.6.3. Company Financials
- 12.1.6.4. SWOT Analysis
- 12.1.1 4 FreshBox Farms
- 12.2. Market Entropy
- 12.2.1 Company's Key Areas Served
- 12.2.2 Recent Developments
- 12.3. Company Market Share Analysis 2025
- 12.3.1 Top 5 Companies Market Share Analysis
- 12.3.2 Top 3 Companies Market Share Analysis
- 12.4. List of Potential Customers
- 13. Research Methodology
List of Figures
- Figure 1: Global Hydroponics Industry Revenue Breakdown (Million, %) by Region 2025 & 2033
- Figure 2: North America Hydroponics Industry Revenue (Million), by Production Analysis 2025 & 2033
- Figure 3: North America Hydroponics Industry Revenue Share (%), by Production Analysis 2025 & 2033
- Figure 4: North America Hydroponics Industry Revenue (Million), by Consumption Analysis 2025 & 2033
- Figure 5: North America Hydroponics Industry Revenue Share (%), by Consumption Analysis 2025 & 2033
- Figure 6: North America Hydroponics Industry Revenue (Million), by Import Market Analysis (Value & Volume) 2025 & 2033
- Figure 7: North America Hydroponics Industry Revenue Share (%), by Import Market Analysis (Value & Volume) 2025 & 2033
- Figure 8: North America Hydroponics Industry Revenue (Million), by Export Market Analysis (Value & Volume) 2025 & 2033
- Figure 9: North America Hydroponics Industry Revenue Share (%), by Export Market Analysis (Value & Volume) 2025 & 2033
- Figure 10: North America Hydroponics Industry Revenue (Million), by Price Trend Analysis 2025 & 2033
- Figure 11: North America Hydroponics Industry Revenue Share (%), by Price Trend Analysis 2025 & 2033
- Figure 12: North America Hydroponics Industry Revenue (Million), by Country 2025 & 2033
- Figure 13: North America Hydroponics Industry Revenue Share (%), by Country 2025 & 2033
- Figure 14: South America Hydroponics Industry Revenue (Million), by Production Analysis 2025 & 2033
- Figure 15: South America Hydroponics Industry Revenue Share (%), by Production Analysis 2025 & 2033
- Figure 16: South America Hydroponics Industry Revenue (Million), by Consumption Analysis 2025 & 2033
- Figure 17: South America Hydroponics Industry Revenue Share (%), by Consumption Analysis 2025 & 2033
- Figure 18: South America Hydroponics Industry Revenue (Million), by Import Market Analysis (Value & Volume) 2025 & 2033
- Figure 19: South America Hydroponics Industry Revenue Share (%), by Import Market Analysis (Value & Volume) 2025 & 2033
- Figure 20: South America Hydroponics Industry Revenue (Million), by Export Market Analysis (Value & Volume) 2025 & 2033
- Figure 21: South America Hydroponics Industry Revenue Share (%), by Export Market Analysis (Value & Volume) 2025 & 2033
- Figure 22: South America Hydroponics Industry Revenue (Million), by Price Trend Analysis 2025 & 2033
- Figure 23: South America Hydroponics Industry Revenue Share (%), by Price Trend Analysis 2025 & 2033
- Figure 24: South America Hydroponics Industry Revenue (Million), by Country 2025 & 2033
- Figure 25: South America Hydroponics Industry Revenue Share (%), by Country 2025 & 2033
- Figure 26: Europe Hydroponics Industry Revenue (Million), by Production Analysis 2025 & 2033
- Figure 27: Europe Hydroponics Industry Revenue Share (%), by Production Analysis 2025 & 2033
- Figure 28: Europe Hydroponics Industry Revenue (Million), by Consumption Analysis 2025 & 2033
- Figure 29: Europe Hydroponics Industry Revenue Share (%), by Consumption Analysis 2025 & 2033
- Figure 30: Europe Hydroponics Industry Revenue (Million), by Import Market Analysis (Value & Volume) 2025 & 2033
- Figure 31: Europe Hydroponics Industry Revenue Share (%), by Import Market Analysis (Value & Volume) 2025 & 2033
- Figure 32: Europe Hydroponics Industry Revenue (Million), by Export Market Analysis (Value & Volume) 2025 & 2033
- Figure 33: Europe Hydroponics Industry Revenue Share (%), by Export Market Analysis (Value & Volume) 2025 & 2033
- Figure 34: Europe Hydroponics Industry Revenue (Million), by Price Trend Analysis 2025 & 2033
- Figure 35: Europe Hydroponics Industry Revenue Share (%), by Price Trend Analysis 2025 & 2033
- Figure 36: Europe Hydroponics Industry Revenue (Million), by Country 2025 & 2033
- Figure 37: Europe Hydroponics Industry Revenue Share (%), by Country 2025 & 2033
- Figure 38: Middle East & Africa Hydroponics Industry Revenue (Million), by Production Analysis 2025 & 2033
- Figure 39: Middle East & Africa Hydroponics Industry Revenue Share (%), by Production Analysis 2025 & 2033
- Figure 40: Middle East & Africa Hydroponics Industry Revenue (Million), by Consumption Analysis 2025 & 2033
- Figure 41: Middle East & Africa Hydroponics Industry Revenue Share (%), by Consumption Analysis 2025 & 2033
- Figure 42: Middle East & Africa Hydroponics Industry Revenue (Million), by Import Market Analysis (Value & Volume) 2025 & 2033
- Figure 43: Middle East & Africa Hydroponics Industry Revenue Share (%), by Import Market Analysis (Value & Volume) 2025 & 2033
- Figure 44: Middle East & Africa Hydroponics Industry Revenue (Million), by Export Market Analysis (Value & Volume) 2025 & 2033
- Figure 45: Middle East & Africa Hydroponics Industry Revenue Share (%), by Export Market Analysis (Value & Volume) 2025 & 2033
- Figure 46: Middle East & Africa Hydroponics Industry Revenue (Million), by Price Trend Analysis 2025 & 2033
- Figure 47: Middle East & Africa Hydroponics Industry Revenue Share (%), by Price Trend Analysis 2025 & 2033
- Figure 48: Middle East & Africa Hydroponics Industry Revenue (Million), by Country 2025 & 2033
- Figure 49: Middle East & Africa Hydroponics Industry Revenue Share (%), by Country 2025 & 2033
- Figure 50: Asia Pacific Hydroponics Industry Revenue (Million), by Production Analysis 2025 & 2033
- Figure 51: Asia Pacific Hydroponics Industry Revenue Share (%), by Production Analysis 2025 & 2033
- Figure 52: Asia Pacific Hydroponics Industry Revenue (Million), by Consumption Analysis 2025 & 2033
- Figure 53: Asia Pacific Hydroponics Industry Revenue Share (%), by Consumption Analysis 2025 & 2033
- Figure 54: Asia Pacific Hydroponics Industry Revenue (Million), by Import Market Analysis (Value & Volume) 2025 & 2033
- Figure 55: Asia Pacific Hydroponics Industry Revenue Share (%), by Import Market Analysis (Value & Volume) 2025 & 2033
- Figure 56: Asia Pacific Hydroponics Industry Revenue (Million), by Export Market Analysis (Value & Volume) 2025 & 2033
- Figure 57: Asia Pacific Hydroponics Industry Revenue Share (%), by Export Market Analysis (Value & Volume) 2025 & 2033
- Figure 58: Asia Pacific Hydroponics Industry Revenue (Million), by Price Trend Analysis 2025 & 2033
- Figure 59: Asia Pacific Hydroponics Industry Revenue Share (%), by Price Trend Analysis 2025 & 2033
- Figure 60: Asia Pacific Hydroponics Industry Revenue (Million), by Country 2025 & 2033
- Figure 61: Asia Pacific Hydroponics Industry Revenue Share (%), by Country 2025 & 2033
List of Tables
- Table 1: Global Hydroponics Industry Revenue Million Forecast, by Production Analysis 2020 & 2033
- Table 2: Global Hydroponics Industry Revenue Million Forecast, by Consumption Analysis 2020 & 2033
- Table 3: Global Hydroponics Industry Revenue Million Forecast, by Import Market Analysis (Value & Volume) 2020 & 2033
- Table 4: Global Hydroponics Industry Revenue Million Forecast, by Export Market Analysis (Value & Volume) 2020 & 2033
- Table 5: Global Hydroponics Industry Revenue Million Forecast, by Price Trend Analysis 2020 & 2033
- Table 6: Global Hydroponics Industry Revenue Million Forecast, by Region 2020 & 2033
- Table 7: Global Hydroponics Industry Revenue Million Forecast, by Production Analysis 2020 & 2033
- Table 8: Global Hydroponics Industry Revenue Million Forecast, by Consumption Analysis 2020 & 2033
- Table 9: Global Hydroponics Industry Revenue Million Forecast, by Import Market Analysis (Value & Volume) 2020 & 2033
- Table 10: Global Hydroponics Industry Revenue Million Forecast, by Export Market Analysis (Value & Volume) 2020 & 2033
- Table 11: Global Hydroponics Industry Revenue Million Forecast, by Price Trend Analysis 2020 & 2033
- Table 12: Global Hydroponics Industry Revenue Million Forecast, by Country 2020 & 2033
- Table 13: United States Hydroponics Industry Revenue (Million) Forecast, by Application 2020 & 2033
- Table 14: Canada Hydroponics Industry Revenue (Million) Forecast, by Application 2020 & 2033
- Table 15: Mexico Hydroponics Industry Revenue (Million) Forecast, by Application 2020 & 2033
- Table 16: Global Hydroponics Industry Revenue Million Forecast, by Production Analysis 2020 & 2033
- Table 17: Global Hydroponics Industry Revenue Million Forecast, by Consumption Analysis 2020 & 2033
- Table 18: Global Hydroponics Industry Revenue Million Forecast, by Import Market Analysis (Value & Volume) 2020 & 2033
- Table 19: Global Hydroponics Industry Revenue Million Forecast, by Export Market Analysis (Value & Volume) 2020 & 2033
- Table 20: Global Hydroponics Industry Revenue Million Forecast, by Price Trend Analysis 2020 & 2033
- Table 21: Global Hydroponics Industry Revenue Million Forecast, by Country 2020 & 2033
- Table 22: Brazil Hydroponics Industry Revenue (Million) Forecast, by Application 2020 & 2033
- Table 23: Argentina Hydroponics Industry Revenue (Million) Forecast, by Application 2020 & 2033
- Table 24: Rest of South America Hydroponics Industry Revenue (Million) Forecast, by Application 2020 & 2033
- Table 25: Global Hydroponics Industry Revenue Million Forecast, by Production Analysis 2020 & 2033
- Table 26: Global Hydroponics Industry Revenue Million Forecast, by Consumption Analysis 2020 & 2033
- Table 27: Global Hydroponics Industry Revenue Million Forecast, by Import Market Analysis (Value & Volume) 2020 & 2033
- Table 28: Global Hydroponics Industry Revenue Million Forecast, by Export Market Analysis (Value & Volume) 2020 & 2033
- Table 29: Global Hydroponics Industry Revenue Million Forecast, by Price Trend Analysis 2020 & 2033
- Table 30: Global Hydroponics Industry Revenue Million Forecast, by Country 2020 & 2033
- Table 31: United Kingdom Hydroponics Industry Revenue (Million) Forecast, by Application 2020 & 2033
- Table 32: Germany Hydroponics Industry Revenue (Million) Forecast, by Application 2020 & 2033
- Table 33: France Hydroponics Industry Revenue (Million) Forecast, by Application 2020 & 2033
- Table 34: Italy Hydroponics Industry Revenue (Million) Forecast, by Application 2020 & 2033
- Table 35: Spain Hydroponics Industry Revenue (Million) Forecast, by Application 2020 & 2033
- Table 36: Russia Hydroponics Industry Revenue (Million) Forecast, by Application 2020 & 2033
- Table 37: Benelux Hydroponics Industry Revenue (Million) Forecast, by Application 2020 & 2033
- Table 38: Nordics Hydroponics Industry Revenue (Million) Forecast, by Application 2020 & 2033
- Table 39: Rest of Europe Hydroponics Industry Revenue (Million) Forecast, by Application 2020 & 2033
- Table 40: Global Hydroponics Industry Revenue Million Forecast, by Production Analysis 2020 & 2033
- Table 41: Global Hydroponics Industry Revenue Million Forecast, by Consumption Analysis 2020 & 2033
- Table 42: Global Hydroponics Industry Revenue Million Forecast, by Import Market Analysis (Value & Volume) 2020 & 2033
- Table 43: Global Hydroponics Industry Revenue Million Forecast, by Export Market Analysis (Value & Volume) 2020 & 2033
- Table 44: Global Hydroponics Industry Revenue Million Forecast, by Price Trend Analysis 2020 & 2033
- Table 45: Global Hydroponics Industry Revenue Million Forecast, by Country 2020 & 2033
- Table 46: Turkey Hydroponics Industry Revenue (Million) Forecast, by Application 2020 & 2033
- Table 47: Israel Hydroponics Industry Revenue (Million) Forecast, by Application 2020 & 2033
- Table 48: GCC Hydroponics Industry Revenue (Million) Forecast, by Application 2020 & 2033
- Table 49: North Africa Hydroponics Industry Revenue (Million) Forecast, by Application 2020 & 2033
- Table 50: South Africa Hydroponics Industry Revenue (Million) Forecast, by Application 2020 & 2033
- Table 51: Rest of Middle East & Africa Hydroponics Industry Revenue (Million) Forecast, by Application 2020 & 2033
- Table 52: Global Hydroponics Industry Revenue Million Forecast, by Production Analysis 2020 & 2033
- Table 53: Global Hydroponics Industry Revenue Million Forecast, by Consumption Analysis 2020 & 2033
- Table 54: Global Hydroponics Industry Revenue Million Forecast, by Import Market Analysis (Value & Volume) 2020 & 2033
- Table 55: Global Hydroponics Industry Revenue Million Forecast, by Export Market Analysis (Value & Volume) 2020 & 2033
- Table 56: Global Hydroponics Industry Revenue Million Forecast, by Price Trend Analysis 2020 & 2033
- Table 57: Global Hydroponics Industry Revenue Million Forecast, by Country 2020 & 2033
- Table 58: China Hydroponics Industry Revenue (Million) Forecast, by Application 2020 & 2033
- Table 59: India Hydroponics Industry Revenue (Million) Forecast, by Application 2020 & 2033
- Table 60: Japan Hydroponics Industry Revenue (Million) Forecast, by Application 2020 & 2033
- Table 61: South Korea Hydroponics Industry Revenue (Million) Forecast, by Application 2020 & 2033
- Table 62: ASEAN Hydroponics Industry Revenue (Million) Forecast, by Application 2020 & 2033
- Table 63: Oceania Hydroponics Industry Revenue (Million) Forecast, by Application 2020 & 2033
- Table 64: Rest of Asia Pacific Hydroponics Industry Revenue (Million) Forecast, by Application 2020 & 2033
Frequently Asked Questions
1. What is the projected Compound Annual Growth Rate (CAGR) of the Hydroponics Industry?
The projected CAGR is approximately 7.80%.
2. Which companies are prominent players in the Hydroponics Industry?
Key companies in the market include 4 FreshBox Farms, 1 Bright Farms, 3 Pegasus Agritech, Hydroponic Crop Producers, 5 Thanet Eart, 2 Village Farms International Inc.
3. What are the main segments of the Hydroponics Industry?
The market segments include Production Analysis, Consumption Analysis, Import Market Analysis (Value & Volume), Export Market Analysis (Value & Volume), Price Trend Analysis.
4. Can you provide details about the market size?
The market size is estimated to be USD 5.06 Million as of 2022.
5. What are some drivers contributing to market growth?
Need for Custom Product Development; Use of CROs for Regulatory Services.
6. What are the notable trends driving market growth?
Higher Consumption of Salads and Exotic Vegetables.
7. Are there any restraints impacting market growth?
Data and Cyber Security Concerns; Lack of Experts and Professionals in this Industry.
8. Can you provide examples of recent developments in the market?
March 2024: INSONGREEN announced a significant expansion of its hydroponic and vertical greenhouse production in the Middle East and Africa. This initiative aims to tackle regional water scarcity and food security challenges by utilizing advanced agricultural technologies for sustainable development.
9. What pricing options are available for accessing the report?
Pricing options include single-user, multi-user, and enterprise licenses priced at USD 4750, USD 5250, and USD 8750 respectively.
10. Is the market size provided in terms of value or volume?
The market size is provided in terms of value, measured in Million.
11. Are there any specific market keywords associated with the report?
Yes, the market keyword associated with the report is "Hydroponics Industry," which aids in identifying and referencing the specific market segment covered.
12. How do I determine which pricing option suits my needs best?
The pricing options vary based on user requirements and access needs. Individual users may opt for single-user licenses, while businesses requiring broader access may choose multi-user or enterprise licenses for cost-effective access to the report.
13. Are there any additional resources or data provided in the Hydroponics Industry report?
While the report offers comprehensive insights, it's advisable to review the specific contents or supplementary materials provided to ascertain if additional resources or data are available.
14. How can I stay updated on further developments or reports in the Hydroponics Industry?
To stay informed about further developments, trends, and reports in the Hydroponics Industry, consider subscribing to industry newsletters, following relevant companies and organizations, or regularly checking reputable industry news sources and publications.
Methodology
Step 1 - Identification of Relevant Samples Size from Population Database


Step 2 - Approaches for Defining Global Market Size (Value, Volume* & Price*)

Note*: In applicable scenarios
Step 3 - Data Sources
Primary Research
- Web Analytics
- Survey Reports
- Research Institute
- Latest Research Reports
- Opinion Leaders
Secondary Research
- Annual Reports
- White Paper
- Latest Press Release
- Industry Association
- Paid Database
- Investor Presentations

Step 4 - Data Triangulation
Involves using different sources of information in order to increase the validity of a study
These sources are likely to be stakeholders in a program - participants, other researchers, program staff, other community members, and so on.
Then we put all data in single framework & apply various statistical tools to find out the dynamic on the market.
During the analysis stage, feedback from the stakeholder groups would be compared to determine areas of agreement as well as areas of divergence