

Key Insights
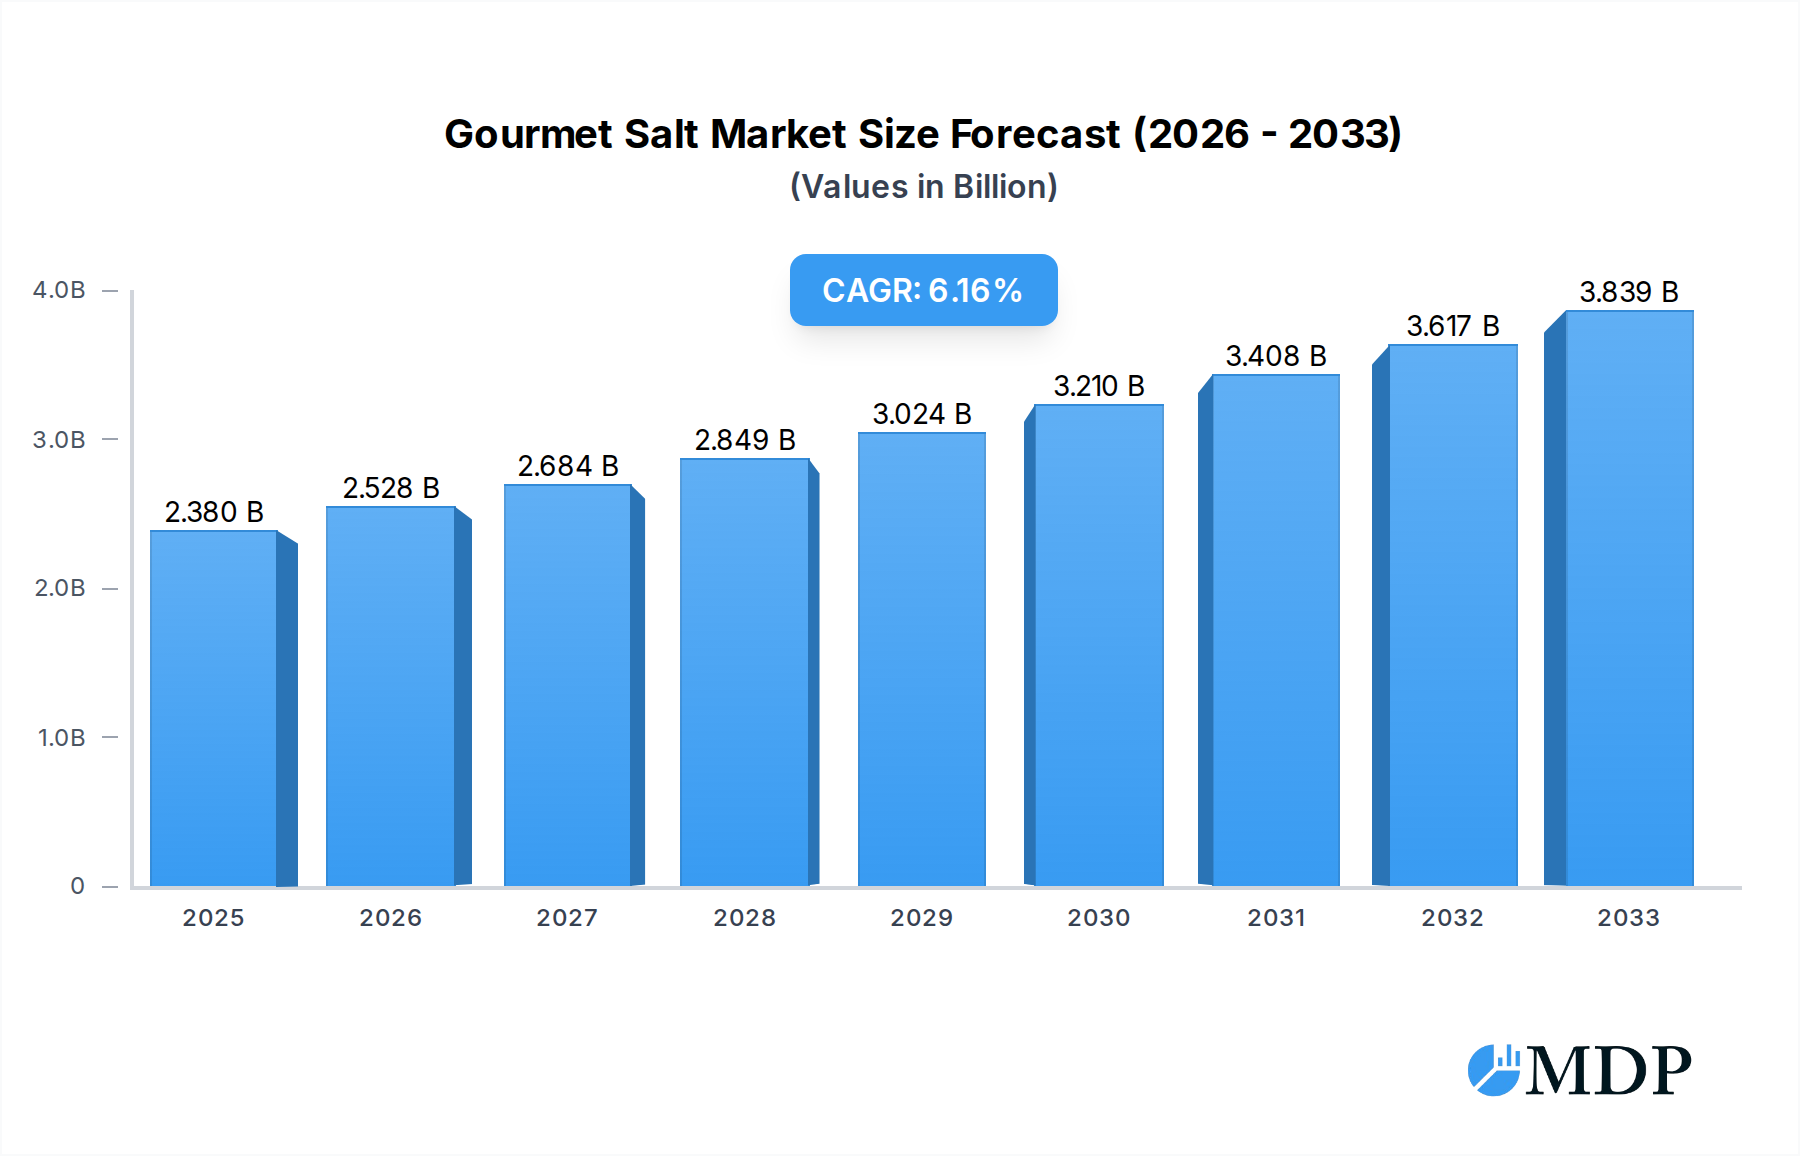
The global Gourmet Salt market is poised for significant expansion, projected to reach an estimated $2.38 billion by 2025. This growth is fueled by a discerning consumer base increasingly prioritizing quality, flavor, and culinary experiences. The market is experiencing a Compound Annual Growth Rate (CAGR) of 6.17%, indicating a robust and sustained upward trajectory. Key drivers for this surge include the rising popularity of artisanal cooking, the demand for unique flavor profiles in food preparation, and the growing awareness of the health benefits associated with mineral-rich salts. As consumers seek to elevate their home cooking and dining out experiences, gourmet salts are becoming indispensable kitchen staples, moving beyond basic seasoning to become integral ingredients that enhance texture and taste. The market's diversity, encompassing applications from delicate bakery and confectionery items to robust meat, poultry, and seafood dishes, further underscores its broad appeal and potential for continued innovation.

Gourmet Salt Market Size (In Billion)
The market's impressive growth is further supported by emerging trends such as the increasing availability of specialty salts like Fleur de Sel, Sel Gris, and Himalayan Salt, each offering distinct culinary characteristics. These premium salts are not only sought after by professional chefs but are also gaining traction among home cooks and food enthusiasts. While the market is characterized by strong demand, certain restraints, such as the higher price point of gourmet salts compared to standard varieties, may pose a challenge to widespread adoption in price-sensitive segments. However, the growing emphasis on provenance, ethical sourcing, and the unique stories behind these salts are helping to justify their premium positioning. The competitive landscape features prominent players like Cargill, SAN FRANSISCO SALT COMPANY, and Saltworks, who are actively innovating and expanding their product portfolios to cater to evolving consumer preferences and capitalize on the market's substantial opportunities.
Gourmet Salt Company Market Share
Gourmet Salt Market: Global Industry Analysis and Forecast 2019-2033
This comprehensive report offers an in-depth analysis of the global gourmet salt market, exploring its dynamics, trends, and future outlook from 2019 to 2033. With a base year of 2025 and a forecast period extending to 2033, this report provides invaluable insights for industry stakeholders seeking to navigate this evolving sector. We delve into market concentration, key growth drivers, leading segments, product innovations, and strategic opportunities, supported by robust data and actionable intelligence. The global gourmet salt market is projected to reach USD 90 billion by 2025, with a Compound Annual Growth Rate (CAGR) of XX% during the forecast period.
Gourmet Salt Market Dynamics & Concentration
The global gourmet salt market exhibits moderate concentration, with key players like Cargill, SAN FRANSISCO SALT COMPANY, Saltworks, and Morton Salt holding significant market share, estimated at over 70%. Innovation is primarily driven by product diversification, with companies increasingly focusing on unique mineral compositions, flavor profiles, and artisanal production methods. Regulatory frameworks, while generally stable, require adherence to food safety standards and accurate labeling, impacting product development and market entry. Product substitutes, such as other high-end seasonings and flavor enhancers, pose a moderate threat, though the unique culinary properties of gourmet salts maintain their distinct appeal. End-user trends lean towards health-conscious consumers seeking natural, unprocessed ingredients and unique culinary experiences, driving demand for specialty salts. Mergers and acquisitions (M&A) activity has been moderate, with approximately XX significant deals recorded in the historical period (2019-2024), primarily aimed at expanding product portfolios and market reach.
Gourmet Salt Industry Trends & Analysis
The gourmet salt industry is witnessing robust growth, fueled by an increasing consumer appreciation for culinary artistry and the health benefits associated with mineral-rich salts. Market growth drivers include the rising popularity of home cooking, the influence of celebrity chefs and food bloggers, and the expanding foodservice sector's demand for premium ingredients. Technological disruptions are less pronounced in traditional salt harvesting but are emerging in processing and packaging, ensuring product integrity and extended shelf life. Consumer preferences are shifting towards organic, ethically sourced, and trace mineral-rich salts, with Himalayan Pink Salt and Fleur de Sel experiencing substantial market penetration. Competitive dynamics are characterized by a mix of established multinational corporations and niche artisanal producers, each vying for market share through product quality, branding, and distribution strategies. The market penetration of gourmet salts is estimated to be around XX% of the total salt market. The CAGR for the gourmet salt market is projected at XX% for the forecast period.
Leading Markets & Segments in Gourmet Salt
The Bakery & Confectionery segment is a dominant force in the gourmet salt market, driven by the rising demand for specialty baked goods and confectionery items that leverage salt to enhance sweetness and create unique flavor profiles. Within this segment, Himalayan Salt and Flake Salt are particularly popular for their aesthetic appeal and mild flavor, contributing to an estimated XX billion market value.
Key drivers for the dominance of this segment include:
- Consumer demand for premium baked goods: An increasing global appetite for artisanal breads, pastries, and desserts.
- Influence of baking trends: The popularity of home baking and the use of gourmet ingredients in recipes shared online.
- Versatility in sweet and savory applications: Gourmet salts can balance sweetness in desserts and add depth to savory notes in baked goods.
In terms of product types, Himalayan Salt continues to lead, holding an estimated XX% market share due to its perceived health benefits and distinctive pink hue. Fleur de Sel and Sel Gris also command significant market presence, particularly in high-end culinary applications, driven by their unique textures and subtle flavor profiles.
Dominance analysis reveals that North America, particularly the United States, and Europe are the leading geographical markets, accounting for over 60% of the global gourmet salt market. This dominance is attributed to higher disposable incomes, a well-developed foodservice industry, and a sophisticated consumer base that actively seeks out premium food products. Economic policies that support food import and export, coupled with robust distribution infrastructure, further facilitate market penetration.
Gourmet Salt Product Developments
Product innovation in the gourmet salt market centers on enhancing flavor profiles and creating unique textural experiences. Companies are actively developing specialty blends infused with herbs, spices, and natural flavorings, catering to evolving consumer palates. Applications are expanding beyond traditional culinary uses to include artisanal food production and premium food pairings. Competitive advantages are being built through sustainable sourcing, unique harvesting techniques, and sophisticated branding that highlights the origin and artisanal nature of the salt. Technological advancements in refining and packaging are ensuring superior product quality and extended shelf life, further solidifying market position.
Key Drivers of Gourmet Salt Growth
The gourmet salt market is propelled by several key growth drivers. Consumer demand for natural, unprocessed, and mineral-rich foods is a primary catalyst. The increasing global interest in culinary exploration and home cooking, amplified by social media trends, encourages the use of premium ingredients like gourmet salts to elevate dishes. Furthermore, the expanding premium food sector, including artisanal food manufacturers and high-end restaurants, consistently seeks out high-quality salts to enhance their product offerings. Regulatory support for clean label products and the growing awareness of the potential health benefits associated with trace minerals also contribute to market expansion.
Challenges in the Gourmet Salt Market
Despite its growth, the gourmet salt market faces several challenges. Regulatory hurdles related to food safety, labeling accuracy, and import/export regulations can impact market access and add to operational costs. Supply chain complexities, particularly for artisanal and rare salts, can lead to price volatility and potential shortages, affecting consistent availability. Intense competition from both established brands and emerging niche players necessitates continuous innovation and marketing efforts, potentially impacting profit margins. Additionally, the relatively higher price point of gourmet salts compared to table salt can be a barrier for a significant segment of price-sensitive consumers.
Emerging Opportunities in Gourmet Salt
Emerging opportunities in the gourmet salt market lie in tapping into the growing demand for functional foods and personalized nutrition. Innovations in salt production that enhance specific mineral content or introduce beneficial compounds can create niche markets. Strategic partnerships with health and wellness influencers, as well as subscription box services, can broaden consumer reach and create recurring revenue streams. Market expansion into developing economies, where a rising middle class is increasingly adopting premium food trends, presents a significant long-term growth avenue. Furthermore, the development of innovative packaging solutions that highlight product origin and promote sustainability can further enhance brand appeal and capture consumer interest.
Leading Players in the Gourmet Salt Sector
- Cargill
- SAN FRANSISCO SALT COMPANY
- Saltworks
- Morton Salt
- Devonshire Gourmet salts
Key Milestones in Gourmet Salt Industry
- 2019: Increased consumer focus on artisanal and origin-specific salts, driving premiumization.
- 2020: Rise of home cooking and online food content boosted demand for specialty ingredients.
- 2021: Introduction of flavored and infused gourmet salts gained traction in the market.
- 2022: Emphasis on sustainable sourcing and ethical production practices became a key consumer concern.
- 2023: Growth in the vegan and plant-based food sectors created new applications for gourmet salts.
- 2024: Expansion of direct-to-consumer (DTC) sales channels by gourmet salt producers.
Strategic Outlook for Gourmet Salt Market
The strategic outlook for the gourmet salt market remains highly positive, driven by sustained consumer interest in culinary exploration and premium food experiences. Key growth accelerators include continued product innovation, with a focus on unique flavor profiles, functional benefits, and artisanal origins. Expanding distribution networks into untapped geographical markets and forging strategic alliances with complementary industries, such as beverage and cookware manufacturers, will be crucial. Leveraging digital marketing and e-commerce platforms to enhance consumer engagement and accessibility will further propel market growth. The emphasis on sustainability and traceability will also be a critical factor in capturing market share and building brand loyalty in the long term.
Gourmet Salt Segmentation
-
1. Application
- 1.1. Bakery & Confectionery
- 1.2. Meat & Poultry Products
- 1.3. Seafood Products
- 1.4. Sauces & Savory
-
2. Types
- 2.1. Fleur De Sel
- 2.2. Sel Gris
- 2.3. Himalayan Salt
- 2.4. Flake Salt
- 2.5. Specialty Salt
Gourmet Salt Segmentation By Geography
-
1. North America
- 1.1. United States
- 1.2. Canada
- 1.3. Mexico
-
2. South America
- 2.1. Brazil
- 2.2. Argentina
- 2.3. Rest of South America
-
3. Europe
- 3.1. United Kingdom
- 3.2. Germany
- 3.3. France
- 3.4. Italy
- 3.5. Spain
- 3.6. Russia
- 3.7. Benelux
- 3.8. Nordics
- 3.9. Rest of Europe
-
4. Middle East & Africa
- 4.1. Turkey
- 4.2. Israel
- 4.3. GCC
- 4.4. North Africa
- 4.5. South Africa
- 4.6. Rest of Middle East & Africa
-
5. Asia Pacific
- 5.1. China
- 5.2. India
- 5.3. Japan
- 5.4. South Korea
- 5.5. ASEAN
- 5.6. Oceania
- 5.7. Rest of Asia Pacific
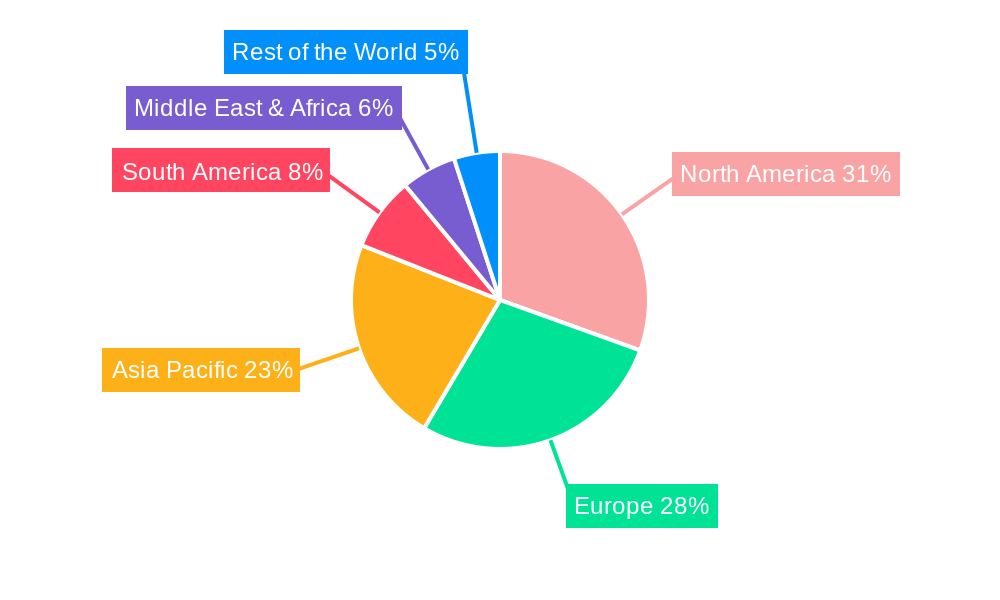
Gourmet Salt Regional Market Share
Geographic Coverage of Gourmet Salt
Gourmet Salt REPORT HIGHLIGHTS
| Aspects | Details |
|---|---|
| Study Period | 2020-2034 |
| Base Year | 2025 |
| Estimated Year | 2026 |
| Forecast Period | 2026-2034 |
| Historical Period | 2020-2025 |
| Growth Rate | CAGR of 6.17% from 2020-2034 |
| Segmentation |
|
Table of Contents
- 1. Introduction
- 1.1. Research Scope
- 1.2. Market Segmentation
- 1.3. Research Methodology
- 1.4. Definitions and Assumptions
- 2. Executive Summary
- 2.1. Introduction
- 3. Market Dynamics
- 3.1. Introduction
- 3.2. Market Drivers
- 3.3. Market Restrains
- 3.4. Market Trends
- 4. Market Factor Analysis
- 4.1. Porters Five Forces
- 4.2. Supply/Value Chain
- 4.3. PESTEL analysis
- 4.4. Market Entropy
- 4.5. Patent/Trademark Analysis
- 5. Global Gourmet Salt Analysis, Insights and Forecast, 2020-2032
- 5.1. Market Analysis, Insights and Forecast - by Application
- 5.1.1. Bakery & Confectionery
- 5.1.2. Meat & Poultry Products
- 5.1.3. Seafood Products
- 5.1.4. Sauces & Savory
- 5.2. Market Analysis, Insights and Forecast - by Types
- 5.2.1. Fleur De Sel
- 5.2.2. Sel Gris
- 5.2.3. Himalayan Salt
- 5.2.4. Flake Salt
- 5.2.5. Specialty Salt
- 5.3. Market Analysis, Insights and Forecast - by Region
- 5.3.1. North America
- 5.3.2. South America
- 5.3.3. Europe
- 5.3.4. Middle East & Africa
- 5.3.5. Asia Pacific
- 5.1. Market Analysis, Insights and Forecast - by Application
- 6. North America Gourmet Salt Analysis, Insights and Forecast, 2020-2032
- 6.1. Market Analysis, Insights and Forecast - by Application
- 6.1.1. Bakery & Confectionery
- 6.1.2. Meat & Poultry Products
- 6.1.3. Seafood Products
- 6.1.4. Sauces & Savory
- 6.2. Market Analysis, Insights and Forecast - by Types
- 6.2.1. Fleur De Sel
- 6.2.2. Sel Gris
- 6.2.3. Himalayan Salt
- 6.2.4. Flake Salt
- 6.2.5. Specialty Salt
- 6.1. Market Analysis, Insights and Forecast - by Application
- 7. South America Gourmet Salt Analysis, Insights and Forecast, 2020-2032
- 7.1. Market Analysis, Insights and Forecast - by Application
- 7.1.1. Bakery & Confectionery
- 7.1.2. Meat & Poultry Products
- 7.1.3. Seafood Products
- 7.1.4. Sauces & Savory
- 7.2. Market Analysis, Insights and Forecast - by Types
- 7.2.1. Fleur De Sel
- 7.2.2. Sel Gris
- 7.2.3. Himalayan Salt
- 7.2.4. Flake Salt
- 7.2.5. Specialty Salt
- 7.1. Market Analysis, Insights and Forecast - by Application
- 8. Europe Gourmet Salt Analysis, Insights and Forecast, 2020-2032
- 8.1. Market Analysis, Insights and Forecast - by Application
- 8.1.1. Bakery & Confectionery
- 8.1.2. Meat & Poultry Products
- 8.1.3. Seafood Products
- 8.1.4. Sauces & Savory
- 8.2. Market Analysis, Insights and Forecast - by Types
- 8.2.1. Fleur De Sel
- 8.2.2. Sel Gris
- 8.2.3. Himalayan Salt
- 8.2.4. Flake Salt
- 8.2.5. Specialty Salt
- 8.1. Market Analysis, Insights and Forecast - by Application
- 9. Middle East & Africa Gourmet Salt Analysis, Insights and Forecast, 2020-2032
- 9.1. Market Analysis, Insights and Forecast - by Application
- 9.1.1. Bakery & Confectionery
- 9.1.2. Meat & Poultry Products
- 9.1.3. Seafood Products
- 9.1.4. Sauces & Savory
- 9.2. Market Analysis, Insights and Forecast - by Types
- 9.2.1. Fleur De Sel
- 9.2.2. Sel Gris
- 9.2.3. Himalayan Salt
- 9.2.4. Flake Salt
- 9.2.5. Specialty Salt
- 9.1. Market Analysis, Insights and Forecast - by Application
- 10. Asia Pacific Gourmet Salt Analysis, Insights and Forecast, 2020-2032
- 10.1. Market Analysis, Insights and Forecast - by Application
- 10.1.1. Bakery & Confectionery
- 10.1.2. Meat & Poultry Products
- 10.1.3. Seafood Products
- 10.1.4. Sauces & Savory
- 10.2. Market Analysis, Insights and Forecast - by Types
- 10.2.1. Fleur De Sel
- 10.2.2. Sel Gris
- 10.2.3. Himalayan Salt
- 10.2.4. Flake Salt
- 10.2.5. Specialty Salt
- 10.1. Market Analysis, Insights and Forecast - by Application
- 11. Competitive Analysis
- 11.1. Global Market Share Analysis 2025
- 11.2. Company Profiles
- 11.2.1 Cargill
- 11.2.1.1. Overview
- 11.2.1.2. Products
- 11.2.1.3. SWOT Analysis
- 11.2.1.4. Recent Developments
- 11.2.1.5. Financials (Based on Availability)
- 11.2.2 SAN FRANSISCO SALT COMPANY
- 11.2.2.1. Overview
- 11.2.2.2. Products
- 11.2.2.3. SWOT Analysis
- 11.2.2.4. Recent Developments
- 11.2.2.5. Financials (Based on Availability)
- 11.2.3 Saltworks
- 11.2.3.1. Overview
- 11.2.3.2. Products
- 11.2.3.3. SWOT Analysis
- 11.2.3.4. Recent Developments
- 11.2.3.5. Financials (Based on Availability)
- 11.2.4 Morton Salt
- 11.2.4.1. Overview
- 11.2.4.2. Products
- 11.2.4.3. SWOT Analysis
- 11.2.4.4. Recent Developments
- 11.2.4.5. Financials (Based on Availability)
- 11.2.5 Devonshire Gourmet salts
- 11.2.5.1. Overview
- 11.2.5.2. Products
- 11.2.5.3. SWOT Analysis
- 11.2.5.4. Recent Developments
- 11.2.5.5. Financials (Based on Availability)
- 11.2.1 Cargill
List of Figures
- Figure 1: Global Gourmet Salt Revenue Breakdown (undefined, %) by Region 2025 & 2033
- Figure 2: Global Gourmet Salt Volume Breakdown (K, %) by Region 2025 & 2033
- Figure 3: North America Gourmet Salt Revenue (undefined), by Application 2025 & 2033
- Figure 4: North America Gourmet Salt Volume (K), by Application 2025 & 2033
- Figure 5: North America Gourmet Salt Revenue Share (%), by Application 2025 & 2033
- Figure 6: North America Gourmet Salt Volume Share (%), by Application 2025 & 2033
- Figure 7: North America Gourmet Salt Revenue (undefined), by Types 2025 & 2033
- Figure 8: North America Gourmet Salt Volume (K), by Types 2025 & 2033
- Figure 9: North America Gourmet Salt Revenue Share (%), by Types 2025 & 2033
- Figure 10: North America Gourmet Salt Volume Share (%), by Types 2025 & 2033
- Figure 11: North America Gourmet Salt Revenue (undefined), by Country 2025 & 2033
- Figure 12: North America Gourmet Salt Volume (K), by Country 2025 & 2033
- Figure 13: North America Gourmet Salt Revenue Share (%), by Country 2025 & 2033
- Figure 14: North America Gourmet Salt Volume Share (%), by Country 2025 & 2033
- Figure 15: South America Gourmet Salt Revenue (undefined), by Application 2025 & 2033
- Figure 16: South America Gourmet Salt Volume (K), by Application 2025 & 2033
- Figure 17: South America Gourmet Salt Revenue Share (%), by Application 2025 & 2033
- Figure 18: South America Gourmet Salt Volume Share (%), by Application 2025 & 2033
- Figure 19: South America Gourmet Salt Revenue (undefined), by Types 2025 & 2033
- Figure 20: South America Gourmet Salt Volume (K), by Types 2025 & 2033
- Figure 21: South America Gourmet Salt Revenue Share (%), by Types 2025 & 2033
- Figure 22: South America Gourmet Salt Volume Share (%), by Types 2025 & 2033
- Figure 23: South America Gourmet Salt Revenue (undefined), by Country 2025 & 2033
- Figure 24: South America Gourmet Salt Volume (K), by Country 2025 & 2033
- Figure 25: South America Gourmet Salt Revenue Share (%), by Country 2025 & 2033
- Figure 26: South America Gourmet Salt Volume Share (%), by Country 2025 & 2033
- Figure 27: Europe Gourmet Salt Revenue (undefined), by Application 2025 & 2033
- Figure 28: Europe Gourmet Salt Volume (K), by Application 2025 & 2033
- Figure 29: Europe Gourmet Salt Revenue Share (%), by Application 2025 & 2033
- Figure 30: Europe Gourmet Salt Volume Share (%), by Application 2025 & 2033
- Figure 31: Europe Gourmet Salt Revenue (undefined), by Types 2025 & 2033
- Figure 32: Europe Gourmet Salt Volume (K), by Types 2025 & 2033
- Figure 33: Europe Gourmet Salt Revenue Share (%), by Types 2025 & 2033
- Figure 34: Europe Gourmet Salt Volume Share (%), by Types 2025 & 2033
- Figure 35: Europe Gourmet Salt Revenue (undefined), by Country 2025 & 2033
- Figure 36: Europe Gourmet Salt Volume (K), by Country 2025 & 2033
- Figure 37: Europe Gourmet Salt Revenue Share (%), by Country 2025 & 2033
- Figure 38: Europe Gourmet Salt Volume Share (%), by Country 2025 & 2033
- Figure 39: Middle East & Africa Gourmet Salt Revenue (undefined), by Application 2025 & 2033
- Figure 40: Middle East & Africa Gourmet Salt Volume (K), by Application 2025 & 2033
- Figure 41: Middle East & Africa Gourmet Salt Revenue Share (%), by Application 2025 & 2033
- Figure 42: Middle East & Africa Gourmet Salt Volume Share (%), by Application 2025 & 2033
- Figure 43: Middle East & Africa Gourmet Salt Revenue (undefined), by Types 2025 & 2033
- Figure 44: Middle East & Africa Gourmet Salt Volume (K), by Types 2025 & 2033
- Figure 45: Middle East & Africa Gourmet Salt Revenue Share (%), by Types 2025 & 2033
- Figure 46: Middle East & Africa Gourmet Salt Volume Share (%), by Types 2025 & 2033
- Figure 47: Middle East & Africa Gourmet Salt Revenue (undefined), by Country 2025 & 2033
- Figure 48: Middle East & Africa Gourmet Salt Volume (K), by Country 2025 & 2033
- Figure 49: Middle East & Africa Gourmet Salt Revenue Share (%), by Country 2025 & 2033
- Figure 50: Middle East & Africa Gourmet Salt Volume Share (%), by Country 2025 & 2033
- Figure 51: Asia Pacific Gourmet Salt Revenue (undefined), by Application 2025 & 2033
- Figure 52: Asia Pacific Gourmet Salt Volume (K), by Application 2025 & 2033
- Figure 53: Asia Pacific Gourmet Salt Revenue Share (%), by Application 2025 & 2033
- Figure 54: Asia Pacific Gourmet Salt Volume Share (%), by Application 2025 & 2033
- Figure 55: Asia Pacific Gourmet Salt Revenue (undefined), by Types 2025 & 2033
- Figure 56: Asia Pacific Gourmet Salt Volume (K), by Types 2025 & 2033
- Figure 57: Asia Pacific Gourmet Salt Revenue Share (%), by Types 2025 & 2033
- Figure 58: Asia Pacific Gourmet Salt Volume Share (%), by Types 2025 & 2033
- Figure 59: Asia Pacific Gourmet Salt Revenue (undefined), by Country 2025 & 2033
- Figure 60: Asia Pacific Gourmet Salt Volume (K), by Country 2025 & 2033
- Figure 61: Asia Pacific Gourmet Salt Revenue Share (%), by Country 2025 & 2033
- Figure 62: Asia Pacific Gourmet Salt Volume Share (%), by Country 2025 & 2033
List of Tables
- Table 1: Global Gourmet Salt Revenue undefined Forecast, by Application 2020 & 2033
- Table 2: Global Gourmet Salt Volume K Forecast, by Application 2020 & 2033
- Table 3: Global Gourmet Salt Revenue undefined Forecast, by Types 2020 & 2033
- Table 4: Global Gourmet Salt Volume K Forecast, by Types 2020 & 2033
- Table 5: Global Gourmet Salt Revenue undefined Forecast, by Region 2020 & 2033
- Table 6: Global Gourmet Salt Volume K Forecast, by Region 2020 & 2033
- Table 7: Global Gourmet Salt Revenue undefined Forecast, by Application 2020 & 2033
- Table 8: Global Gourmet Salt Volume K Forecast, by Application 2020 & 2033
- Table 9: Global Gourmet Salt Revenue undefined Forecast, by Types 2020 & 2033
- Table 10: Global Gourmet Salt Volume K Forecast, by Types 2020 & 2033
- Table 11: Global Gourmet Salt Revenue undefined Forecast, by Country 2020 & 2033
- Table 12: Global Gourmet Salt Volume K Forecast, by Country 2020 & 2033
- Table 13: United States Gourmet Salt Revenue (undefined) Forecast, by Application 2020 & 2033
- Table 14: United States Gourmet Salt Volume (K) Forecast, by Application 2020 & 2033
- Table 15: Canada Gourmet Salt Revenue (undefined) Forecast, by Application 2020 & 2033
- Table 16: Canada Gourmet Salt Volume (K) Forecast, by Application 2020 & 2033
- Table 17: Mexico Gourmet Salt Revenue (undefined) Forecast, by Application 2020 & 2033
- Table 18: Mexico Gourmet Salt Volume (K) Forecast, by Application 2020 & 2033
- Table 19: Global Gourmet Salt Revenue undefined Forecast, by Application 2020 & 2033
- Table 20: Global Gourmet Salt Volume K Forecast, by Application 2020 & 2033
- Table 21: Global Gourmet Salt Revenue undefined Forecast, by Types 2020 & 2033
- Table 22: Global Gourmet Salt Volume K Forecast, by Types 2020 & 2033
- Table 23: Global Gourmet Salt Revenue undefined Forecast, by Country 2020 & 2033
- Table 24: Global Gourmet Salt Volume K Forecast, by Country 2020 & 2033
- Table 25: Brazil Gourmet Salt Revenue (undefined) Forecast, by Application 2020 & 2033
- Table 26: Brazil Gourmet Salt Volume (K) Forecast, by Application 2020 & 2033
- Table 27: Argentina Gourmet Salt Revenue (undefined) Forecast, by Application 2020 & 2033
- Table 28: Argentina Gourmet Salt Volume (K) Forecast, by Application 2020 & 2033
- Table 29: Rest of South America Gourmet Salt Revenue (undefined) Forecast, by Application 2020 & 2033
- Table 30: Rest of South America Gourmet Salt Volume (K) Forecast, by Application 2020 & 2033
- Table 31: Global Gourmet Salt Revenue undefined Forecast, by Application 2020 & 2033
- Table 32: Global Gourmet Salt Volume K Forecast, by Application 2020 & 2033
- Table 33: Global Gourmet Salt Revenue undefined Forecast, by Types 2020 & 2033
- Table 34: Global Gourmet Salt Volume K Forecast, by Types 2020 & 2033
- Table 35: Global Gourmet Salt Revenue undefined Forecast, by Country 2020 & 2033
- Table 36: Global Gourmet Salt Volume K Forecast, by Country 2020 & 2033
- Table 37: United Kingdom Gourmet Salt Revenue (undefined) Forecast, by Application 2020 & 2033
- Table 38: United Kingdom Gourmet Salt Volume (K) Forecast, by Application 2020 & 2033
- Table 39: Germany Gourmet Salt Revenue (undefined) Forecast, by Application 2020 & 2033
- Table 40: Germany Gourmet Salt Volume (K) Forecast, by Application 2020 & 2033
- Table 41: France Gourmet Salt Revenue (undefined) Forecast, by Application 2020 & 2033
- Table 42: France Gourmet Salt Volume (K) Forecast, by Application 2020 & 2033
- Table 43: Italy Gourmet Salt Revenue (undefined) Forecast, by Application 2020 & 2033
- Table 44: Italy Gourmet Salt Volume (K) Forecast, by Application 2020 & 2033
- Table 45: Spain Gourmet Salt Revenue (undefined) Forecast, by Application 2020 & 2033
- Table 46: Spain Gourmet Salt Volume (K) Forecast, by Application 2020 & 2033
- Table 47: Russia Gourmet Salt Revenue (undefined) Forecast, by Application 2020 & 2033
- Table 48: Russia Gourmet Salt Volume (K) Forecast, by Application 2020 & 2033
- Table 49: Benelux Gourmet Salt Revenue (undefined) Forecast, by Application 2020 & 2033
- Table 50: Benelux Gourmet Salt Volume (K) Forecast, by Application 2020 & 2033
- Table 51: Nordics Gourmet Salt Revenue (undefined) Forecast, by Application 2020 & 2033
- Table 52: Nordics Gourmet Salt Volume (K) Forecast, by Application 2020 & 2033
- Table 53: Rest of Europe Gourmet Salt Revenue (undefined) Forecast, by Application 2020 & 2033
- Table 54: Rest of Europe Gourmet Salt Volume (K) Forecast, by Application 2020 & 2033
- Table 55: Global Gourmet Salt Revenue undefined Forecast, by Application 2020 & 2033
- Table 56: Global Gourmet Salt Volume K Forecast, by Application 2020 & 2033
- Table 57: Global Gourmet Salt Revenue undefined Forecast, by Types 2020 & 2033
- Table 58: Global Gourmet Salt Volume K Forecast, by Types 2020 & 2033
- Table 59: Global Gourmet Salt Revenue undefined Forecast, by Country 2020 & 2033
- Table 60: Global Gourmet Salt Volume K Forecast, by Country 2020 & 2033
- Table 61: Turkey Gourmet Salt Revenue (undefined) Forecast, by Application 2020 & 2033
- Table 62: Turkey Gourmet Salt Volume (K) Forecast, by Application 2020 & 2033
- Table 63: Israel Gourmet Salt Revenue (undefined) Forecast, by Application 2020 & 2033
- Table 64: Israel Gourmet Salt Volume (K) Forecast, by Application 2020 & 2033
- Table 65: GCC Gourmet Salt Revenue (undefined) Forecast, by Application 2020 & 2033
- Table 66: GCC Gourmet Salt Volume (K) Forecast, by Application 2020 & 2033
- Table 67: North Africa Gourmet Salt Revenue (undefined) Forecast, by Application 2020 & 2033
- Table 68: North Africa Gourmet Salt Volume (K) Forecast, by Application 2020 & 2033
- Table 69: South Africa Gourmet Salt Revenue (undefined) Forecast, by Application 2020 & 2033
- Table 70: South Africa Gourmet Salt Volume (K) Forecast, by Application 2020 & 2033
- Table 71: Rest of Middle East & Africa Gourmet Salt Revenue (undefined) Forecast, by Application 2020 & 2033
- Table 72: Rest of Middle East & Africa Gourmet Salt Volume (K) Forecast, by Application 2020 & 2033
- Table 73: Global Gourmet Salt Revenue undefined Forecast, by Application 2020 & 2033
- Table 74: Global Gourmet Salt Volume K Forecast, by Application 2020 & 2033
- Table 75: Global Gourmet Salt Revenue undefined Forecast, by Types 2020 & 2033
- Table 76: Global Gourmet Salt Volume K Forecast, by Types 2020 & 2033
- Table 77: Global Gourmet Salt Revenue undefined Forecast, by Country 2020 & 2033
- Table 78: Global Gourmet Salt Volume K Forecast, by Country 2020 & 2033
- Table 79: China Gourmet Salt Revenue (undefined) Forecast, by Application 2020 & 2033
- Table 80: China Gourmet Salt Volume (K) Forecast, by Application 2020 & 2033
- Table 81: India Gourmet Salt Revenue (undefined) Forecast, by Application 2020 & 2033
- Table 82: India Gourmet Salt Volume (K) Forecast, by Application 2020 & 2033
- Table 83: Japan Gourmet Salt Revenue (undefined) Forecast, by Application 2020 & 2033
- Table 84: Japan Gourmet Salt Volume (K) Forecast, by Application 2020 & 2033
- Table 85: South Korea Gourmet Salt Revenue (undefined) Forecast, by Application 2020 & 2033
- Table 86: South Korea Gourmet Salt Volume (K) Forecast, by Application 2020 & 2033
- Table 87: ASEAN Gourmet Salt Revenue (undefined) Forecast, by Application 2020 & 2033
- Table 88: ASEAN Gourmet Salt Volume (K) Forecast, by Application 2020 & 2033
- Table 89: Oceania Gourmet Salt Revenue (undefined) Forecast, by Application 2020 & 2033
- Table 90: Oceania Gourmet Salt Volume (K) Forecast, by Application 2020 & 2033
- Table 91: Rest of Asia Pacific Gourmet Salt Revenue (undefined) Forecast, by Application 2020 & 2033
- Table 92: Rest of Asia Pacific Gourmet Salt Volume (K) Forecast, by Application 2020 & 2033
Frequently Asked Questions
1. What is the projected Compound Annual Growth Rate (CAGR) of the Gourmet Salt?
The projected CAGR is approximately 6.17%.
2. Which companies are prominent players in the Gourmet Salt?
Key companies in the market include Cargill, SAN FRANSISCO SALT COMPANY, Saltworks, Morton Salt, Devonshire Gourmet salts.
3. What are the main segments of the Gourmet Salt?
The market segments include Application, Types.
4. Can you provide details about the market size?
The market size is estimated to be USD XXX N/A as of 2022.
5. What are some drivers contributing to market growth?
N/A
6. What are the notable trends driving market growth?
N/A
7. Are there any restraints impacting market growth?
N/A
8. Can you provide examples of recent developments in the market?
N/A
9. What pricing options are available for accessing the report?
Pricing options include single-user, multi-user, and enterprise licenses priced at USD 3350.00, USD 5025.00, and USD 6700.00 respectively.
10. Is the market size provided in terms of value or volume?
The market size is provided in terms of value, measured in N/A and volume, measured in K.
11. Are there any specific market keywords associated with the report?
Yes, the market keyword associated with the report is "Gourmet Salt," which aids in identifying and referencing the specific market segment covered.
12. How do I determine which pricing option suits my needs best?
The pricing options vary based on user requirements and access needs. Individual users may opt for single-user licenses, while businesses requiring broader access may choose multi-user or enterprise licenses for cost-effective access to the report.
13. Are there any additional resources or data provided in the Gourmet Salt report?
While the report offers comprehensive insights, it's advisable to review the specific contents or supplementary materials provided to ascertain if additional resources or data are available.
14. How can I stay updated on further developments or reports in the Gourmet Salt?
To stay informed about further developments, trends, and reports in the Gourmet Salt, consider subscribing to industry newsletters, following relevant companies and organizations, or regularly checking reputable industry news sources and publications.
Methodology
Step 1 - Identification of Relevant Samples Size from Population Database


Step 2 - Approaches for Defining Global Market Size (Value, Volume* & Price*)

Note*: In applicable scenarios
Step 3 - Data Sources
Primary Research
- Web Analytics
- Survey Reports
- Research Institute
- Latest Research Reports
- Opinion Leaders
Secondary Research
- Annual Reports
- White Paper
- Latest Press Release
- Industry Association
- Paid Database
- Investor Presentations

Step 4 - Data Triangulation
Involves using different sources of information in order to increase the validity of a study
These sources are likely to be stakeholders in a program - participants, other researchers, program staff, other community members, and so on.
Then we put all data in single framework & apply various statistical tools to find out the dynamic on the market.
During the analysis stage, feedback from the stakeholder groups would be compared to determine areas of agreement as well as areas of divergence