

Key Insights
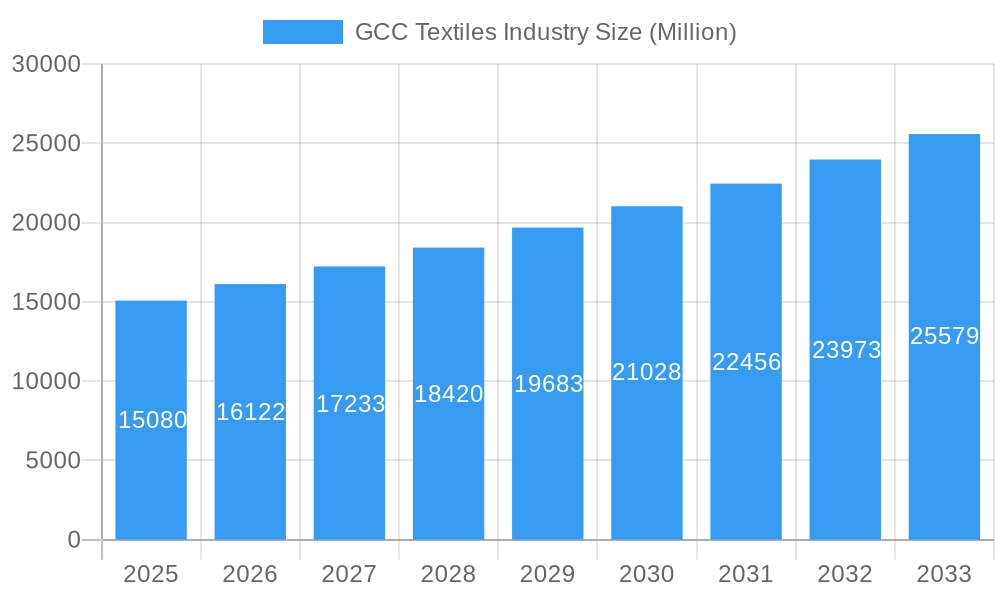
The GCC textiles industry, valued at $15.08 billion in 2025, is projected to experience robust growth, driven by a compound annual growth rate (CAGR) of 6.78% from 2025 to 2033. This expansion is fueled by several key factors. Firstly, a burgeoning population and rising disposable incomes within the GCC region are stimulating demand for apparel and home textiles. Secondly, significant investments in infrastructure development and tourism are further boosting the industry. The increasing adoption of sustainable and technologically advanced textile production methods, coupled with government initiatives promoting diversification away from oil-based economies, are creating a favorable environment for growth. Furthermore, the region's strategic location, facilitating ease of trade with major global markets, provides a competitive advantage. However, challenges remain, including competition from low-cost producers in Asia and fluctuations in global commodity prices, which can impact profitability. The industry is segmented into various categories, including apparel, home textiles, and technical textiles, each with its own growth trajectory and market dynamics. Key players such as Unirab & Polvara Spinning Weaving & Silk, Misr Amreya, and AMCO are actively shaping the market landscape through innovation and strategic partnerships.

GCC Textiles Industry Market Size (In Billion)
The forecast period of 2025-2033 anticipates continued growth, with the market size potentially exceeding $25 billion by 2033, based on the projected CAGR. This projection considers the sustained increase in consumer spending, the continued development of regional infrastructure, and the implementation of government policies supporting the textile sector. While challenges such as global economic uncertainties and supply chain disruptions are acknowledged, the inherent growth drivers within the GCC region are expected to outweigh these headwinds. Further segmentation analysis will be crucial to accurately predict the performance of individual market segments within the projected timeframe, providing a more granular understanding of future market trends.
GCC Textiles Industry Company Market Share
GCC Textiles Industry: A Comprehensive Market Report (2019-2033)
Dive deep into the dynamic GCC textiles market with this comprehensive report, offering invaluable insights for strategic decision-making. This in-depth analysis covers the period from 2019 to 2033, providing a historical overview (2019-2024), a base year analysis (2025), and a robust forecast (2025-2033). Uncover key trends, challenges, and opportunities shaping this lucrative sector, including the impact of recent investments and strategic partnerships. Maximize your understanding of market dynamics, competition, and future potential.
GCC Textiles Industry Market Dynamics & Concentration
This section analyzes the competitive landscape of the GCC textiles industry, exploring market concentration, innovation drivers, regulatory frameworks, product substitutes, end-user trends, and mergers & acquisitions (M&A) activities.
The GCC textiles market exhibits a moderately concentrated structure, with a few major players holding significant market share. For example, xx% of the market is controlled by the top 5 players in 2024. However, a significant number of smaller and medium-sized enterprises (SMEs) contribute to the overall market volume. This dynamic is influenced by various factors:
- Innovation Drivers: The industry is witnessing increasing adoption of sustainable and technologically advanced manufacturing processes. This includes innovations in fiber production, digital printing, and smart textile technologies.
- Regulatory Frameworks: Government regulations regarding labor practices, environmental standards, and product safety significantly influence the operational costs and competitiveness of firms. The streamlining of regulations is expected to drive future growth.
- Product Substitutes: The presence of substitutes like synthetic fibers and other materials affects market share dynamics. The industry’s response to this challenge involves promoting the unique benefits of natural fibers and developing innovative blends.
- End-User Trends: Shifting consumer preferences toward eco-friendly and ethically sourced textiles are shaping product development and marketing strategies. The demand for high-performance fabrics across various sectors (sportswear, medical, etc.) is also accelerating innovation.
- M&A Activities: The number of M&A deals in the GCC textiles sector has seen a xx% increase in the past five years. This trend reflects the need for industry consolidation and expansion strategies. These deals have primarily focused on accessing new technologies, markets, or resources.
GCC Textiles Industry Industry Trends & Analysis
This section offers a deep dive into the evolving landscape of the GCC textiles market. We examine the key factors propelling market expansion, the transformative impact of technological advancements, shifting consumer demands, and the intricate competitive arena. The GCC textiles market is experiencing robust and sustained growth, fueled by a confluence of factors including rising disposable incomes, rapid urbanization, and the flourishing regional fashion industry. The Compound Annual Growth Rate (CAGR) for the forecast period (2025-2033) is projected to be approximately **XX%**, indicating significant expansion potential.
Several pivotal trends are actively reshaping the industry:
- Technological Disruptions: The integration of advanced technologies such as automation, AI-powered design tools, and 3D printing is revolutionizing manufacturing processes. These innovations are not only enhancing operational efficiency and productivity but also enabling greater product customization to meet specific market demands.
- Evolving Consumer Preferences: There is a marked and growing demand for textiles that are sustainable, ethically produced, and of superior quality. Consumers are increasingly informed and conscientious about the environmental and social implications of their fashion choices, driving a preference for responsible sourcing and production.
- Intensifying Competitive Dynamics: The GCC textiles market is characterized by heightened competition from both established domestic players and emerging international brands. This competitive pressure is a significant catalyst for industry-wide innovation, efficiency improvements, and the pursuit of differentiation.
Leading Markets & Segments in GCC Textiles Industry
This section identifies the dominant regions, countries, and segments within the GCC textiles industry.
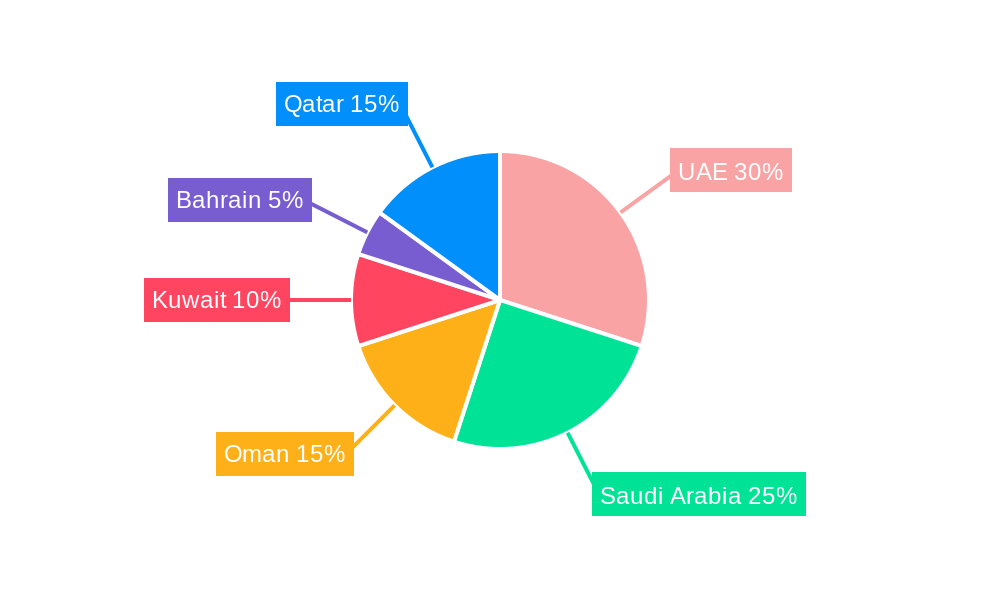
The UAE and Saudi Arabia are the leading markets in the GCC textiles industry, holding a combined market share of approximately xx% in 2024. This dominance is attributed to:
- Economic Policies: Supportive government policies, including infrastructure development, incentives for foreign investment, and free trade agreements, promote industry growth.
- Infrastructure: Well-developed logistics and supply chain networks facilitate efficient production and distribution.
Further segmentation reveals significant growth in specific segments:
- Ready-to-wear garments: This segment is particularly influenced by evolving fashion trends and increasing consumer spending.
- Technical textiles: The healthcare, automotive, and industrial sectors are driving demand for specialized textiles.
GCC Textiles Industry Product Developments
The GCC textiles industry is witnessing significant innovation in product development, driven by technological advancements and evolving consumer preferences. New materials like sustainable fibers and innovative fabric blends are entering the market, offering improved performance characteristics, comfort, and aesthetic appeal. The industry's focus on developing specialized textiles for diverse applications, such as sportswear and medical textiles, is further driving product diversification. This focus on meeting the evolving demands of consumers and industrial sectors will contribute to substantial growth in the forecast period.
Key Drivers of GCC Textiles Industry Growth
Several factors contribute to the continued growth of the GCC textiles industry. Firstly, increasing disposable incomes and a growing population fuel consumer demand for apparel and textiles. Secondly, government initiatives supporting infrastructure development and attracting foreign investment play a significant role in promoting economic growth and industrial expansion. Thirdly, technological advancements in manufacturing processes enhance efficiency and reduce costs, enabling greater competitiveness.
Challenges in the GCC Textiles Industry Market
Despite its growth trajectory, the GCC textiles industry navigates several significant challenges. These include the inherent high cost of labor and a substantial reliance on imported raw materials, which can impact cost competitiveness. Furthermore, intense competition from low-cost producers globally presents a continuous hurdle. Volatility in global commodity prices and persistent supply chain disruptions add layers of uncertainty to operational planning. The increasing stringency of environmental regulations necessitates significant investments in adopting sustainable practices, which can initially impact operational efficiency and overall competitiveness. These multifaceted challenges collectively influence market growth potential and profitability.
Emerging Opportunities in GCC Textiles Industry
The GCC textiles industry is well-positioned to capitalize on a range of emerging opportunities that promise further expansion and innovation. The escalating global and regional emphasis on sustainability, coupled with rapid advancements in eco-friendly production technologies, presents fertile ground for companies to innovate and secure a more substantial market share. The region's strategic geographical location and robust network of international trade relationships provide excellent access to global markets, thereby fostering export-led growth. Strategic collaborations, synergistic partnerships, and dedicated investments in research and development are key to unlocking the full spectrum of market potential and driving future success.
Leading Players in the GCC Textiles Industry Sector
- Unirab & Polvara Spinning Weaving & Silk
- Misr Amreya
- AMCO
- Avgol
- Millennium Fashions Industries
- Embee Group
- Kabale
- FPC Coated Technical Textiles
- Alyaf Industrial Company Ltd
- Aratex Group
- Lomar Selection
- Valleystar Uniforms (List Not Exhaustive)
Key Milestones in GCC Textiles Industry Industry
- February 2023: Saudi Arabia's MODON (Saudi Authority for Industrial Cities and Technology Zones) announced a significant investment of USD 1.1 billion in the textile sector. This landmark initiative encompasses 125 industrial contracts distributed across 19 cities, covering an expansive area exceeding one million square meters. This development marks a substantial endorsement of the Kingdom's textile ambitions and underscores its considerable growth potential.
- October 2022: Nykaa, a prominent Indian beauty and fashion e-commerce retailer, forged a strategic partnership with Dubai's Apparel Group. This collaboration signifies a major expansion move into the GCC market by a key international player, signaling an intensification of regional competition and a catalyst for accelerated innovation within the sector.
Strategic Outlook for GCC Textiles Industry Market
The GCC textiles market is poised for continued and sustained growth throughout the forecast period. This optimistic outlook is underpinned by favorable demographic trends, a consistent rise in disposable incomes, and robust government support for industrial development. To effectively leverage the expanding market opportunities, companies must prioritize strategic investments in sustainable practices, embrace technological innovation, and cultivate strong, recognizable brand identities. A focused approach on niche segments, such as technical textiles, and the proactive integration of sustainable practices will be instrumental in building competitive advantages and ensuring long-term profitability in this dynamic market.
GCC Textiles Industry Segmentation
-
1. Application
- 1.1. Clothing
- 1.2. Industrial/Technical Applications
- 1.3. Household Applications
-
2. Material Type
- 2.1. Cotton
- 2.2. Jute
- 2.3. Silk
- 2.4. Synthetics
- 2.5. Wool
-
3. Process
- 3.1. Woven
- 3.2. Non-woven
GCC Textiles Industry Segmentation By Geography
-
1. North America
- 1.1. United States
- 1.2. Canada
- 1.3. Mexico
-
2. South America
- 2.1. Brazil
- 2.2. Argentina
- 2.3. Rest of South America
-
3. Europe
- 3.1. United Kingdom
- 3.2. Germany
- 3.3. France
- 3.4. Italy
- 3.5. Spain
- 3.6. Russia
- 3.7. Benelux
- 3.8. Nordics
- 3.9. Rest of Europe
-
4. Middle East & Africa
- 4.1. Turkey
- 4.2. Israel
- 4.3. GCC
- 4.4. North Africa
- 4.5. South Africa
- 4.6. Rest of Middle East & Africa
-
5. Asia Pacific
- 5.1. China
- 5.2. India
- 5.3. Japan
- 5.4. South Korea
- 5.5. ASEAN
- 5.6. Oceania
- 5.7. Rest of Asia Pacific
GCC Textiles Industry Regional Market Share
Geographic Coverage of GCC Textiles Industry
GCC Textiles Industry REPORT HIGHLIGHTS
| Aspects | Details |
|---|---|
| Study Period | 2020-2034 |
| Base Year | 2025 |
| Estimated Year | 2026 |
| Forecast Period | 2026-2034 |
| Historical Period | 2020-2025 |
| Growth Rate | CAGR of 6.78% from 2020-2034 |
| Segmentation |
|
Table of Contents
- 1. Introduction
- 1.1. Research Scope
- 1.2. Market Segmentation
- 1.3. Research Objective
- 1.4. Definitions and Assumptions
- 2. Executive Summary
- 2.1. Market Snapshot
- 3. Market Dynamics
- 3.1. Market Drivers
- 3.2. Market Restrains
- 3.3. Market Trends
- 3.4. Market Opportunities
- 4. Market Factor Analysis
- 4.1. Porters Five Forces
- 4.1.1. Bargaining Power of Suppliers
- 4.1.2. Bargaining Power of Buyers
- 4.1.3. Threat of New Entrants
- 4.1.4. Threat of Substitutes
- 4.1.5. Competitive Rivalry
- 4.2. PESTEL analysis
- 4.3. BCG Analysis
- 4.3.1. Stars (High Growth, High Market Share)
- 4.3.2. Cash Cows (Low Growth, High Market Share)
- 4.3.3. Question Mark (High Growth, Low Market Share)
- 4.3.4. Dogs (Low Growth, Low Market Share)
- 4.4. Ansoff Matrix Analysis
- 4.5. Supply Chain Analysis
- 4.6. Regulatory Landscape
- 4.7. Current Market Potential and Opportunity Assessment (TAM–SAM–SOM Framework)
- 4.8. MDP Analyst Note
- 4.1. Porters Five Forces
- 5. Market Analysis, Insights and Forecast 2021-2033
- 5.1. Market Analysis, Insights and Forecast - by Application
- 5.1.1. Clothing
- 5.1.2. Industrial/Technical Applications
- 5.1.3. Household Applications
- 5.2. Market Analysis, Insights and Forecast - by Material Type
- 5.2.1. Cotton
- 5.2.2. Jute
- 5.2.3. Silk
- 5.2.4. Synthetics
- 5.2.5. Wool
- 5.3. Market Analysis, Insights and Forecast - by Process
- 5.3.1. Woven
- 5.3.2. Non-woven
- 5.4. Market Analysis, Insights and Forecast - by Region
- 5.4.1. North America
- 5.4.2. South America
- 5.4.3. Europe
- 5.4.4. Middle East & Africa
- 5.4.5. Asia Pacific
- 5.1. Market Analysis, Insights and Forecast - by Application
- 6. Global GCC Textiles Industry Analysis, Insights and Forecast, 2021-2033
- 6.1. Market Analysis, Insights and Forecast - by Application
- 6.1.1. Clothing
- 6.1.2. Industrial/Technical Applications
- 6.1.3. Household Applications
- 6.2. Market Analysis, Insights and Forecast - by Material Type
- 6.2.1. Cotton
- 6.2.2. Jute
- 6.2.3. Silk
- 6.2.4. Synthetics
- 6.2.5. Wool
- 6.3. Market Analysis, Insights and Forecast - by Process
- 6.3.1. Woven
- 6.3.2. Non-woven
- 6.1. Market Analysis, Insights and Forecast - by Application
- 7. North America GCC Textiles Industry Analysis, Insights and Forecast, 2020-2032
- 7.1. Market Analysis, Insights and Forecast - by Application
- 7.1.1. Clothing
- 7.1.2. Industrial/Technical Applications
- 7.1.3. Household Applications
- 7.2. Market Analysis, Insights and Forecast - by Material Type
- 7.2.1. Cotton
- 7.2.2. Jute
- 7.2.3. Silk
- 7.2.4. Synthetics
- 7.2.5. Wool
- 7.3. Market Analysis, Insights and Forecast - by Process
- 7.3.1. Woven
- 7.3.2. Non-woven
- 7.1. Market Analysis, Insights and Forecast - by Application
- 8. South America GCC Textiles Industry Analysis, Insights and Forecast, 2020-2032
- 8.1. Market Analysis, Insights and Forecast - by Application
- 8.1.1. Clothing
- 8.1.2. Industrial/Technical Applications
- 8.1.3. Household Applications
- 8.2. Market Analysis, Insights and Forecast - by Material Type
- 8.2.1. Cotton
- 8.2.2. Jute
- 8.2.3. Silk
- 8.2.4. Synthetics
- 8.2.5. Wool
- 8.3. Market Analysis, Insights and Forecast - by Process
- 8.3.1. Woven
- 8.3.2. Non-woven
- 8.1. Market Analysis, Insights and Forecast - by Application
- 9. Europe GCC Textiles Industry Analysis, Insights and Forecast, 2020-2032
- 9.1. Market Analysis, Insights and Forecast - by Application
- 9.1.1. Clothing
- 9.1.2. Industrial/Technical Applications
- 9.1.3. Household Applications
- 9.2. Market Analysis, Insights and Forecast - by Material Type
- 9.2.1. Cotton
- 9.2.2. Jute
- 9.2.3. Silk
- 9.2.4. Synthetics
- 9.2.5. Wool
- 9.3. Market Analysis, Insights and Forecast - by Process
- 9.3.1. Woven
- 9.3.2. Non-woven
- 9.1. Market Analysis, Insights and Forecast - by Application
- 10. Middle East & Africa GCC Textiles Industry Analysis, Insights and Forecast, 2020-2032
- 10.1. Market Analysis, Insights and Forecast - by Application
- 10.1.1. Clothing
- 10.1.2. Industrial/Technical Applications
- 10.1.3. Household Applications
- 10.2. Market Analysis, Insights and Forecast - by Material Type
- 10.2.1. Cotton
- 10.2.2. Jute
- 10.2.3. Silk
- 10.2.4. Synthetics
- 10.2.5. Wool
- 10.3. Market Analysis, Insights and Forecast - by Process
- 10.3.1. Woven
- 10.3.2. Non-woven
- 10.1. Market Analysis, Insights and Forecast - by Application
- 11. Asia Pacific GCC Textiles Industry Analysis, Insights and Forecast, 2020-2032
- 11.1. Market Analysis, Insights and Forecast - by Application
- 11.1.1. Clothing
- 11.1.2. Industrial/Technical Applications
- 11.1.3. Household Applications
- 11.2. Market Analysis, Insights and Forecast - by Material Type
- 11.2.1. Cotton
- 11.2.2. Jute
- 11.2.3. Silk
- 11.2.4. Synthetics
- 11.2.5. Wool
- 11.3. Market Analysis, Insights and Forecast - by Process
- 11.3.1. Woven
- 11.3.2. Non-woven
- 11.1. Market Analysis, Insights and Forecast - by Application
- 12. Competitive Analysis
- 12.1. Company Profiles
- 12.1.1 Unirab & Polvara Spinning Weaving & Silk
- 12.1.1.1. Company Overview
- 12.1.1.2. Products
- 12.1.1.3. Company Financials
- 12.1.1.4. SWOT Analysis
- 12.1.2 Misr Amreya
- 12.1.2.1. Company Overview
- 12.1.2.2. Products
- 12.1.2.3. Company Financials
- 12.1.2.4. SWOT Analysis
- 12.1.3 AMCO
- 12.1.3.1. Company Overview
- 12.1.3.2. Products
- 12.1.3.3. Company Financials
- 12.1.3.4. SWOT Analysis
- 12.1.4 Avgol
- 12.1.4.1. Company Overview
- 12.1.4.2. Products
- 12.1.4.3. Company Financials
- 12.1.4.4. SWOT Analysis
- 12.1.5 Millennium Fashions Industries
- 12.1.5.1. Company Overview
- 12.1.5.2. Products
- 12.1.5.3. Company Financials
- 12.1.5.4. SWOT Analysis
- 12.1.6 Embee Group
- 12.1.6.1. Company Overview
- 12.1.6.2. Products
- 12.1.6.3. Company Financials
- 12.1.6.4. SWOT Analysis
- 12.1.7 Kabale
- 12.1.7.1. Company Overview
- 12.1.7.2. Products
- 12.1.7.3. Company Financials
- 12.1.7.4. SWOT Analysis
- 12.1.8 FPC Coated Technical Textiles
- 12.1.8.1. Company Overview
- 12.1.8.2. Products
- 12.1.8.3. Company Financials
- 12.1.8.4. SWOT Analysis
- 12.1.9 Alyaf Industrial Company Ltd
- 12.1.9.1. Company Overview
- 12.1.9.2. Products
- 12.1.9.3. Company Financials
- 12.1.9.4. SWOT Analysis
- 12.1.10 Aratex Group
- 12.1.10.1. Company Overview
- 12.1.10.2. Products
- 12.1.10.3. Company Financials
- 12.1.10.4. SWOT Analysis
- 12.1.11 Lomar Selection
- 12.1.11.1. Company Overview
- 12.1.11.2. Products
- 12.1.11.3. Company Financials
- 12.1.11.4. SWOT Analysis
- 12.1.12 Valleystar Uniforms**List Not Exhaustive
- 12.1.12.1. Company Overview
- 12.1.12.2. Products
- 12.1.12.3. Company Financials
- 12.1.12.4. SWOT Analysis
- 12.1.1 Unirab & Polvara Spinning Weaving & Silk
- 12.2. Market Entropy
- 12.2.1 Company's Key Areas Served
- 12.2.2 Recent Developments
- 12.3. Company Market Share Analysis 2025
- 12.3.1 Top 5 Companies Market Share Analysis
- 12.3.2 Top 3 Companies Market Share Analysis
- 12.4. List of Potential Customers
- 13. Research Methodology
List of Figures
- Figure 1: Global GCC Textiles Industry Revenue Breakdown (Million, %) by Region 2025 & 2033
- Figure 2: Global GCC Textiles Industry Volume Breakdown (Billion, %) by Region 2025 & 2033
- Figure 3: North America GCC Textiles Industry Revenue (Million), by Application 2025 & 2033
- Figure 4: North America GCC Textiles Industry Volume (Billion), by Application 2025 & 2033
- Figure 5: North America GCC Textiles Industry Revenue Share (%), by Application 2025 & 2033
- Figure 6: North America GCC Textiles Industry Volume Share (%), by Application 2025 & 2033
- Figure 7: North America GCC Textiles Industry Revenue (Million), by Material Type 2025 & 2033
- Figure 8: North America GCC Textiles Industry Volume (Billion), by Material Type 2025 & 2033
- Figure 9: North America GCC Textiles Industry Revenue Share (%), by Material Type 2025 & 2033
- Figure 10: North America GCC Textiles Industry Volume Share (%), by Material Type 2025 & 2033
- Figure 11: North America GCC Textiles Industry Revenue (Million), by Process 2025 & 2033
- Figure 12: North America GCC Textiles Industry Volume (Billion), by Process 2025 & 2033
- Figure 13: North America GCC Textiles Industry Revenue Share (%), by Process 2025 & 2033
- Figure 14: North America GCC Textiles Industry Volume Share (%), by Process 2025 & 2033
- Figure 15: North America GCC Textiles Industry Revenue (Million), by Country 2025 & 2033
- Figure 16: North America GCC Textiles Industry Volume (Billion), by Country 2025 & 2033
- Figure 17: North America GCC Textiles Industry Revenue Share (%), by Country 2025 & 2033
- Figure 18: North America GCC Textiles Industry Volume Share (%), by Country 2025 & 2033
- Figure 19: South America GCC Textiles Industry Revenue (Million), by Application 2025 & 2033
- Figure 20: South America GCC Textiles Industry Volume (Billion), by Application 2025 & 2033
- Figure 21: South America GCC Textiles Industry Revenue Share (%), by Application 2025 & 2033
- Figure 22: South America GCC Textiles Industry Volume Share (%), by Application 2025 & 2033
- Figure 23: South America GCC Textiles Industry Revenue (Million), by Material Type 2025 & 2033
- Figure 24: South America GCC Textiles Industry Volume (Billion), by Material Type 2025 & 2033
- Figure 25: South America GCC Textiles Industry Revenue Share (%), by Material Type 2025 & 2033
- Figure 26: South America GCC Textiles Industry Volume Share (%), by Material Type 2025 & 2033
- Figure 27: South America GCC Textiles Industry Revenue (Million), by Process 2025 & 2033
- Figure 28: South America GCC Textiles Industry Volume (Billion), by Process 2025 & 2033
- Figure 29: South America GCC Textiles Industry Revenue Share (%), by Process 2025 & 2033
- Figure 30: South America GCC Textiles Industry Volume Share (%), by Process 2025 & 2033
- Figure 31: South America GCC Textiles Industry Revenue (Million), by Country 2025 & 2033
- Figure 32: South America GCC Textiles Industry Volume (Billion), by Country 2025 & 2033
- Figure 33: South America GCC Textiles Industry Revenue Share (%), by Country 2025 & 2033
- Figure 34: South America GCC Textiles Industry Volume Share (%), by Country 2025 & 2033
- Figure 35: Europe GCC Textiles Industry Revenue (Million), by Application 2025 & 2033
- Figure 36: Europe GCC Textiles Industry Volume (Billion), by Application 2025 & 2033
- Figure 37: Europe GCC Textiles Industry Revenue Share (%), by Application 2025 & 2033
- Figure 38: Europe GCC Textiles Industry Volume Share (%), by Application 2025 & 2033
- Figure 39: Europe GCC Textiles Industry Revenue (Million), by Material Type 2025 & 2033
- Figure 40: Europe GCC Textiles Industry Volume (Billion), by Material Type 2025 & 2033
- Figure 41: Europe GCC Textiles Industry Revenue Share (%), by Material Type 2025 & 2033
- Figure 42: Europe GCC Textiles Industry Volume Share (%), by Material Type 2025 & 2033
- Figure 43: Europe GCC Textiles Industry Revenue (Million), by Process 2025 & 2033
- Figure 44: Europe GCC Textiles Industry Volume (Billion), by Process 2025 & 2033
- Figure 45: Europe GCC Textiles Industry Revenue Share (%), by Process 2025 & 2033
- Figure 46: Europe GCC Textiles Industry Volume Share (%), by Process 2025 & 2033
- Figure 47: Europe GCC Textiles Industry Revenue (Million), by Country 2025 & 2033
- Figure 48: Europe GCC Textiles Industry Volume (Billion), by Country 2025 & 2033
- Figure 49: Europe GCC Textiles Industry Revenue Share (%), by Country 2025 & 2033
- Figure 50: Europe GCC Textiles Industry Volume Share (%), by Country 2025 & 2033
- Figure 51: Middle East & Africa GCC Textiles Industry Revenue (Million), by Application 2025 & 2033
- Figure 52: Middle East & Africa GCC Textiles Industry Volume (Billion), by Application 2025 & 2033
- Figure 53: Middle East & Africa GCC Textiles Industry Revenue Share (%), by Application 2025 & 2033
- Figure 54: Middle East & Africa GCC Textiles Industry Volume Share (%), by Application 2025 & 2033
- Figure 55: Middle East & Africa GCC Textiles Industry Revenue (Million), by Material Type 2025 & 2033
- Figure 56: Middle East & Africa GCC Textiles Industry Volume (Billion), by Material Type 2025 & 2033
- Figure 57: Middle East & Africa GCC Textiles Industry Revenue Share (%), by Material Type 2025 & 2033
- Figure 58: Middle East & Africa GCC Textiles Industry Volume Share (%), by Material Type 2025 & 2033
- Figure 59: Middle East & Africa GCC Textiles Industry Revenue (Million), by Process 2025 & 2033
- Figure 60: Middle East & Africa GCC Textiles Industry Volume (Billion), by Process 2025 & 2033
- Figure 61: Middle East & Africa GCC Textiles Industry Revenue Share (%), by Process 2025 & 2033
- Figure 62: Middle East & Africa GCC Textiles Industry Volume Share (%), by Process 2025 & 2033
- Figure 63: Middle East & Africa GCC Textiles Industry Revenue (Million), by Country 2025 & 2033
- Figure 64: Middle East & Africa GCC Textiles Industry Volume (Billion), by Country 2025 & 2033
- Figure 65: Middle East & Africa GCC Textiles Industry Revenue Share (%), by Country 2025 & 2033
- Figure 66: Middle East & Africa GCC Textiles Industry Volume Share (%), by Country 2025 & 2033
- Figure 67: Asia Pacific GCC Textiles Industry Revenue (Million), by Application 2025 & 2033
- Figure 68: Asia Pacific GCC Textiles Industry Volume (Billion), by Application 2025 & 2033
- Figure 69: Asia Pacific GCC Textiles Industry Revenue Share (%), by Application 2025 & 2033
- Figure 70: Asia Pacific GCC Textiles Industry Volume Share (%), by Application 2025 & 2033
- Figure 71: Asia Pacific GCC Textiles Industry Revenue (Million), by Material Type 2025 & 2033
- Figure 72: Asia Pacific GCC Textiles Industry Volume (Billion), by Material Type 2025 & 2033
- Figure 73: Asia Pacific GCC Textiles Industry Revenue Share (%), by Material Type 2025 & 2033
- Figure 74: Asia Pacific GCC Textiles Industry Volume Share (%), by Material Type 2025 & 2033
- Figure 75: Asia Pacific GCC Textiles Industry Revenue (Million), by Process 2025 & 2033
- Figure 76: Asia Pacific GCC Textiles Industry Volume (Billion), by Process 2025 & 2033
- Figure 77: Asia Pacific GCC Textiles Industry Revenue Share (%), by Process 2025 & 2033
- Figure 78: Asia Pacific GCC Textiles Industry Volume Share (%), by Process 2025 & 2033
- Figure 79: Asia Pacific GCC Textiles Industry Revenue (Million), by Country 2025 & 2033
- Figure 80: Asia Pacific GCC Textiles Industry Volume (Billion), by Country 2025 & 2033
- Figure 81: Asia Pacific GCC Textiles Industry Revenue Share (%), by Country 2025 & 2033
- Figure 82: Asia Pacific GCC Textiles Industry Volume Share (%), by Country 2025 & 2033
List of Tables
- Table 1: Global GCC Textiles Industry Revenue Million Forecast, by Application 2020 & 2033
- Table 2: Global GCC Textiles Industry Volume Billion Forecast, by Application 2020 & 2033
- Table 3: Global GCC Textiles Industry Revenue Million Forecast, by Material Type 2020 & 2033
- Table 4: Global GCC Textiles Industry Volume Billion Forecast, by Material Type 2020 & 2033
- Table 5: Global GCC Textiles Industry Revenue Million Forecast, by Process 2020 & 2033
- Table 6: Global GCC Textiles Industry Volume Billion Forecast, by Process 2020 & 2033
- Table 7: Global GCC Textiles Industry Revenue Million Forecast, by Region 2020 & 2033
- Table 8: Global GCC Textiles Industry Volume Billion Forecast, by Region 2020 & 2033
- Table 9: Global GCC Textiles Industry Revenue Million Forecast, by Application 2020 & 2033
- Table 10: Global GCC Textiles Industry Volume Billion Forecast, by Application 2020 & 2033
- Table 11: Global GCC Textiles Industry Revenue Million Forecast, by Material Type 2020 & 2033
- Table 12: Global GCC Textiles Industry Volume Billion Forecast, by Material Type 2020 & 2033
- Table 13: Global GCC Textiles Industry Revenue Million Forecast, by Process 2020 & 2033
- Table 14: Global GCC Textiles Industry Volume Billion Forecast, by Process 2020 & 2033
- Table 15: Global GCC Textiles Industry Revenue Million Forecast, by Country 2020 & 2033
- Table 16: Global GCC Textiles Industry Volume Billion Forecast, by Country 2020 & 2033
- Table 17: United States GCC Textiles Industry Revenue (Million) Forecast, by Application 2020 & 2033
- Table 18: United States GCC Textiles Industry Volume (Billion) Forecast, by Application 2020 & 2033
- Table 19: Canada GCC Textiles Industry Revenue (Million) Forecast, by Application 2020 & 2033
- Table 20: Canada GCC Textiles Industry Volume (Billion) Forecast, by Application 2020 & 2033
- Table 21: Mexico GCC Textiles Industry Revenue (Million) Forecast, by Application 2020 & 2033
- Table 22: Mexico GCC Textiles Industry Volume (Billion) Forecast, by Application 2020 & 2033
- Table 23: Global GCC Textiles Industry Revenue Million Forecast, by Application 2020 & 2033
- Table 24: Global GCC Textiles Industry Volume Billion Forecast, by Application 2020 & 2033
- Table 25: Global GCC Textiles Industry Revenue Million Forecast, by Material Type 2020 & 2033
- Table 26: Global GCC Textiles Industry Volume Billion Forecast, by Material Type 2020 & 2033
- Table 27: Global GCC Textiles Industry Revenue Million Forecast, by Process 2020 & 2033
- Table 28: Global GCC Textiles Industry Volume Billion Forecast, by Process 2020 & 2033
- Table 29: Global GCC Textiles Industry Revenue Million Forecast, by Country 2020 & 2033
- Table 30: Global GCC Textiles Industry Volume Billion Forecast, by Country 2020 & 2033
- Table 31: Brazil GCC Textiles Industry Revenue (Million) Forecast, by Application 2020 & 2033
- Table 32: Brazil GCC Textiles Industry Volume (Billion) Forecast, by Application 2020 & 2033
- Table 33: Argentina GCC Textiles Industry Revenue (Million) Forecast, by Application 2020 & 2033
- Table 34: Argentina GCC Textiles Industry Volume (Billion) Forecast, by Application 2020 & 2033
- Table 35: Rest of South America GCC Textiles Industry Revenue (Million) Forecast, by Application 2020 & 2033
- Table 36: Rest of South America GCC Textiles Industry Volume (Billion) Forecast, by Application 2020 & 2033
- Table 37: Global GCC Textiles Industry Revenue Million Forecast, by Application 2020 & 2033
- Table 38: Global GCC Textiles Industry Volume Billion Forecast, by Application 2020 & 2033
- Table 39: Global GCC Textiles Industry Revenue Million Forecast, by Material Type 2020 & 2033
- Table 40: Global GCC Textiles Industry Volume Billion Forecast, by Material Type 2020 & 2033
- Table 41: Global GCC Textiles Industry Revenue Million Forecast, by Process 2020 & 2033
- Table 42: Global GCC Textiles Industry Volume Billion Forecast, by Process 2020 & 2033
- Table 43: Global GCC Textiles Industry Revenue Million Forecast, by Country 2020 & 2033
- Table 44: Global GCC Textiles Industry Volume Billion Forecast, by Country 2020 & 2033
- Table 45: United Kingdom GCC Textiles Industry Revenue (Million) Forecast, by Application 2020 & 2033
- Table 46: United Kingdom GCC Textiles Industry Volume (Billion) Forecast, by Application 2020 & 2033
- Table 47: Germany GCC Textiles Industry Revenue (Million) Forecast, by Application 2020 & 2033
- Table 48: Germany GCC Textiles Industry Volume (Billion) Forecast, by Application 2020 & 2033
- Table 49: France GCC Textiles Industry Revenue (Million) Forecast, by Application 2020 & 2033
- Table 50: France GCC Textiles Industry Volume (Billion) Forecast, by Application 2020 & 2033
- Table 51: Italy GCC Textiles Industry Revenue (Million) Forecast, by Application 2020 & 2033
- Table 52: Italy GCC Textiles Industry Volume (Billion) Forecast, by Application 2020 & 2033
- Table 53: Spain GCC Textiles Industry Revenue (Million) Forecast, by Application 2020 & 2033
- Table 54: Spain GCC Textiles Industry Volume (Billion) Forecast, by Application 2020 & 2033
- Table 55: Russia GCC Textiles Industry Revenue (Million) Forecast, by Application 2020 & 2033
- Table 56: Russia GCC Textiles Industry Volume (Billion) Forecast, by Application 2020 & 2033
- Table 57: Benelux GCC Textiles Industry Revenue (Million) Forecast, by Application 2020 & 2033
- Table 58: Benelux GCC Textiles Industry Volume (Billion) Forecast, by Application 2020 & 2033
- Table 59: Nordics GCC Textiles Industry Revenue (Million) Forecast, by Application 2020 & 2033
- Table 60: Nordics GCC Textiles Industry Volume (Billion) Forecast, by Application 2020 & 2033
- Table 61: Rest of Europe GCC Textiles Industry Revenue (Million) Forecast, by Application 2020 & 2033
- Table 62: Rest of Europe GCC Textiles Industry Volume (Billion) Forecast, by Application 2020 & 2033
- Table 63: Global GCC Textiles Industry Revenue Million Forecast, by Application 2020 & 2033
- Table 64: Global GCC Textiles Industry Volume Billion Forecast, by Application 2020 & 2033
- Table 65: Global GCC Textiles Industry Revenue Million Forecast, by Material Type 2020 & 2033
- Table 66: Global GCC Textiles Industry Volume Billion Forecast, by Material Type 2020 & 2033
- Table 67: Global GCC Textiles Industry Revenue Million Forecast, by Process 2020 & 2033
- Table 68: Global GCC Textiles Industry Volume Billion Forecast, by Process 2020 & 2033
- Table 69: Global GCC Textiles Industry Revenue Million Forecast, by Country 2020 & 2033
- Table 70: Global GCC Textiles Industry Volume Billion Forecast, by Country 2020 & 2033
- Table 71: Turkey GCC Textiles Industry Revenue (Million) Forecast, by Application 2020 & 2033
- Table 72: Turkey GCC Textiles Industry Volume (Billion) Forecast, by Application 2020 & 2033
- Table 73: Israel GCC Textiles Industry Revenue (Million) Forecast, by Application 2020 & 2033
- Table 74: Israel GCC Textiles Industry Volume (Billion) Forecast, by Application 2020 & 2033
- Table 75: GCC GCC Textiles Industry Revenue (Million) Forecast, by Application 2020 & 2033
- Table 76: GCC GCC Textiles Industry Volume (Billion) Forecast, by Application 2020 & 2033
- Table 77: North Africa GCC Textiles Industry Revenue (Million) Forecast, by Application 2020 & 2033
- Table 78: North Africa GCC Textiles Industry Volume (Billion) Forecast, by Application 2020 & 2033
- Table 79: South Africa GCC Textiles Industry Revenue (Million) Forecast, by Application 2020 & 2033
- Table 80: South Africa GCC Textiles Industry Volume (Billion) Forecast, by Application 2020 & 2033
- Table 81: Rest of Middle East & Africa GCC Textiles Industry Revenue (Million) Forecast, by Application 2020 & 2033
- Table 82: Rest of Middle East & Africa GCC Textiles Industry Volume (Billion) Forecast, by Application 2020 & 2033
- Table 83: Global GCC Textiles Industry Revenue Million Forecast, by Application 2020 & 2033
- Table 84: Global GCC Textiles Industry Volume Billion Forecast, by Application 2020 & 2033
- Table 85: Global GCC Textiles Industry Revenue Million Forecast, by Material Type 2020 & 2033
- Table 86: Global GCC Textiles Industry Volume Billion Forecast, by Material Type 2020 & 2033
- Table 87: Global GCC Textiles Industry Revenue Million Forecast, by Process 2020 & 2033
- Table 88: Global GCC Textiles Industry Volume Billion Forecast, by Process 2020 & 2033
- Table 89: Global GCC Textiles Industry Revenue Million Forecast, by Country 2020 & 2033
- Table 90: Global GCC Textiles Industry Volume Billion Forecast, by Country 2020 & 2033
- Table 91: China GCC Textiles Industry Revenue (Million) Forecast, by Application 2020 & 2033
- Table 92: China GCC Textiles Industry Volume (Billion) Forecast, by Application 2020 & 2033
- Table 93: India GCC Textiles Industry Revenue (Million) Forecast, by Application 2020 & 2033
- Table 94: India GCC Textiles Industry Volume (Billion) Forecast, by Application 2020 & 2033
- Table 95: Japan GCC Textiles Industry Revenue (Million) Forecast, by Application 2020 & 2033
- Table 96: Japan GCC Textiles Industry Volume (Billion) Forecast, by Application 2020 & 2033
- Table 97: South Korea GCC Textiles Industry Revenue (Million) Forecast, by Application 2020 & 2033
- Table 98: South Korea GCC Textiles Industry Volume (Billion) Forecast, by Application 2020 & 2033
- Table 99: ASEAN GCC Textiles Industry Revenue (Million) Forecast, by Application 2020 & 2033
- Table 100: ASEAN GCC Textiles Industry Volume (Billion) Forecast, by Application 2020 & 2033
- Table 101: Oceania GCC Textiles Industry Revenue (Million) Forecast, by Application 2020 & 2033
- Table 102: Oceania GCC Textiles Industry Volume (Billion) Forecast, by Application 2020 & 2033
- Table 103: Rest of Asia Pacific GCC Textiles Industry Revenue (Million) Forecast, by Application 2020 & 2033
- Table 104: Rest of Asia Pacific GCC Textiles Industry Volume (Billion) Forecast, by Application 2020 & 2033
Frequently Asked Questions
1. What is the projected Compound Annual Growth Rate (CAGR) of the GCC Textiles Industry?
The projected CAGR is approximately 6.78%.
2. Which companies are prominent players in the GCC Textiles Industry?
Key companies in the market include Unirab & Polvara Spinning Weaving & Silk, Misr Amreya, AMCO, Avgol, Millennium Fashions Industries, Embee Group, Kabale, FPC Coated Technical Textiles, Alyaf Industrial Company Ltd, Aratex Group, Lomar Selection, Valleystar Uniforms**List Not Exhaustive.
3. What are the main segments of the GCC Textiles Industry?
The market segments include Application, Material Type, Process.
4. Can you provide details about the market size?
The market size is estimated to be USD 15.08 Million as of 2022.
5. What are some drivers contributing to market growth?
3.; Growing fashion consciousness3.; Export Opportunities.
6. What are the notable trends driving market growth?
Rising Textile and Apparels Demand in UAE.
7. Are there any restraints impacting market growth?
3.; Growing fashion consciousness3.; Export Opportunities.
8. Can you provide examples of recent developments in the market?
Febuary 2023, Saudi’s MODON announces USD 1.1bn textile investments. These investments are distributed over 125 industrial contracts in 19 industrial cities, covering a total area of more than one million square meters. According to Al-Argoubi, the textiles and men’s supplies sector is experiencing high growth in the Kingdom.
9. What pricing options are available for accessing the report?
Pricing options include single-user, multi-user, and enterprise licenses priced at USD 3800, USD 4500, and USD 5800 respectively.
10. Is the market size provided in terms of value or volume?
The market size is provided in terms of value, measured in Million and volume, measured in Billion.
11. Are there any specific market keywords associated with the report?
Yes, the market keyword associated with the report is "GCC Textiles Industry," which aids in identifying and referencing the specific market segment covered.
12. How do I determine which pricing option suits my needs best?
The pricing options vary based on user requirements and access needs. Individual users may opt for single-user licenses, while businesses requiring broader access may choose multi-user or enterprise licenses for cost-effective access to the report.
13. Are there any additional resources or data provided in the GCC Textiles Industry report?
While the report offers comprehensive insights, it's advisable to review the specific contents or supplementary materials provided to ascertain if additional resources or data are available.
14. How can I stay updated on further developments or reports in the GCC Textiles Industry?
To stay informed about further developments, trends, and reports in the GCC Textiles Industry, consider subscribing to industry newsletters, following relevant companies and organizations, or regularly checking reputable industry news sources and publications.
Methodology
Step 1 - Identification of Relevant Samples Size from Population Database


Step 2 - Approaches for Defining Global Market Size (Value, Volume* & Price*)

Note*: In applicable scenarios
Step 3 - Data Sources
Primary Research
- Web Analytics
- Survey Reports
- Research Institute
- Latest Research Reports
- Opinion Leaders
Secondary Research
- Annual Reports
- White Paper
- Latest Press Release
- Industry Association
- Paid Database
- Investor Presentations

Step 4 - Data Triangulation
Involves using different sources of information in order to increase the validity of a study
These sources are likely to be stakeholders in a program - participants, other researchers, program staff, other community members, and so on.
Then we put all data in single framework & apply various statistical tools to find out the dynamic on the market.
During the analysis stage, feedback from the stakeholder groups would be compared to determine areas of agreement as well as areas of divergence