

Key Insights
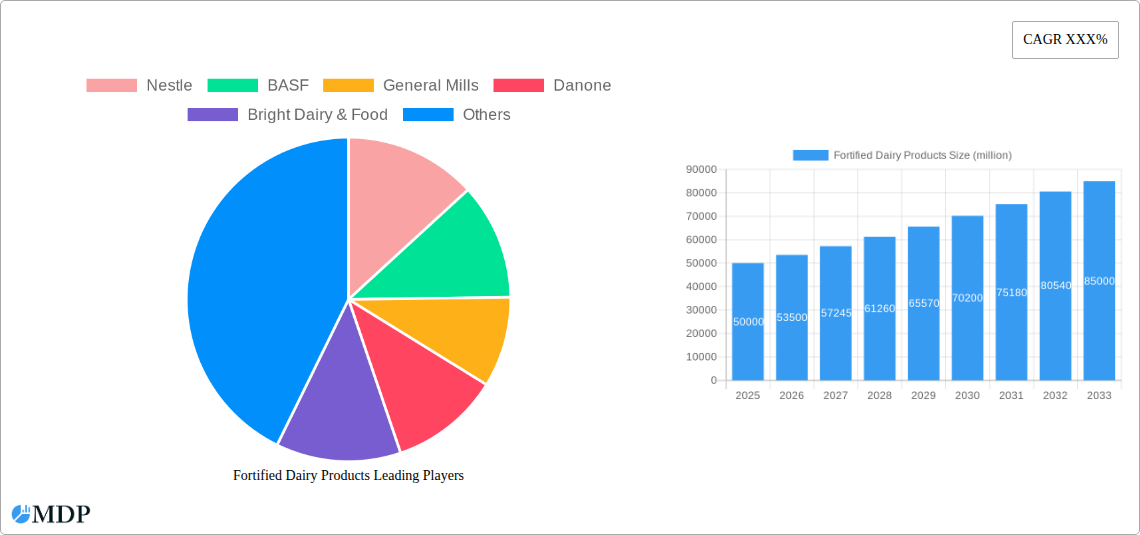
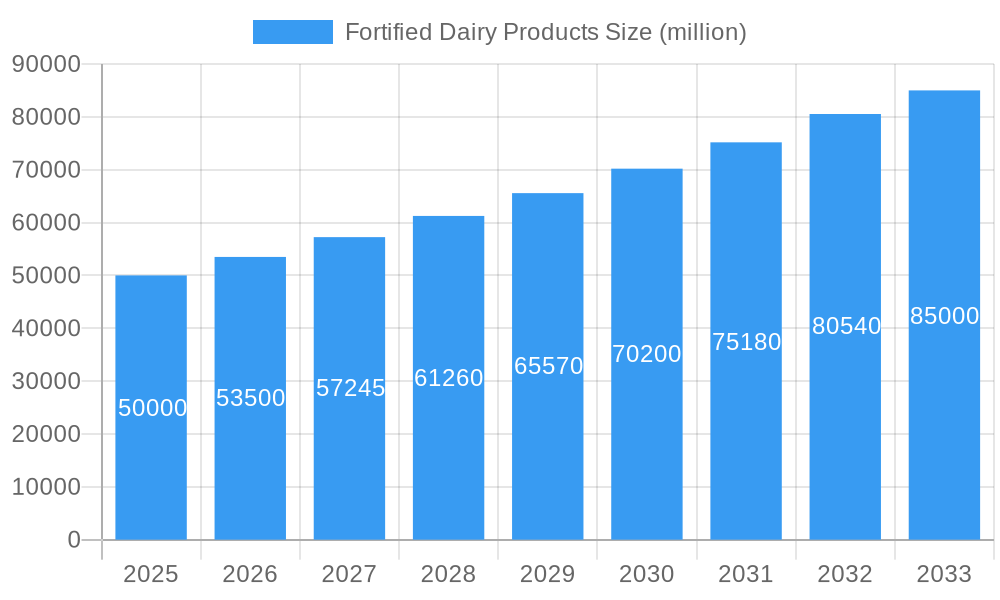
The global fortified dairy products market is experiencing robust growth, driven by increasing consumer awareness of nutritional deficiencies and the rising demand for convenient, health-enhancing food options. The market, estimated at $50 billion in 2025, is projected to witness a Compound Annual Growth Rate (CAGR) of 7% from 2025 to 2033, reaching approximately $85 billion by 2033. This expansion is fueled by several key factors. Firstly, the growing prevalence of vitamin D, calcium, and other micronutrient deficiencies, particularly in developing economies, is boosting the demand for fortified dairy products as a convenient and effective solution. Secondly, the increasing adoption of healthier lifestyles and the rising disposable incomes in emerging markets are contributing to higher consumption rates. Furthermore, the innovation of new product formats, such as fortified yogurts, flavored milks, and cheese with added nutrients, is widening the appeal and market reach of these products. Major players like Nestle, BASF, General Mills, and Danone are leveraging their strong distribution networks and brand recognition to capture significant market share.
Fortified Dairy Products Market Size (In Billion)
However, the market's growth trajectory isn't without challenges. Price fluctuations in raw materials, particularly milk, can impact profitability. Furthermore, consumer preference shifts towards plant-based alternatives and concerns regarding added sugars and artificial ingredients present ongoing obstacles. Successful players will need to focus on sustainable sourcing, transparent labeling, and the development of innovative, clean-label fortified products to navigate these challenges effectively and maintain a competitive edge. Regional variations exist, with North America and Europe currently dominating the market, while Asia-Pacific is poised for substantial growth due to increasing urbanization and rising health consciousness. The segmentation of the market includes various product types (milk, yogurt, cheese) and fortification types (vitamins, minerals). Strategic partnerships, acquisitions, and product diversification will be crucial for companies to consolidate their positions and capitalize on future growth opportunities within this dynamic sector.
Fortified Dairy Products Company Market Share
Fortified Dairy Products Market Report: 2019-2033
Dive deep into the dynamic world of fortified dairy products with this comprehensive market analysis, projecting a market value exceeding $XX million by 2033. This in-depth report provides actionable insights for industry stakeholders, covering market dynamics, leading players, emerging trends, and future growth opportunities. The study period spans from 2019 to 2033, with 2025 serving as the base and estimated year. The forecast period encompasses 2025-2033, and the historical period covers 2019-2024.
Fortified Dairy Products Market Dynamics & Concentration
This section analyzes the competitive landscape, innovation drivers, regulatory influences, and market evolution within the fortified dairy sector. The market shows a moderately concentrated structure, with the top five players—Nestlé, Danone, General Mills, Fonterra, and Bright Dairy & Food—holding an estimated XX% combined market share in 2025. This concentration is expected to remain relatively stable through 2033, although aggressive M&A activity could reshape the competitive landscape. Over the historical period (2019-2024), we observed approximately XX M&A deals, primarily focused on expanding product portfolios and geographical reach.
- Market Concentration: High concentration with top players commanding significant market share.
- Innovation Drivers: Growing consumer demand for functional foods and fortified dairy alternatives.
- Regulatory Frameworks: Stringent regulations regarding fortification levels and labeling requirements vary across regions.
- Product Substitutes: Plant-based alternatives and other fortified beverages pose competitive threats.
- End-User Trends: Increasing health consciousness and demand for convenient, nutritious options drive market growth.
- M&A Activity: Strategic acquisitions are reshaping the competitive landscape and driving consolidation.
Fortified Dairy Products Industry Trends & Analysis
The global fortified dairy products market is experiencing robust growth, projected to reach $XX million by 2033, exhibiting a CAGR of XX% during the forecast period (2025-2033). This growth is fueled by several key factors: increasing consumer awareness of nutritional deficiencies, rising disposable incomes in emerging markets, and the proliferation of value-added products. Technological advancements, such as improved fortification techniques and innovative packaging solutions, are further enhancing market penetration. Consumer preferences are shifting towards healthier options, driving demand for products with added vitamins, minerals, and probiotics. The competitive landscape is characterized by intense rivalry, with major players investing heavily in R&D and brand building to gain a market edge. Market penetration of fortified dairy products varies significantly across regions, with developed economies exhibiting higher penetration rates compared to developing countries.
Leading Markets & Segments in Fortified Dairy Products
The Asia-Pacific region dominates the fortified dairy products market, driven by factors including rapid population growth, rising disposable incomes, and increasing health consciousness. China and India are key contributors to this regional dominance, representing a substantial portion of overall market demand. The dairy drinks segment holds the largest market share, followed by yogurt and cheese.
Key Drivers in Asia-Pacific:
- Rapidly growing population and rising middle class
- Increasing awareness of health and nutrition
- Favorable government policies promoting dairy consumption.
- Investments in dairy infrastructure and processing capabilities.
Dominance Analysis: The region's large population base, coupled with increasing health awareness and purchasing power, fuels exceptional growth within the fortified dairy market. Government initiatives further bolster market expansion by promoting dairy consumption and improving production infrastructure.
Fortified Dairy Products Product Developments
Recent product innovations focus on enhancing nutritional profiles, improving taste and texture, and extending shelf life. Fortified dairy products are incorporating a wider range of vitamins, minerals, and probiotics, catering to specific dietary needs and health goals. Technological advancements in microencapsulation and delivery systems ensure optimal nutrient stability and bioavailability. The market is witnessing the emergence of organic and plant-based fortified options, responding to evolving consumer preferences and health trends.
Key Drivers of Fortified Dairy Products Growth
Several factors contribute to the sustained growth of the fortified dairy products market:
- Technological advancements: Improved fortification techniques and innovative packaging.
- Economic factors: Rising disposable incomes and increased consumer spending power.
- Regulatory support: Government initiatives promoting dairy consumption and nutrition.
Challenges in the Fortified Dairy Products Market
The fortified dairy market faces several challenges, including:
- Stringent regulations: Compliance with varying regulations across different regions poses challenges.
- Supply chain disruptions: Fluctuations in raw material prices and logistical bottlenecks impact profitability.
- Intense competition: Intense competition among established players and emerging brands exerts pressure on profit margins. The estimated impact of these challenges on market growth is approximately XX%.
Emerging Opportunities in Fortified Dairy Products
Long-term growth opportunities lie in several areas, including expanding into underpenetrated markets, leveraging technological advancements to create innovative products, and forging strategic partnerships to enhance distribution channels. Furthermore, focusing on personalized nutrition and developing specialized fortified products tailored to specific demographics and health needs will unlock significant growth potential.
Leading Players in the Fortified Dairy Products Sector
- Nestlé
- BASF
- General Mills
- Danone
- Bright Dairy & Food
- China Modern Dairy
- Arla
- GCMMF
- Dean Foods
- Fonterra
Key Milestones in Fortified Dairy Products Industry
- 2020: Introduction of a new vitamin D-fortified milk by Nestlé.
- 2021: General Mills launches a line of protein-enriched yogurts.
- 2022: Danone acquires a smaller fortified dairy company, expanding its product portfolio.
- 2023: New regulations on fortification levels implemented in several European countries.
Strategic Outlook for Fortified Dairy Products Market
The fortified dairy products market is poised for substantial growth over the next decade. Strategic opportunities exist in developing innovative products targeting niche segments, expanding into emerging markets, and capitalizing on technological advancements to improve efficiency and sustainability. A focus on personalized nutrition and functional foods will further drive growth. The market's future hinges on adapting to evolving consumer preferences, navigating regulatory complexities, and maintaining a competitive edge through innovation and strategic partnerships.
Fortified Dairy Products Segmentation
-
1. Application
- 1.1. Commercial
- 1.2. Household
- 1.3. Others
-
2. Type
- 2.1. Milk
- 2.2. Milk Powder and Formula
- 2.3. Flavored Milk
- 2.4. Cheese
- 2.5. Dairy Based Yogurt
- 2.6. Others
Fortified Dairy Products Segmentation By Geography
-
1. North America
- 1.1. United States
- 1.2. Canada
- 1.3. Mexico
-
2. South America
- 2.1. Brazil
- 2.2. Argentina
- 2.3. Rest of South America
-
3. Europe
- 3.1. United Kingdom
- 3.2. Germany
- 3.3. France
- 3.4. Italy
- 3.5. Spain
- 3.6. Russia
- 3.7. Benelux
- 3.8. Nordics
- 3.9. Rest of Europe
-
4. Middle East & Africa
- 4.1. Turkey
- 4.2. Israel
- 4.3. GCC
- 4.4. North Africa
- 4.5. South Africa
- 4.6. Rest of Middle East & Africa
-
5. Asia Pacific
- 5.1. China
- 5.2. India
- 5.3. Japan
- 5.4. South Korea
- 5.5. ASEAN
- 5.6. Oceania
- 5.7. Rest of Asia Pacific

Fortified Dairy Products Regional Market Share
Geographic Coverage of Fortified Dairy Products
Fortified Dairy Products REPORT HIGHLIGHTS
| Aspects | Details |
|---|---|
| Study Period | 2020-2034 |
| Base Year | 2025 |
| Estimated Year | 2026 |
| Forecast Period | 2026-2034 |
| Historical Period | 2020-2025 |
| Growth Rate | CAGR of 5.9% from 2020-2034 |
| Segmentation |
|
Table of Contents
- 1. Introduction
- 1.1. Research Scope
- 1.2. Market Segmentation
- 1.3. Research Methodology
- 1.4. Definitions and Assumptions
- 2. Executive Summary
- 2.1. Introduction
- 3. Market Dynamics
- 3.1. Introduction
- 3.2. Market Drivers
- 3.3. Market Restrains
- 3.4. Market Trends
- 4. Market Factor Analysis
- 4.1. Porters Five Forces
- 4.2. Supply/Value Chain
- 4.3. PESTEL analysis
- 4.4. Market Entropy
- 4.5. Patent/Trademark Analysis
- 5. Global Fortified Dairy Products Analysis, Insights and Forecast, 2020-2032
- 5.1. Market Analysis, Insights and Forecast - by Application
- 5.1.1. Commercial
- 5.1.2. Household
- 5.1.3. Others
- 5.2. Market Analysis, Insights and Forecast - by Type
- 5.2.1. Milk
- 5.2.2. Milk Powder and Formula
- 5.2.3. Flavored Milk
- 5.2.4. Cheese
- 5.2.5. Dairy Based Yogurt
- 5.2.6. Others
- 5.3. Market Analysis, Insights and Forecast - by Region
- 5.3.1. North America
- 5.3.2. South America
- 5.3.3. Europe
- 5.3.4. Middle East & Africa
- 5.3.5. Asia Pacific
- 5.1. Market Analysis, Insights and Forecast - by Application
- 6. North America Fortified Dairy Products Analysis, Insights and Forecast, 2020-2032
- 6.1. Market Analysis, Insights and Forecast - by Application
- 6.1.1. Commercial
- 6.1.2. Household
- 6.1.3. Others
- 6.2. Market Analysis, Insights and Forecast - by Type
- 6.2.1. Milk
- 6.2.2. Milk Powder and Formula
- 6.2.3. Flavored Milk
- 6.2.4. Cheese
- 6.2.5. Dairy Based Yogurt
- 6.2.6. Others
- 6.1. Market Analysis, Insights and Forecast - by Application
- 7. South America Fortified Dairy Products Analysis, Insights and Forecast, 2020-2032
- 7.1. Market Analysis, Insights and Forecast - by Application
- 7.1.1. Commercial
- 7.1.2. Household
- 7.1.3. Others
- 7.2. Market Analysis, Insights and Forecast - by Type
- 7.2.1. Milk
- 7.2.2. Milk Powder and Formula
- 7.2.3. Flavored Milk
- 7.2.4. Cheese
- 7.2.5. Dairy Based Yogurt
- 7.2.6. Others
- 7.1. Market Analysis, Insights and Forecast - by Application
- 8. Europe Fortified Dairy Products Analysis, Insights and Forecast, 2020-2032
- 8.1. Market Analysis, Insights and Forecast - by Application
- 8.1.1. Commercial
- 8.1.2. Household
- 8.1.3. Others
- 8.2. Market Analysis, Insights and Forecast - by Type
- 8.2.1. Milk
- 8.2.2. Milk Powder and Formula
- 8.2.3. Flavored Milk
- 8.2.4. Cheese
- 8.2.5. Dairy Based Yogurt
- 8.2.6. Others
- 8.1. Market Analysis, Insights and Forecast - by Application
- 9. Middle East & Africa Fortified Dairy Products Analysis, Insights and Forecast, 2020-2032
- 9.1. Market Analysis, Insights and Forecast - by Application
- 9.1.1. Commercial
- 9.1.2. Household
- 9.1.3. Others
- 9.2. Market Analysis, Insights and Forecast - by Type
- 9.2.1. Milk
- 9.2.2. Milk Powder and Formula
- 9.2.3. Flavored Milk
- 9.2.4. Cheese
- 9.2.5. Dairy Based Yogurt
- 9.2.6. Others
- 9.1. Market Analysis, Insights and Forecast - by Application
- 10. Asia Pacific Fortified Dairy Products Analysis, Insights and Forecast, 2020-2032
- 10.1. Market Analysis, Insights and Forecast - by Application
- 10.1.1. Commercial
- 10.1.2. Household
- 10.1.3. Others
- 10.2. Market Analysis, Insights and Forecast - by Type
- 10.2.1. Milk
- 10.2.2. Milk Powder and Formula
- 10.2.3. Flavored Milk
- 10.2.4. Cheese
- 10.2.5. Dairy Based Yogurt
- 10.2.6. Others
- 10.1. Market Analysis, Insights and Forecast - by Application
- 11. Competitive Analysis
- 11.1. Global Market Share Analysis 2025
- 11.2. Company Profiles
- 11.2.1 Nestle
- 11.2.1.1. Overview
- 11.2.1.2. Products
- 11.2.1.3. SWOT Analysis
- 11.2.1.4. Recent Developments
- 11.2.1.5. Financials (Based on Availability)
- 11.2.2 BASF
- 11.2.2.1. Overview
- 11.2.2.2. Products
- 11.2.2.3. SWOT Analysis
- 11.2.2.4. Recent Developments
- 11.2.2.5. Financials (Based on Availability)
- 11.2.3 General Mills
- 11.2.3.1. Overview
- 11.2.3.2. Products
- 11.2.3.3. SWOT Analysis
- 11.2.3.4. Recent Developments
- 11.2.3.5. Financials (Based on Availability)
- 11.2.4 Danone
- 11.2.4.1. Overview
- 11.2.4.2. Products
- 11.2.4.3. SWOT Analysis
- 11.2.4.4. Recent Developments
- 11.2.4.5. Financials (Based on Availability)
- 11.2.5 Bright Dairy & Food
- 11.2.5.1. Overview
- 11.2.5.2. Products
- 11.2.5.3. SWOT Analysis
- 11.2.5.4. Recent Developments
- 11.2.5.5. Financials (Based on Availability)
- 11.2.6 China Modern Dairy
- 11.2.6.1. Overview
- 11.2.6.2. Products
- 11.2.6.3. SWOT Analysis
- 11.2.6.4. Recent Developments
- 11.2.6.5. Financials (Based on Availability)
- 11.2.7 Arla
- 11.2.7.1. Overview
- 11.2.7.2. Products
- 11.2.7.3. SWOT Analysis
- 11.2.7.4. Recent Developments
- 11.2.7.5. Financials (Based on Availability)
- 11.2.8 GCMMF
- 11.2.8.1. Overview
- 11.2.8.2. Products
- 11.2.8.3. SWOT Analysis
- 11.2.8.4. Recent Developments
- 11.2.8.5. Financials (Based on Availability)
- 11.2.9 Dean Foods
- 11.2.9.1. Overview
- 11.2.9.2. Products
- 11.2.9.3. SWOT Analysis
- 11.2.9.4. Recent Developments
- 11.2.9.5. Financials (Based on Availability)
- 11.2.10 Fonterra
- 11.2.10.1. Overview
- 11.2.10.2. Products
- 11.2.10.3. SWOT Analysis
- 11.2.10.4. Recent Developments
- 11.2.10.5. Financials (Based on Availability)
- 11.2.1 Nestle
List of Figures
- Figure 1: Global Fortified Dairy Products Revenue Breakdown (undefined, %) by Region 2025 & 2033
- Figure 2: Global Fortified Dairy Products Volume Breakdown (K, %) by Region 2025 & 2033
- Figure 3: North America Fortified Dairy Products Revenue (undefined), by Application 2025 & 2033
- Figure 4: North America Fortified Dairy Products Volume (K), by Application 2025 & 2033
- Figure 5: North America Fortified Dairy Products Revenue Share (%), by Application 2025 & 2033
- Figure 6: North America Fortified Dairy Products Volume Share (%), by Application 2025 & 2033
- Figure 7: North America Fortified Dairy Products Revenue (undefined), by Type 2025 & 2033
- Figure 8: North America Fortified Dairy Products Volume (K), by Type 2025 & 2033
- Figure 9: North America Fortified Dairy Products Revenue Share (%), by Type 2025 & 2033
- Figure 10: North America Fortified Dairy Products Volume Share (%), by Type 2025 & 2033
- Figure 11: North America Fortified Dairy Products Revenue (undefined), by Country 2025 & 2033
- Figure 12: North America Fortified Dairy Products Volume (K), by Country 2025 & 2033
- Figure 13: North America Fortified Dairy Products Revenue Share (%), by Country 2025 & 2033
- Figure 14: North America Fortified Dairy Products Volume Share (%), by Country 2025 & 2033
- Figure 15: South America Fortified Dairy Products Revenue (undefined), by Application 2025 & 2033
- Figure 16: South America Fortified Dairy Products Volume (K), by Application 2025 & 2033
- Figure 17: South America Fortified Dairy Products Revenue Share (%), by Application 2025 & 2033
- Figure 18: South America Fortified Dairy Products Volume Share (%), by Application 2025 & 2033
- Figure 19: South America Fortified Dairy Products Revenue (undefined), by Type 2025 & 2033
- Figure 20: South America Fortified Dairy Products Volume (K), by Type 2025 & 2033
- Figure 21: South America Fortified Dairy Products Revenue Share (%), by Type 2025 & 2033
- Figure 22: South America Fortified Dairy Products Volume Share (%), by Type 2025 & 2033
- Figure 23: South America Fortified Dairy Products Revenue (undefined), by Country 2025 & 2033
- Figure 24: South America Fortified Dairy Products Volume (K), by Country 2025 & 2033
- Figure 25: South America Fortified Dairy Products Revenue Share (%), by Country 2025 & 2033
- Figure 26: South America Fortified Dairy Products Volume Share (%), by Country 2025 & 2033
- Figure 27: Europe Fortified Dairy Products Revenue (undefined), by Application 2025 & 2033
- Figure 28: Europe Fortified Dairy Products Volume (K), by Application 2025 & 2033
- Figure 29: Europe Fortified Dairy Products Revenue Share (%), by Application 2025 & 2033
- Figure 30: Europe Fortified Dairy Products Volume Share (%), by Application 2025 & 2033
- Figure 31: Europe Fortified Dairy Products Revenue (undefined), by Type 2025 & 2033
- Figure 32: Europe Fortified Dairy Products Volume (K), by Type 2025 & 2033
- Figure 33: Europe Fortified Dairy Products Revenue Share (%), by Type 2025 & 2033
- Figure 34: Europe Fortified Dairy Products Volume Share (%), by Type 2025 & 2033
- Figure 35: Europe Fortified Dairy Products Revenue (undefined), by Country 2025 & 2033
- Figure 36: Europe Fortified Dairy Products Volume (K), by Country 2025 & 2033
- Figure 37: Europe Fortified Dairy Products Revenue Share (%), by Country 2025 & 2033
- Figure 38: Europe Fortified Dairy Products Volume Share (%), by Country 2025 & 2033
- Figure 39: Middle East & Africa Fortified Dairy Products Revenue (undefined), by Application 2025 & 2033
- Figure 40: Middle East & Africa Fortified Dairy Products Volume (K), by Application 2025 & 2033
- Figure 41: Middle East & Africa Fortified Dairy Products Revenue Share (%), by Application 2025 & 2033
- Figure 42: Middle East & Africa Fortified Dairy Products Volume Share (%), by Application 2025 & 2033
- Figure 43: Middle East & Africa Fortified Dairy Products Revenue (undefined), by Type 2025 & 2033
- Figure 44: Middle East & Africa Fortified Dairy Products Volume (K), by Type 2025 & 2033
- Figure 45: Middle East & Africa Fortified Dairy Products Revenue Share (%), by Type 2025 & 2033
- Figure 46: Middle East & Africa Fortified Dairy Products Volume Share (%), by Type 2025 & 2033
- Figure 47: Middle East & Africa Fortified Dairy Products Revenue (undefined), by Country 2025 & 2033
- Figure 48: Middle East & Africa Fortified Dairy Products Volume (K), by Country 2025 & 2033
- Figure 49: Middle East & Africa Fortified Dairy Products Revenue Share (%), by Country 2025 & 2033
- Figure 50: Middle East & Africa Fortified Dairy Products Volume Share (%), by Country 2025 & 2033
- Figure 51: Asia Pacific Fortified Dairy Products Revenue (undefined), by Application 2025 & 2033
- Figure 52: Asia Pacific Fortified Dairy Products Volume (K), by Application 2025 & 2033
- Figure 53: Asia Pacific Fortified Dairy Products Revenue Share (%), by Application 2025 & 2033
- Figure 54: Asia Pacific Fortified Dairy Products Volume Share (%), by Application 2025 & 2033
- Figure 55: Asia Pacific Fortified Dairy Products Revenue (undefined), by Type 2025 & 2033
- Figure 56: Asia Pacific Fortified Dairy Products Volume (K), by Type 2025 & 2033
- Figure 57: Asia Pacific Fortified Dairy Products Revenue Share (%), by Type 2025 & 2033
- Figure 58: Asia Pacific Fortified Dairy Products Volume Share (%), by Type 2025 & 2033
- Figure 59: Asia Pacific Fortified Dairy Products Revenue (undefined), by Country 2025 & 2033
- Figure 60: Asia Pacific Fortified Dairy Products Volume (K), by Country 2025 & 2033
- Figure 61: Asia Pacific Fortified Dairy Products Revenue Share (%), by Country 2025 & 2033
- Figure 62: Asia Pacific Fortified Dairy Products Volume Share (%), by Country 2025 & 2033
List of Tables
- Table 1: Global Fortified Dairy Products Revenue undefined Forecast, by Application 2020 & 2033
- Table 2: Global Fortified Dairy Products Volume K Forecast, by Application 2020 & 2033
- Table 3: Global Fortified Dairy Products Revenue undefined Forecast, by Type 2020 & 2033
- Table 4: Global Fortified Dairy Products Volume K Forecast, by Type 2020 & 2033
- Table 5: Global Fortified Dairy Products Revenue undefined Forecast, by Region 2020 & 2033
- Table 6: Global Fortified Dairy Products Volume K Forecast, by Region 2020 & 2033
- Table 7: Global Fortified Dairy Products Revenue undefined Forecast, by Application 2020 & 2033
- Table 8: Global Fortified Dairy Products Volume K Forecast, by Application 2020 & 2033
- Table 9: Global Fortified Dairy Products Revenue undefined Forecast, by Type 2020 & 2033
- Table 10: Global Fortified Dairy Products Volume K Forecast, by Type 2020 & 2033
- Table 11: Global Fortified Dairy Products Revenue undefined Forecast, by Country 2020 & 2033
- Table 12: Global Fortified Dairy Products Volume K Forecast, by Country 2020 & 2033
- Table 13: United States Fortified Dairy Products Revenue (undefined) Forecast, by Application 2020 & 2033
- Table 14: United States Fortified Dairy Products Volume (K) Forecast, by Application 2020 & 2033
- Table 15: Canada Fortified Dairy Products Revenue (undefined) Forecast, by Application 2020 & 2033
- Table 16: Canada Fortified Dairy Products Volume (K) Forecast, by Application 2020 & 2033
- Table 17: Mexico Fortified Dairy Products Revenue (undefined) Forecast, by Application 2020 & 2033
- Table 18: Mexico Fortified Dairy Products Volume (K) Forecast, by Application 2020 & 2033
- Table 19: Global Fortified Dairy Products Revenue undefined Forecast, by Application 2020 & 2033
- Table 20: Global Fortified Dairy Products Volume K Forecast, by Application 2020 & 2033
- Table 21: Global Fortified Dairy Products Revenue undefined Forecast, by Type 2020 & 2033
- Table 22: Global Fortified Dairy Products Volume K Forecast, by Type 2020 & 2033
- Table 23: Global Fortified Dairy Products Revenue undefined Forecast, by Country 2020 & 2033
- Table 24: Global Fortified Dairy Products Volume K Forecast, by Country 2020 & 2033
- Table 25: Brazil Fortified Dairy Products Revenue (undefined) Forecast, by Application 2020 & 2033
- Table 26: Brazil Fortified Dairy Products Volume (K) Forecast, by Application 2020 & 2033
- Table 27: Argentina Fortified Dairy Products Revenue (undefined) Forecast, by Application 2020 & 2033
- Table 28: Argentina Fortified Dairy Products Volume (K) Forecast, by Application 2020 & 2033
- Table 29: Rest of South America Fortified Dairy Products Revenue (undefined) Forecast, by Application 2020 & 2033
- Table 30: Rest of South America Fortified Dairy Products Volume (K) Forecast, by Application 2020 & 2033
- Table 31: Global Fortified Dairy Products Revenue undefined Forecast, by Application 2020 & 2033
- Table 32: Global Fortified Dairy Products Volume K Forecast, by Application 2020 & 2033
- Table 33: Global Fortified Dairy Products Revenue undefined Forecast, by Type 2020 & 2033
- Table 34: Global Fortified Dairy Products Volume K Forecast, by Type 2020 & 2033
- Table 35: Global Fortified Dairy Products Revenue undefined Forecast, by Country 2020 & 2033
- Table 36: Global Fortified Dairy Products Volume K Forecast, by Country 2020 & 2033
- Table 37: United Kingdom Fortified Dairy Products Revenue (undefined) Forecast, by Application 2020 & 2033
- Table 38: United Kingdom Fortified Dairy Products Volume (K) Forecast, by Application 2020 & 2033
- Table 39: Germany Fortified Dairy Products Revenue (undefined) Forecast, by Application 2020 & 2033
- Table 40: Germany Fortified Dairy Products Volume (K) Forecast, by Application 2020 & 2033
- Table 41: France Fortified Dairy Products Revenue (undefined) Forecast, by Application 2020 & 2033
- Table 42: France Fortified Dairy Products Volume (K) Forecast, by Application 2020 & 2033
- Table 43: Italy Fortified Dairy Products Revenue (undefined) Forecast, by Application 2020 & 2033
- Table 44: Italy Fortified Dairy Products Volume (K) Forecast, by Application 2020 & 2033
- Table 45: Spain Fortified Dairy Products Revenue (undefined) Forecast, by Application 2020 & 2033
- Table 46: Spain Fortified Dairy Products Volume (K) Forecast, by Application 2020 & 2033
- Table 47: Russia Fortified Dairy Products Revenue (undefined) Forecast, by Application 2020 & 2033
- Table 48: Russia Fortified Dairy Products Volume (K) Forecast, by Application 2020 & 2033
- Table 49: Benelux Fortified Dairy Products Revenue (undefined) Forecast, by Application 2020 & 2033
- Table 50: Benelux Fortified Dairy Products Volume (K) Forecast, by Application 2020 & 2033
- Table 51: Nordics Fortified Dairy Products Revenue (undefined) Forecast, by Application 2020 & 2033
- Table 52: Nordics Fortified Dairy Products Volume (K) Forecast, by Application 2020 & 2033
- Table 53: Rest of Europe Fortified Dairy Products Revenue (undefined) Forecast, by Application 2020 & 2033
- Table 54: Rest of Europe Fortified Dairy Products Volume (K) Forecast, by Application 2020 & 2033
- Table 55: Global Fortified Dairy Products Revenue undefined Forecast, by Application 2020 & 2033
- Table 56: Global Fortified Dairy Products Volume K Forecast, by Application 2020 & 2033
- Table 57: Global Fortified Dairy Products Revenue undefined Forecast, by Type 2020 & 2033
- Table 58: Global Fortified Dairy Products Volume K Forecast, by Type 2020 & 2033
- Table 59: Global Fortified Dairy Products Revenue undefined Forecast, by Country 2020 & 2033
- Table 60: Global Fortified Dairy Products Volume K Forecast, by Country 2020 & 2033
- Table 61: Turkey Fortified Dairy Products Revenue (undefined) Forecast, by Application 2020 & 2033
- Table 62: Turkey Fortified Dairy Products Volume (K) Forecast, by Application 2020 & 2033
- Table 63: Israel Fortified Dairy Products Revenue (undefined) Forecast, by Application 2020 & 2033
- Table 64: Israel Fortified Dairy Products Volume (K) Forecast, by Application 2020 & 2033
- Table 65: GCC Fortified Dairy Products Revenue (undefined) Forecast, by Application 2020 & 2033
- Table 66: GCC Fortified Dairy Products Volume (K) Forecast, by Application 2020 & 2033
- Table 67: North Africa Fortified Dairy Products Revenue (undefined) Forecast, by Application 2020 & 2033
- Table 68: North Africa Fortified Dairy Products Volume (K) Forecast, by Application 2020 & 2033
- Table 69: South Africa Fortified Dairy Products Revenue (undefined) Forecast, by Application 2020 & 2033
- Table 70: South Africa Fortified Dairy Products Volume (K) Forecast, by Application 2020 & 2033
- Table 71: Rest of Middle East & Africa Fortified Dairy Products Revenue (undefined) Forecast, by Application 2020 & 2033
- Table 72: Rest of Middle East & Africa Fortified Dairy Products Volume (K) Forecast, by Application 2020 & 2033
- Table 73: Global Fortified Dairy Products Revenue undefined Forecast, by Application 2020 & 2033
- Table 74: Global Fortified Dairy Products Volume K Forecast, by Application 2020 & 2033
- Table 75: Global Fortified Dairy Products Revenue undefined Forecast, by Type 2020 & 2033
- Table 76: Global Fortified Dairy Products Volume K Forecast, by Type 2020 & 2033
- Table 77: Global Fortified Dairy Products Revenue undefined Forecast, by Country 2020 & 2033
- Table 78: Global Fortified Dairy Products Volume K Forecast, by Country 2020 & 2033
- Table 79: China Fortified Dairy Products Revenue (undefined) Forecast, by Application 2020 & 2033
- Table 80: China Fortified Dairy Products Volume (K) Forecast, by Application 2020 & 2033
- Table 81: India Fortified Dairy Products Revenue (undefined) Forecast, by Application 2020 & 2033
- Table 82: India Fortified Dairy Products Volume (K) Forecast, by Application 2020 & 2033
- Table 83: Japan Fortified Dairy Products Revenue (undefined) Forecast, by Application 2020 & 2033
- Table 84: Japan Fortified Dairy Products Volume (K) Forecast, by Application 2020 & 2033
- Table 85: South Korea Fortified Dairy Products Revenue (undefined) Forecast, by Application 2020 & 2033
- Table 86: South Korea Fortified Dairy Products Volume (K) Forecast, by Application 2020 & 2033
- Table 87: ASEAN Fortified Dairy Products Revenue (undefined) Forecast, by Application 2020 & 2033
- Table 88: ASEAN Fortified Dairy Products Volume (K) Forecast, by Application 2020 & 2033
- Table 89: Oceania Fortified Dairy Products Revenue (undefined) Forecast, by Application 2020 & 2033
- Table 90: Oceania Fortified Dairy Products Volume (K) Forecast, by Application 2020 & 2033
- Table 91: Rest of Asia Pacific Fortified Dairy Products Revenue (undefined) Forecast, by Application 2020 & 2033
- Table 92: Rest of Asia Pacific Fortified Dairy Products Volume (K) Forecast, by Application 2020 & 2033
Frequently Asked Questions
1. What is the projected Compound Annual Growth Rate (CAGR) of the Fortified Dairy Products?
The projected CAGR is approximately 5.9%.
2. Which companies are prominent players in the Fortified Dairy Products?
Key companies in the market include Nestle, BASF, General Mills, Danone, Bright Dairy & Food, China Modern Dairy, Arla, GCMMF, Dean Foods, Fonterra.
3. What are the main segments of the Fortified Dairy Products?
The market segments include Application, Type.
4. Can you provide details about the market size?
The market size is estimated to be USD XXX N/A as of 2022.
5. What are some drivers contributing to market growth?
N/A
6. What are the notable trends driving market growth?
N/A
7. Are there any restraints impacting market growth?
N/A
8. Can you provide examples of recent developments in the market?
N/A
9. What pricing options are available for accessing the report?
Pricing options include single-user, multi-user, and enterprise licenses priced at USD 3950.00, USD 5925.00, and USD 7900.00 respectively.
10. Is the market size provided in terms of value or volume?
The market size is provided in terms of value, measured in N/A and volume, measured in K.
11. Are there any specific market keywords associated with the report?
Yes, the market keyword associated with the report is "Fortified Dairy Products," which aids in identifying and referencing the specific market segment covered.
12. How do I determine which pricing option suits my needs best?
The pricing options vary based on user requirements and access needs. Individual users may opt for single-user licenses, while businesses requiring broader access may choose multi-user or enterprise licenses for cost-effective access to the report.
13. Are there any additional resources or data provided in the Fortified Dairy Products report?
While the report offers comprehensive insights, it's advisable to review the specific contents or supplementary materials provided to ascertain if additional resources or data are available.
14. How can I stay updated on further developments or reports in the Fortified Dairy Products?
To stay informed about further developments, trends, and reports in the Fortified Dairy Products, consider subscribing to industry newsletters, following relevant companies and organizations, or regularly checking reputable industry news sources and publications.
Methodology
Step 1 - Identification of Relevant Samples Size from Population Database


Step 2 - Approaches for Defining Global Market Size (Value, Volume* & Price*)

Note*: In applicable scenarios
Step 3 - Data Sources
Primary Research
- Web Analytics
- Survey Reports
- Research Institute
- Latest Research Reports
- Opinion Leaders
Secondary Research
- Annual Reports
- White Paper
- Latest Press Release
- Industry Association
- Paid Database
- Investor Presentations

Step 4 - Data Triangulation
Involves using different sources of information in order to increase the validity of a study
These sources are likely to be stakeholders in a program - participants, other researchers, program staff, other community members, and so on.
Then we put all data in single framework & apply various statistical tools to find out the dynamic on the market.
During the analysis stage, feedback from the stakeholder groups would be compared to determine areas of agreement as well as areas of divergence