

Key Insights
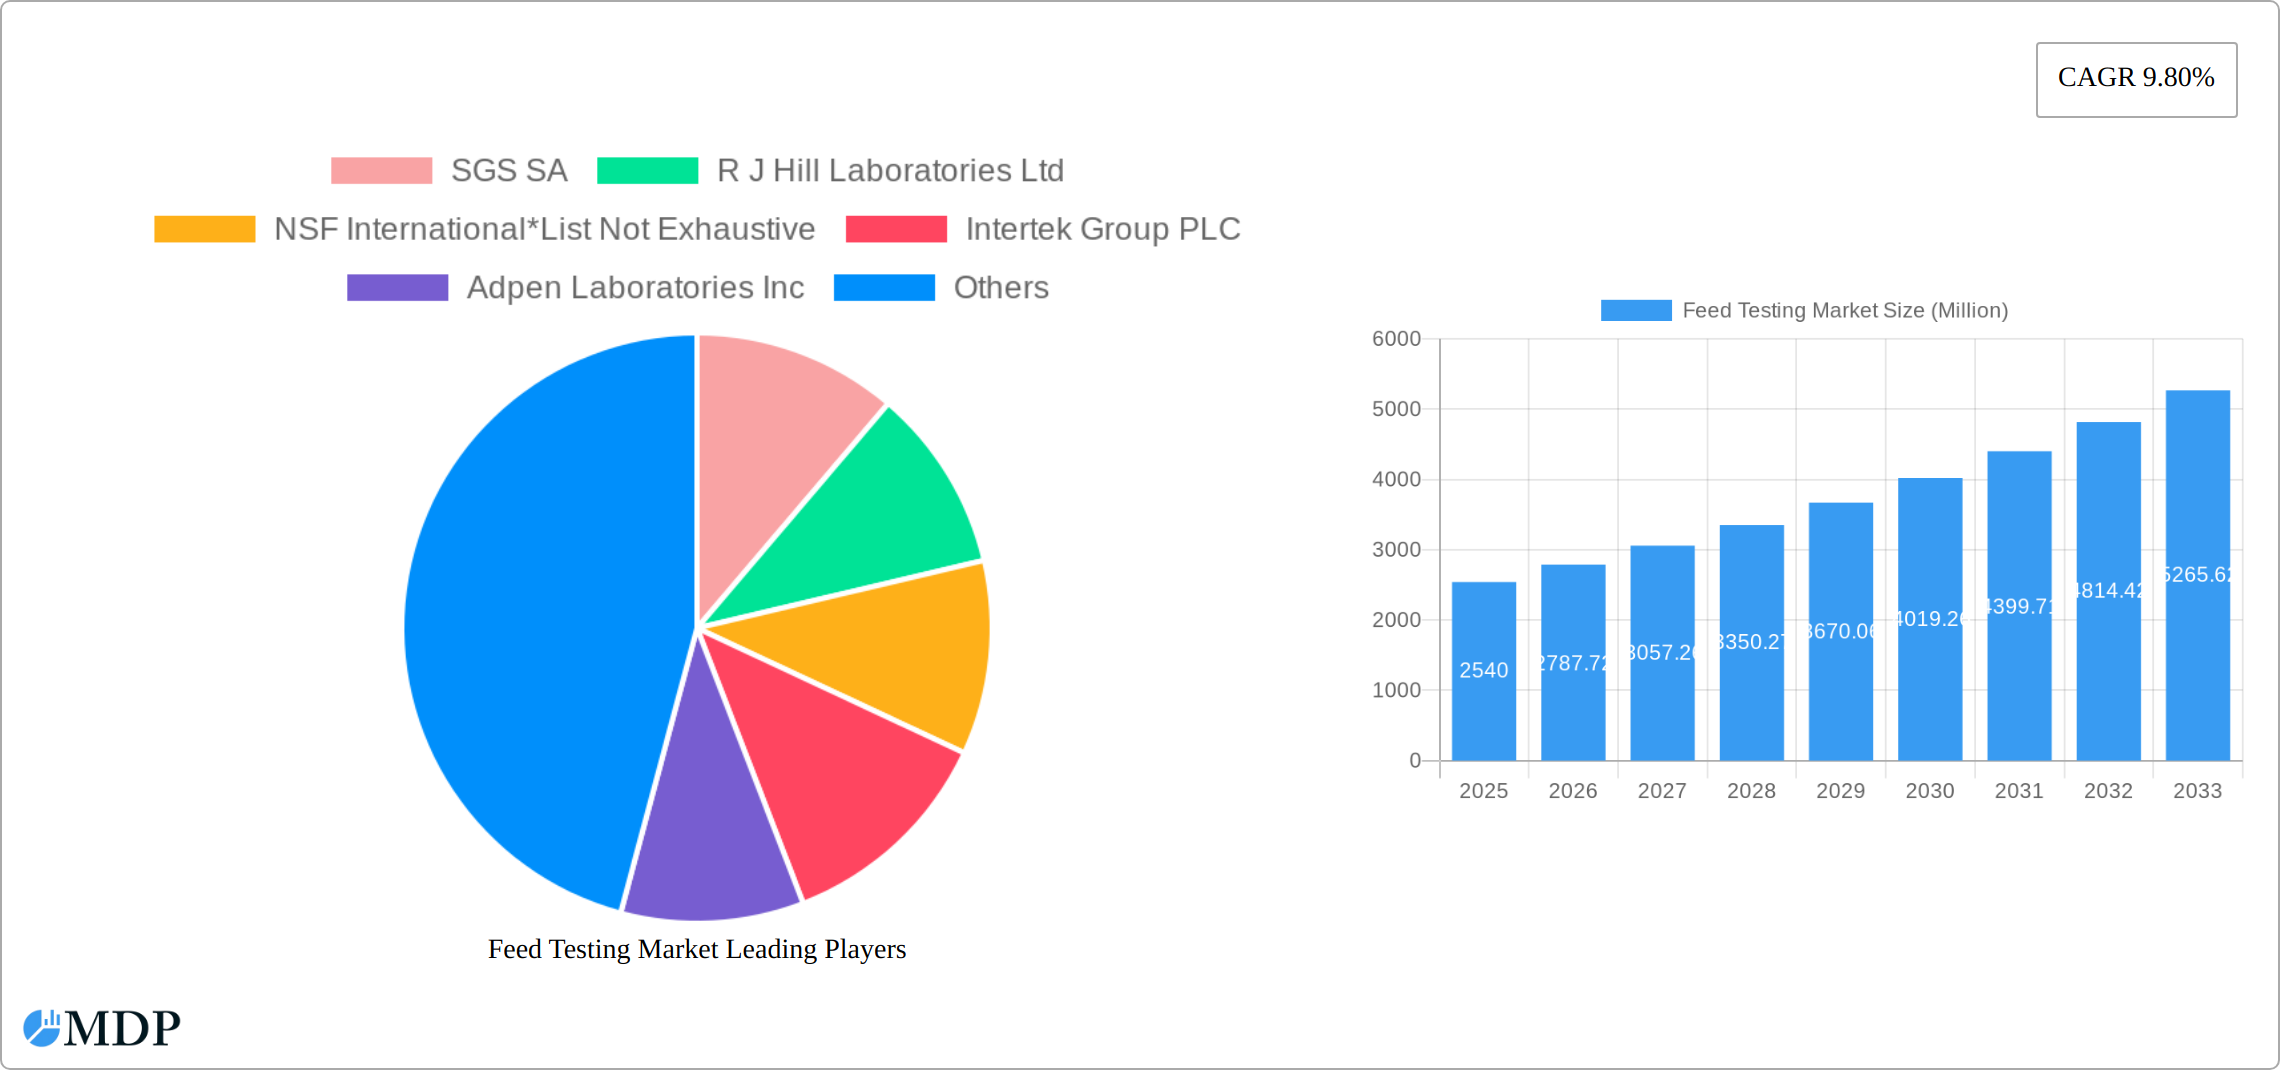
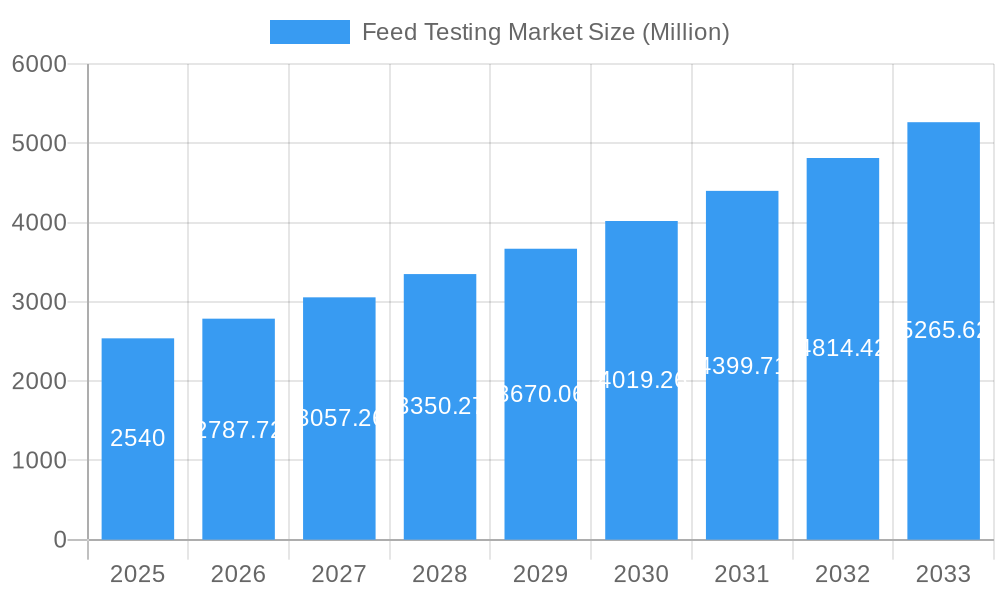
The global feed testing market, valued at $2.54 billion in 2025, is projected to experience robust growth, exhibiting a compound annual growth rate (CAGR) of 9.80% from 2025 to 2033. This expansion is driven by several key factors. Increasing consumer demand for safe and high-quality animal products fuels the need for stringent feed quality control. Government regulations mandating rigorous testing procedures for various contaminants, such as pathogens, pesticides, and mycotoxins, further contribute to market growth. Advancements in testing technologies, offering faster, more accurate, and cost-effective analyses, are also propelling market expansion. The growing aquaculture and pet food industries, requiring specialized feed testing solutions, represent significant growth opportunities. The market is segmented by testing type (pathogen testing, pesticide residue analysis, nutritional labeling analysis, fats and oils analysis, mycotoxin testing, and others) and feed type (ruminant feed, poultry feed, swine feed, aquaculture feed, and pet food). North America and Europe currently hold significant market share, but the Asia-Pacific region is poised for rapid growth due to expanding livestock production and rising consumer awareness.
Feed Testing Market Market Size (In Billion)
Competition in the feed testing market is intense, with major players like SGS SA, R J Hill Laboratories Ltd, NSF International, Intertek Group PLC, and Eurofins Scientific vying for market share. These companies are actively investing in research and development to enhance their testing capabilities and expand their service offerings. The market is also witnessing the emergence of smaller, specialized testing laboratories focusing on niche segments like mycotoxin testing or specific feed types. Future growth will likely depend on factors such as technological innovations, regulatory changes, and the increasing adoption of advanced analytical techniques like PCR and mass spectrometry. The demand for comprehensive and reliable feed testing services will continue to rise, making it a lucrative market for companies offering cutting-edge solutions and expertise.
Feed Testing Market Company Market Share
Feed Testing Market: A Comprehensive Report (2019-2033)
This comprehensive report provides an in-depth analysis of the global Feed Testing Market, offering actionable insights for stakeholders across the value chain. From market dynamics and leading players to emerging opportunities and future projections, this report is your definitive guide to navigating the complexities of this crucial industry. The report covers the period 2019-2033, with a focus on the estimated year 2025 and a forecast period spanning 2025-2033. The market size is projected to reach xx Million by 2033, exhibiting a CAGR of xx% during the forecast period.
Feed Testing Market Market Dynamics & Concentration
The Feed Testing market is characterized by a moderately concentrated landscape, with several large multinational players and a number of smaller, specialized firms competing for market share. Key players like SGS SA, Intertek Group PLC, Eurofins Scientific, and NSF International hold significant market share, benefiting from their established global presence and diverse service portfolios. However, the market also features numerous regional and niche players focusing on specific feed types or testing methodologies.
Market concentration is influenced by factors such as the capital intensity of establishing advanced testing facilities, stringent regulatory requirements, and the need for specialized expertise. Consolidation through mergers and acquisitions (M&A) is a notable trend, with an estimated xx M&A deals concluded in the historical period (2019-2024). This activity reflects the industry's push for economies of scale, expanded service offerings, and enhanced geographical reach. The average deal size is estimated to be around xx Million. Innovation is another key driver, with ongoing developments in molecular biology, analytical chemistry, and data analytics leading to more accurate, rapid, and cost-effective testing methods.
- Market Share: Top 5 players hold an estimated xx% market share.
- M&A Activity: An average of xx M&A deals per year were observed during 2019-2024.
- Regulatory Landscape: Stringent regulations governing food safety and animal feed quality drive demand for testing services.
- Product Substitutes: Limited direct substitutes exist, but cost pressures may lead to adoption of simpler, less accurate methods in some segments.
- End-User Trends: Increasing focus on animal health, food safety, and traceability fuels demand for comprehensive feed testing.
Feed Testing Market Industry Trends & Analysis
The Feed Testing market is experiencing robust growth, fueled by a confluence of factors. Heightened consumer awareness of food safety and animal welfare is a primary driver, prompting stricter regulatory frameworks and a surge in demand for rigorous quality control. Advancements in technologies like genomics and proteomics are enabling faster and more sophisticated testing methods, enhancing accuracy, reducing turnaround times, and ultimately lowering costs. This is further amplified by the global movement towards sustainable and traceable food systems, where producers prioritize transparency and ethical sourcing.
The increasing incidence of zoonotic diseases and the crucial need for robust biosecurity measures in livestock farming are also key growth catalysts. The expanding pet food market significantly contributes to the demand. Advanced testing technologies such as PCR and ELISA are gaining traction due to their superior sensitivity and specificity compared to traditional methods. The Feed Testing market is projected to experience a compound annual growth rate (CAGR) of xx% during the forecast period (2025-2033). This growth is further fueled by substantial investments in research and development, focused on improving the efficacy and affordability of feed testing technologies. The integration of artificial intelligence (AI) and machine learning (ML) is also expected to revolutionize data analysis and predictive modeling within the industry, optimizing testing strategies and resource allocation.
Leading Markets & Segments in Feed Testing Market
North America and Europe currently dominate the Feed Testing market, driven by stringent regulatory environments, high consumer awareness, and substantial investments in agricultural research. However, the Asia-Pacific region is poised for the most significant growth during the forecast period, fueled by rapid economic expansion, rising disposable incomes, and a surge in demand for animal-based protein sources. This growth is particularly pronounced in developing economies experiencing rapid industrialization of their agricultural sectors.
Dominant Segments:
- By Type: Pathogen testing commands the largest market share, followed by pesticide residue analysis and mycotoxin testing, reflecting the critical need to ensure feed product safety and quality. The increasing focus on antibiotic resistance is also driving growth in specific pathogen testing segments.
- By Feed Type: Poultry feed and ruminant feed are the leading segments due to their large volume and vital role in global food production. The growing aquaculture sector is also creating a significant demand for specialized feed testing services.
Key Drivers by Region:
- North America: Stringent regulatory frameworks, high consumer awareness of food safety, and a well-established infrastructure for testing and analysis.
- Europe: Similar to North America, strong regulations, a consumer focus on food quality, and a robust scientific research base.
- Asia-Pacific: Rapid economic growth, rising meat consumption, increasing demand for quality feed, and a growing middle class with higher disposable incomes.
Feed Testing Market Product Developments
Recent product developments in the feed testing market include the introduction of rapid diagnostic kits, automated testing systems, and advanced analytical platforms incorporating technologies like next-generation sequencing (NGS) and mass spectrometry. These innovations are enhancing the speed, accuracy, and efficiency of testing, leading to reduced turnaround times and improved cost-effectiveness. The development of point-of-care testing devices is also gaining traction, enabling on-site testing and reducing reliance on centralized laboratories. These advancements are shaping the competitive landscape, creating opportunities for companies that can offer faster, more accurate, and convenient testing solutions tailored to specific needs of the diverse feed industry.
Key Drivers of Feed Testing Market Growth
Several key factors are driving expansion in the Feed Testing market:
- Stringent Regulations and Compliance: Increasingly stringent regulations on feed safety and quality globally necessitate comprehensive testing, driving market growth.
- Growing Consumer Awareness and Demand for Transparency: Consumers are increasingly demanding transparency and traceability in their food supply chain, influencing demand for robust feed testing.
- Technological Advancements and Innovation: New technologies such as PCR, ELISA, NGS, and advanced mass spectrometry techniques offer more efficient, sensitive, and high-throughput testing capabilities.
- Rising Demand for Animal Protein and Global Food Security: Global population growth and changing dietary patterns are increasing demand for livestock and aquaculture products, driving the need for ensuring feed safety and quality.
- Proactive Risk Management and Biosecurity: The prevention of disease outbreaks through effective biosecurity measures is becoming increasingly important, stimulating the demand for comprehensive feed testing.
Challenges in the Feed Testing Market Market
The Feed Testing market faces several challenges:
- High Testing Costs: Advanced testing methods can be expensive, particularly for smaller producers.
- Complex Regulatory Landscape: Varying regulations across different regions can create complexities.
- Competition: The market is competitive, with many established and emerging players.
- Supply Chain Disruptions: Global supply chain issues can impact the availability of testing reagents and equipment.
Emerging Opportunities in Feed Testing Market
Significant growth opportunities exist within the Feed Testing market. Advancements in genomic technologies, coupled with AI-driven data analytics platforms, are poised to revolutionize the accuracy and efficiency of feed testing. Strategic collaborations between testing laboratories and feed producers can streamline testing processes and enhance quality control. Expansion into emerging markets with developing livestock production industries presents considerable growth potential for businesses offering comprehensive testing services. The development of rapid, on-site testing kits is also a promising area of growth, enabling faster response times and improving efficiency.
Leading Players in the Feed Testing Market Sector
- SGS SA
- R J Hill Laboratories Ltd
- NSF International
- Intertek Group PLC
- Adpen Laboratories Inc
- Bruker Biosciences Corporation
- Genetic ID NA Inc
- Genon Laboratories Ltd
- Eurofins Scientific
- Invisible Sentinel Inc
Key Milestones in Feed Testing Market Industry
- 2020: Launch of a new rapid mycotoxin testing kit by a leading player.
- 2022: Acquisition of a smaller testing laboratory by a major multinational company.
- 2023: Introduction of an automated pathogen detection system.
- 2024: Development of a new point-of-care testing device for pesticide residue analysis.
Strategic Outlook for Feed Testing Market Market
The Feed Testing market is poised for continued growth, driven by increasing regulatory scrutiny, heightened consumer demand for safe and sustainable food products, and the ongoing development of innovative testing technologies. Strategic acquisitions, partnerships, and investments in R&D will be crucial for companies aiming to gain a competitive edge. Focus on providing comprehensive, cost-effective, and timely testing solutions, combined with a strong commitment to technological innovation, will be key success factors in this dynamic and evolving market.
Feed Testing Market Segmentation
- 1. Production Analysis
- 2. Consumption Analysis
- 3. Import Market Analysis (Value & Volume)
- 4. Export Market Analysis (Value & Volume)
- 5. Price Trend Analysis
Feed Testing Market Segmentation By Geography
-
1. North America
- 1.1. United States
- 1.2. Canada
- 1.3. Mexico
-
2. South America
- 2.1. Brazil
- 2.2. Argentina
- 2.3. Rest of South America
-
3. Europe
- 3.1. United Kingdom
- 3.2. Germany
- 3.3. France
- 3.4. Italy
- 3.5. Spain
- 3.6. Russia
- 3.7. Benelux
- 3.8. Nordics
- 3.9. Rest of Europe
-
4. Middle East & Africa
- 4.1. Turkey
- 4.2. Israel
- 4.3. GCC
- 4.4. North Africa
- 4.5. South Africa
- 4.6. Rest of Middle East & Africa
-
5. Asia Pacific
- 5.1. China
- 5.2. India
- 5.3. Japan
- 5.4. South Korea
- 5.5. ASEAN
- 5.6. Oceania
- 5.7. Rest of Asia Pacific
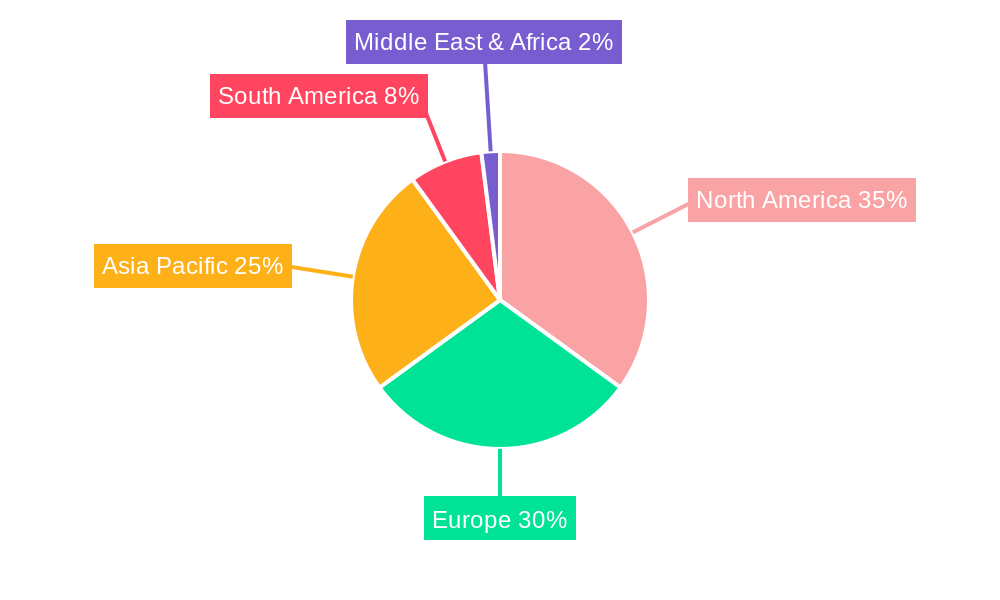
Feed Testing Market Regional Market Share
Geographic Coverage of Feed Testing Market
Feed Testing Market REPORT HIGHLIGHTS
| Aspects | Details |
|---|---|
| Study Period | 2020-2034 |
| Base Year | 2025 |
| Estimated Year | 2026 |
| Forecast Period | 2026-2034 |
| Historical Period | 2020-2025 |
| Growth Rate | CAGR of 9.80% from 2020-2034 |
| Segmentation |
|
Table of Contents
- 1. Introduction
- 1.1. Research Scope
- 1.2. Market Segmentation
- 1.3. Research Objective
- 1.4. Definitions and Assumptions
- 2. Executive Summary
- 2.1. Market Snapshot
- 3. Market Dynamics
- 3.1. Market Drivers
- 3.2. Market Restrains
- 3.3. Market Trends
- 3.4. Market Opportunities
- 4. Market Factor Analysis
- 4.1. Porters Five Forces
- 4.1.1. Bargaining Power of Suppliers
- 4.1.2. Bargaining Power of Buyers
- 4.1.3. Threat of New Entrants
- 4.1.4. Threat of Substitutes
- 4.1.5. Competitive Rivalry
- 4.2. PESTEL analysis
- 4.3. BCG Analysis
- 4.3.1. Stars (High Growth, High Market Share)
- 4.3.2. Cash Cows (Low Growth, High Market Share)
- 4.3.3. Question Mark (High Growth, Low Market Share)
- 4.3.4. Dogs (Low Growth, Low Market Share)
- 4.4. Ansoff Matrix Analysis
- 4.5. Supply Chain Analysis
- 4.6. Regulatory Landscape
- 4.7. Current Market Potential and Opportunity Assessment (TAM–SAM–SOM Framework)
- 4.8. MDP Analyst Note
- 4.1. Porters Five Forces
- 5. Market Analysis, Insights and Forecast 2021-2033
- 5.1. Market Analysis, Insights and Forecast - by Production Analysis
- 5.2. Market Analysis, Insights and Forecast - by Consumption Analysis
- 5.3. Market Analysis, Insights and Forecast - by Import Market Analysis (Value & Volume)
- 5.4. Market Analysis, Insights and Forecast - by Export Market Analysis (Value & Volume)
- 5.5. Market Analysis, Insights and Forecast - by Price Trend Analysis
- 5.6. Market Analysis, Insights and Forecast - by Region
- 5.6.1. North America
- 5.6.2. South America
- 5.6.3. Europe
- 5.6.4. Middle East & Africa
- 5.6.5. Asia Pacific
- 6. Global Feed Testing Market Analysis, Insights and Forecast, 2021-2033
- 6.1. Market Analysis, Insights and Forecast - by Production Analysis
- 6.2. Market Analysis, Insights and Forecast - by Consumption Analysis
- 6.3. Market Analysis, Insights and Forecast - by Import Market Analysis (Value & Volume)
- 6.4. Market Analysis, Insights and Forecast - by Export Market Analysis (Value & Volume)
- 6.5. Market Analysis, Insights and Forecast - by Price Trend Analysis
- 7. North America Feed Testing Market Analysis, Insights and Forecast, 2020-2032
- 7.1. Market Analysis, Insights and Forecast - by Production Analysis
- 7.2. Market Analysis, Insights and Forecast - by Consumption Analysis
- 7.3. Market Analysis, Insights and Forecast - by Import Market Analysis (Value & Volume)
- 7.4. Market Analysis, Insights and Forecast - by Export Market Analysis (Value & Volume)
- 7.5. Market Analysis, Insights and Forecast - by Price Trend Analysis
- 8. South America Feed Testing Market Analysis, Insights and Forecast, 2020-2032
- 8.1. Market Analysis, Insights and Forecast - by Production Analysis
- 8.2. Market Analysis, Insights and Forecast - by Consumption Analysis
- 8.3. Market Analysis, Insights and Forecast - by Import Market Analysis (Value & Volume)
- 8.4. Market Analysis, Insights and Forecast - by Export Market Analysis (Value & Volume)
- 8.5. Market Analysis, Insights and Forecast - by Price Trend Analysis
- 9. Europe Feed Testing Market Analysis, Insights and Forecast, 2020-2032
- 9.1. Market Analysis, Insights and Forecast - by Production Analysis
- 9.2. Market Analysis, Insights and Forecast - by Consumption Analysis
- 9.3. Market Analysis, Insights and Forecast - by Import Market Analysis (Value & Volume)
- 9.4. Market Analysis, Insights and Forecast - by Export Market Analysis (Value & Volume)
- 9.5. Market Analysis, Insights and Forecast - by Price Trend Analysis
- 10. Middle East & Africa Feed Testing Market Analysis, Insights and Forecast, 2020-2032
- 10.1. Market Analysis, Insights and Forecast - by Production Analysis
- 10.2. Market Analysis, Insights and Forecast - by Consumption Analysis
- 10.3. Market Analysis, Insights and Forecast - by Import Market Analysis (Value & Volume)
- 10.4. Market Analysis, Insights and Forecast - by Export Market Analysis (Value & Volume)
- 10.5. Market Analysis, Insights and Forecast - by Price Trend Analysis
- 11. Asia Pacific Feed Testing Market Analysis, Insights and Forecast, 2020-2032
- 11.1. Market Analysis, Insights and Forecast - by Production Analysis
- 11.2. Market Analysis, Insights and Forecast - by Consumption Analysis
- 11.3. Market Analysis, Insights and Forecast - by Import Market Analysis (Value & Volume)
- 11.4. Market Analysis, Insights and Forecast - by Export Market Analysis (Value & Volume)
- 11.5. Market Analysis, Insights and Forecast - by Price Trend Analysis
- 12. Competitive Analysis
- 12.1. Company Profiles
- 12.1.1 SGS SA
- 12.1.1.1. Company Overview
- 12.1.1.2. Products
- 12.1.1.3. Company Financials
- 12.1.1.4. SWOT Analysis
- 12.1.2 R J Hill Laboratories Ltd
- 12.1.2.1. Company Overview
- 12.1.2.2. Products
- 12.1.2.3. Company Financials
- 12.1.2.4. SWOT Analysis
- 12.1.3 NSF International*List Not Exhaustive
- 12.1.3.1. Company Overview
- 12.1.3.2. Products
- 12.1.3.3. Company Financials
- 12.1.3.4. SWOT Analysis
- 12.1.4 Intertek Group PLC
- 12.1.4.1. Company Overview
- 12.1.4.2. Products
- 12.1.4.3. Company Financials
- 12.1.4.4. SWOT Analysis
- 12.1.5 Adpen Laboratories Inc
- 12.1.5.1. Company Overview
- 12.1.5.2. Products
- 12.1.5.3. Company Financials
- 12.1.5.4. SWOT Analysis
- 12.1.6 Bruker Biosciences Corporation
- 12.1.6.1. Company Overview
- 12.1.6.2. Products
- 12.1.6.3. Company Financials
- 12.1.6.4. SWOT Analysis
- 12.1.7 Genetic ID NA Inc
- 12.1.7.1. Company Overview
- 12.1.7.2. Products
- 12.1.7.3. Company Financials
- 12.1.7.4. SWOT Analysis
- 12.1.8 Genon Laboratories Ltd
- 12.1.8.1. Company Overview
- 12.1.8.2. Products
- 12.1.8.3. Company Financials
- 12.1.8.4. SWOT Analysis
- 12.1.9 Eurofins Scientific
- 12.1.9.1. Company Overview
- 12.1.9.2. Products
- 12.1.9.3. Company Financials
- 12.1.9.4. SWOT Analysis
- 12.1.10 Invisible Sentinel Inc
- 12.1.10.1. Company Overview
- 12.1.10.2. Products
- 12.1.10.3. Company Financials
- 12.1.10.4. SWOT Analysis
- 12.1.1 SGS SA
- 12.2. Market Entropy
- 12.2.1 Company's Key Areas Served
- 12.2.2 Recent Developments
- 12.3. Company Market Share Analysis 2025
- 12.3.1 Top 5 Companies Market Share Analysis
- 12.3.2 Top 3 Companies Market Share Analysis
- 12.4. List of Potential Customers
- 13. Research Methodology
List of Figures
- Figure 1: Global Feed Testing Market Revenue Breakdown (Million, %) by Region 2025 & 2033
- Figure 2: Global Feed Testing Market Volume Breakdown (Kiloton, %) by Region 2025 & 2033
- Figure 3: North America Feed Testing Market Revenue (Million), by Production Analysis 2025 & 2033
- Figure 4: North America Feed Testing Market Volume (Kiloton), by Production Analysis 2025 & 2033
- Figure 5: North America Feed Testing Market Revenue Share (%), by Production Analysis 2025 & 2033
- Figure 6: North America Feed Testing Market Volume Share (%), by Production Analysis 2025 & 2033
- Figure 7: North America Feed Testing Market Revenue (Million), by Consumption Analysis 2025 & 2033
- Figure 8: North America Feed Testing Market Volume (Kiloton), by Consumption Analysis 2025 & 2033
- Figure 9: North America Feed Testing Market Revenue Share (%), by Consumption Analysis 2025 & 2033
- Figure 10: North America Feed Testing Market Volume Share (%), by Consumption Analysis 2025 & 2033
- Figure 11: North America Feed Testing Market Revenue (Million), by Import Market Analysis (Value & Volume) 2025 & 2033
- Figure 12: North America Feed Testing Market Volume (Kiloton), by Import Market Analysis (Value & Volume) 2025 & 2033
- Figure 13: North America Feed Testing Market Revenue Share (%), by Import Market Analysis (Value & Volume) 2025 & 2033
- Figure 14: North America Feed Testing Market Volume Share (%), by Import Market Analysis (Value & Volume) 2025 & 2033
- Figure 15: North America Feed Testing Market Revenue (Million), by Export Market Analysis (Value & Volume) 2025 & 2033
- Figure 16: North America Feed Testing Market Volume (Kiloton), by Export Market Analysis (Value & Volume) 2025 & 2033
- Figure 17: North America Feed Testing Market Revenue Share (%), by Export Market Analysis (Value & Volume) 2025 & 2033
- Figure 18: North America Feed Testing Market Volume Share (%), by Export Market Analysis (Value & Volume) 2025 & 2033
- Figure 19: North America Feed Testing Market Revenue (Million), by Price Trend Analysis 2025 & 2033
- Figure 20: North America Feed Testing Market Volume (Kiloton), by Price Trend Analysis 2025 & 2033
- Figure 21: North America Feed Testing Market Revenue Share (%), by Price Trend Analysis 2025 & 2033
- Figure 22: North America Feed Testing Market Volume Share (%), by Price Trend Analysis 2025 & 2033
- Figure 23: North America Feed Testing Market Revenue (Million), by Country 2025 & 2033
- Figure 24: North America Feed Testing Market Volume (Kiloton), by Country 2025 & 2033
- Figure 25: North America Feed Testing Market Revenue Share (%), by Country 2025 & 2033
- Figure 26: North America Feed Testing Market Volume Share (%), by Country 2025 & 2033
- Figure 27: South America Feed Testing Market Revenue (Million), by Production Analysis 2025 & 2033
- Figure 28: South America Feed Testing Market Volume (Kiloton), by Production Analysis 2025 & 2033
- Figure 29: South America Feed Testing Market Revenue Share (%), by Production Analysis 2025 & 2033
- Figure 30: South America Feed Testing Market Volume Share (%), by Production Analysis 2025 & 2033
- Figure 31: South America Feed Testing Market Revenue (Million), by Consumption Analysis 2025 & 2033
- Figure 32: South America Feed Testing Market Volume (Kiloton), by Consumption Analysis 2025 & 2033
- Figure 33: South America Feed Testing Market Revenue Share (%), by Consumption Analysis 2025 & 2033
- Figure 34: South America Feed Testing Market Volume Share (%), by Consumption Analysis 2025 & 2033
- Figure 35: South America Feed Testing Market Revenue (Million), by Import Market Analysis (Value & Volume) 2025 & 2033
- Figure 36: South America Feed Testing Market Volume (Kiloton), by Import Market Analysis (Value & Volume) 2025 & 2033
- Figure 37: South America Feed Testing Market Revenue Share (%), by Import Market Analysis (Value & Volume) 2025 & 2033
- Figure 38: South America Feed Testing Market Volume Share (%), by Import Market Analysis (Value & Volume) 2025 & 2033
- Figure 39: South America Feed Testing Market Revenue (Million), by Export Market Analysis (Value & Volume) 2025 & 2033
- Figure 40: South America Feed Testing Market Volume (Kiloton), by Export Market Analysis (Value & Volume) 2025 & 2033
- Figure 41: South America Feed Testing Market Revenue Share (%), by Export Market Analysis (Value & Volume) 2025 & 2033
- Figure 42: South America Feed Testing Market Volume Share (%), by Export Market Analysis (Value & Volume) 2025 & 2033
- Figure 43: South America Feed Testing Market Revenue (Million), by Price Trend Analysis 2025 & 2033
- Figure 44: South America Feed Testing Market Volume (Kiloton), by Price Trend Analysis 2025 & 2033
- Figure 45: South America Feed Testing Market Revenue Share (%), by Price Trend Analysis 2025 & 2033
- Figure 46: South America Feed Testing Market Volume Share (%), by Price Trend Analysis 2025 & 2033
- Figure 47: South America Feed Testing Market Revenue (Million), by Country 2025 & 2033
- Figure 48: South America Feed Testing Market Volume (Kiloton), by Country 2025 & 2033
- Figure 49: South America Feed Testing Market Revenue Share (%), by Country 2025 & 2033
- Figure 50: South America Feed Testing Market Volume Share (%), by Country 2025 & 2033
- Figure 51: Europe Feed Testing Market Revenue (Million), by Production Analysis 2025 & 2033
- Figure 52: Europe Feed Testing Market Volume (Kiloton), by Production Analysis 2025 & 2033
- Figure 53: Europe Feed Testing Market Revenue Share (%), by Production Analysis 2025 & 2033
- Figure 54: Europe Feed Testing Market Volume Share (%), by Production Analysis 2025 & 2033
- Figure 55: Europe Feed Testing Market Revenue (Million), by Consumption Analysis 2025 & 2033
- Figure 56: Europe Feed Testing Market Volume (Kiloton), by Consumption Analysis 2025 & 2033
- Figure 57: Europe Feed Testing Market Revenue Share (%), by Consumption Analysis 2025 & 2033
- Figure 58: Europe Feed Testing Market Volume Share (%), by Consumption Analysis 2025 & 2033
- Figure 59: Europe Feed Testing Market Revenue (Million), by Import Market Analysis (Value & Volume) 2025 & 2033
- Figure 60: Europe Feed Testing Market Volume (Kiloton), by Import Market Analysis (Value & Volume) 2025 & 2033
- Figure 61: Europe Feed Testing Market Revenue Share (%), by Import Market Analysis (Value & Volume) 2025 & 2033
- Figure 62: Europe Feed Testing Market Volume Share (%), by Import Market Analysis (Value & Volume) 2025 & 2033
- Figure 63: Europe Feed Testing Market Revenue (Million), by Export Market Analysis (Value & Volume) 2025 & 2033
- Figure 64: Europe Feed Testing Market Volume (Kiloton), by Export Market Analysis (Value & Volume) 2025 & 2033
- Figure 65: Europe Feed Testing Market Revenue Share (%), by Export Market Analysis (Value & Volume) 2025 & 2033
- Figure 66: Europe Feed Testing Market Volume Share (%), by Export Market Analysis (Value & Volume) 2025 & 2033
- Figure 67: Europe Feed Testing Market Revenue (Million), by Price Trend Analysis 2025 & 2033
- Figure 68: Europe Feed Testing Market Volume (Kiloton), by Price Trend Analysis 2025 & 2033
- Figure 69: Europe Feed Testing Market Revenue Share (%), by Price Trend Analysis 2025 & 2033
- Figure 70: Europe Feed Testing Market Volume Share (%), by Price Trend Analysis 2025 & 2033
- Figure 71: Europe Feed Testing Market Revenue (Million), by Country 2025 & 2033
- Figure 72: Europe Feed Testing Market Volume (Kiloton), by Country 2025 & 2033
- Figure 73: Europe Feed Testing Market Revenue Share (%), by Country 2025 & 2033
- Figure 74: Europe Feed Testing Market Volume Share (%), by Country 2025 & 2033
- Figure 75: Middle East & Africa Feed Testing Market Revenue (Million), by Production Analysis 2025 & 2033
- Figure 76: Middle East & Africa Feed Testing Market Volume (Kiloton), by Production Analysis 2025 & 2033
- Figure 77: Middle East & Africa Feed Testing Market Revenue Share (%), by Production Analysis 2025 & 2033
- Figure 78: Middle East & Africa Feed Testing Market Volume Share (%), by Production Analysis 2025 & 2033
- Figure 79: Middle East & Africa Feed Testing Market Revenue (Million), by Consumption Analysis 2025 & 2033
- Figure 80: Middle East & Africa Feed Testing Market Volume (Kiloton), by Consumption Analysis 2025 & 2033
- Figure 81: Middle East & Africa Feed Testing Market Revenue Share (%), by Consumption Analysis 2025 & 2033
- Figure 82: Middle East & Africa Feed Testing Market Volume Share (%), by Consumption Analysis 2025 & 2033
- Figure 83: Middle East & Africa Feed Testing Market Revenue (Million), by Import Market Analysis (Value & Volume) 2025 & 2033
- Figure 84: Middle East & Africa Feed Testing Market Volume (Kiloton), by Import Market Analysis (Value & Volume) 2025 & 2033
- Figure 85: Middle East & Africa Feed Testing Market Revenue Share (%), by Import Market Analysis (Value & Volume) 2025 & 2033
- Figure 86: Middle East & Africa Feed Testing Market Volume Share (%), by Import Market Analysis (Value & Volume) 2025 & 2033
- Figure 87: Middle East & Africa Feed Testing Market Revenue (Million), by Export Market Analysis (Value & Volume) 2025 & 2033
- Figure 88: Middle East & Africa Feed Testing Market Volume (Kiloton), by Export Market Analysis (Value & Volume) 2025 & 2033
- Figure 89: Middle East & Africa Feed Testing Market Revenue Share (%), by Export Market Analysis (Value & Volume) 2025 & 2033
- Figure 90: Middle East & Africa Feed Testing Market Volume Share (%), by Export Market Analysis (Value & Volume) 2025 & 2033
- Figure 91: Middle East & Africa Feed Testing Market Revenue (Million), by Price Trend Analysis 2025 & 2033
- Figure 92: Middle East & Africa Feed Testing Market Volume (Kiloton), by Price Trend Analysis 2025 & 2033
- Figure 93: Middle East & Africa Feed Testing Market Revenue Share (%), by Price Trend Analysis 2025 & 2033
- Figure 94: Middle East & Africa Feed Testing Market Volume Share (%), by Price Trend Analysis 2025 & 2033
- Figure 95: Middle East & Africa Feed Testing Market Revenue (Million), by Country 2025 & 2033
- Figure 96: Middle East & Africa Feed Testing Market Volume (Kiloton), by Country 2025 & 2033
- Figure 97: Middle East & Africa Feed Testing Market Revenue Share (%), by Country 2025 & 2033
- Figure 98: Middle East & Africa Feed Testing Market Volume Share (%), by Country 2025 & 2033
- Figure 99: Asia Pacific Feed Testing Market Revenue (Million), by Production Analysis 2025 & 2033
- Figure 100: Asia Pacific Feed Testing Market Volume (Kiloton), by Production Analysis 2025 & 2033
- Figure 101: Asia Pacific Feed Testing Market Revenue Share (%), by Production Analysis 2025 & 2033
- Figure 102: Asia Pacific Feed Testing Market Volume Share (%), by Production Analysis 2025 & 2033
- Figure 103: Asia Pacific Feed Testing Market Revenue (Million), by Consumption Analysis 2025 & 2033
- Figure 104: Asia Pacific Feed Testing Market Volume (Kiloton), by Consumption Analysis 2025 & 2033
- Figure 105: Asia Pacific Feed Testing Market Revenue Share (%), by Consumption Analysis 2025 & 2033
- Figure 106: Asia Pacific Feed Testing Market Volume Share (%), by Consumption Analysis 2025 & 2033
- Figure 107: Asia Pacific Feed Testing Market Revenue (Million), by Import Market Analysis (Value & Volume) 2025 & 2033
- Figure 108: Asia Pacific Feed Testing Market Volume (Kiloton), by Import Market Analysis (Value & Volume) 2025 & 2033
- Figure 109: Asia Pacific Feed Testing Market Revenue Share (%), by Import Market Analysis (Value & Volume) 2025 & 2033
- Figure 110: Asia Pacific Feed Testing Market Volume Share (%), by Import Market Analysis (Value & Volume) 2025 & 2033
- Figure 111: Asia Pacific Feed Testing Market Revenue (Million), by Export Market Analysis (Value & Volume) 2025 & 2033
- Figure 112: Asia Pacific Feed Testing Market Volume (Kiloton), by Export Market Analysis (Value & Volume) 2025 & 2033
- Figure 113: Asia Pacific Feed Testing Market Revenue Share (%), by Export Market Analysis (Value & Volume) 2025 & 2033
- Figure 114: Asia Pacific Feed Testing Market Volume Share (%), by Export Market Analysis (Value & Volume) 2025 & 2033
- Figure 115: Asia Pacific Feed Testing Market Revenue (Million), by Price Trend Analysis 2025 & 2033
- Figure 116: Asia Pacific Feed Testing Market Volume (Kiloton), by Price Trend Analysis 2025 & 2033
- Figure 117: Asia Pacific Feed Testing Market Revenue Share (%), by Price Trend Analysis 2025 & 2033
- Figure 118: Asia Pacific Feed Testing Market Volume Share (%), by Price Trend Analysis 2025 & 2033
- Figure 119: Asia Pacific Feed Testing Market Revenue (Million), by Country 2025 & 2033
- Figure 120: Asia Pacific Feed Testing Market Volume (Kiloton), by Country 2025 & 2033
- Figure 121: Asia Pacific Feed Testing Market Revenue Share (%), by Country 2025 & 2033
- Figure 122: Asia Pacific Feed Testing Market Volume Share (%), by Country 2025 & 2033
List of Tables
- Table 1: Global Feed Testing Market Revenue Million Forecast, by Production Analysis 2020 & 2033
- Table 2: Global Feed Testing Market Volume Kiloton Forecast, by Production Analysis 2020 & 2033
- Table 3: Global Feed Testing Market Revenue Million Forecast, by Consumption Analysis 2020 & 2033
- Table 4: Global Feed Testing Market Volume Kiloton Forecast, by Consumption Analysis 2020 & 2033
- Table 5: Global Feed Testing Market Revenue Million Forecast, by Import Market Analysis (Value & Volume) 2020 & 2033
- Table 6: Global Feed Testing Market Volume Kiloton Forecast, by Import Market Analysis (Value & Volume) 2020 & 2033
- Table 7: Global Feed Testing Market Revenue Million Forecast, by Export Market Analysis (Value & Volume) 2020 & 2033
- Table 8: Global Feed Testing Market Volume Kiloton Forecast, by Export Market Analysis (Value & Volume) 2020 & 2033
- Table 9: Global Feed Testing Market Revenue Million Forecast, by Price Trend Analysis 2020 & 2033
- Table 10: Global Feed Testing Market Volume Kiloton Forecast, by Price Trend Analysis 2020 & 2033
- Table 11: Global Feed Testing Market Revenue Million Forecast, by Region 2020 & 2033
- Table 12: Global Feed Testing Market Volume Kiloton Forecast, by Region 2020 & 2033
- Table 13: Global Feed Testing Market Revenue Million Forecast, by Production Analysis 2020 & 2033
- Table 14: Global Feed Testing Market Volume Kiloton Forecast, by Production Analysis 2020 & 2033
- Table 15: Global Feed Testing Market Revenue Million Forecast, by Consumption Analysis 2020 & 2033
- Table 16: Global Feed Testing Market Volume Kiloton Forecast, by Consumption Analysis 2020 & 2033
- Table 17: Global Feed Testing Market Revenue Million Forecast, by Import Market Analysis (Value & Volume) 2020 & 2033
- Table 18: Global Feed Testing Market Volume Kiloton Forecast, by Import Market Analysis (Value & Volume) 2020 & 2033
- Table 19: Global Feed Testing Market Revenue Million Forecast, by Export Market Analysis (Value & Volume) 2020 & 2033
- Table 20: Global Feed Testing Market Volume Kiloton Forecast, by Export Market Analysis (Value & Volume) 2020 & 2033
- Table 21: Global Feed Testing Market Revenue Million Forecast, by Price Trend Analysis 2020 & 2033
- Table 22: Global Feed Testing Market Volume Kiloton Forecast, by Price Trend Analysis 2020 & 2033
- Table 23: Global Feed Testing Market Revenue Million Forecast, by Country 2020 & 2033
- Table 24: Global Feed Testing Market Volume Kiloton Forecast, by Country 2020 & 2033
- Table 25: United States Feed Testing Market Revenue (Million) Forecast, by Application 2020 & 2033
- Table 26: United States Feed Testing Market Volume (Kiloton) Forecast, by Application 2020 & 2033
- Table 27: Canada Feed Testing Market Revenue (Million) Forecast, by Application 2020 & 2033
- Table 28: Canada Feed Testing Market Volume (Kiloton) Forecast, by Application 2020 & 2033
- Table 29: Mexico Feed Testing Market Revenue (Million) Forecast, by Application 2020 & 2033
- Table 30: Mexico Feed Testing Market Volume (Kiloton) Forecast, by Application 2020 & 2033
- Table 31: Global Feed Testing Market Revenue Million Forecast, by Production Analysis 2020 & 2033
- Table 32: Global Feed Testing Market Volume Kiloton Forecast, by Production Analysis 2020 & 2033
- Table 33: Global Feed Testing Market Revenue Million Forecast, by Consumption Analysis 2020 & 2033
- Table 34: Global Feed Testing Market Volume Kiloton Forecast, by Consumption Analysis 2020 & 2033
- Table 35: Global Feed Testing Market Revenue Million Forecast, by Import Market Analysis (Value & Volume) 2020 & 2033
- Table 36: Global Feed Testing Market Volume Kiloton Forecast, by Import Market Analysis (Value & Volume) 2020 & 2033
- Table 37: Global Feed Testing Market Revenue Million Forecast, by Export Market Analysis (Value & Volume) 2020 & 2033
- Table 38: Global Feed Testing Market Volume Kiloton Forecast, by Export Market Analysis (Value & Volume) 2020 & 2033
- Table 39: Global Feed Testing Market Revenue Million Forecast, by Price Trend Analysis 2020 & 2033
- Table 40: Global Feed Testing Market Volume Kiloton Forecast, by Price Trend Analysis 2020 & 2033
- Table 41: Global Feed Testing Market Revenue Million Forecast, by Country 2020 & 2033
- Table 42: Global Feed Testing Market Volume Kiloton Forecast, by Country 2020 & 2033
- Table 43: Brazil Feed Testing Market Revenue (Million) Forecast, by Application 2020 & 2033
- Table 44: Brazil Feed Testing Market Volume (Kiloton) Forecast, by Application 2020 & 2033
- Table 45: Argentina Feed Testing Market Revenue (Million) Forecast, by Application 2020 & 2033
- Table 46: Argentina Feed Testing Market Volume (Kiloton) Forecast, by Application 2020 & 2033
- Table 47: Rest of South America Feed Testing Market Revenue (Million) Forecast, by Application 2020 & 2033
- Table 48: Rest of South America Feed Testing Market Volume (Kiloton) Forecast, by Application 2020 & 2033
- Table 49: Global Feed Testing Market Revenue Million Forecast, by Production Analysis 2020 & 2033
- Table 50: Global Feed Testing Market Volume Kiloton Forecast, by Production Analysis 2020 & 2033
- Table 51: Global Feed Testing Market Revenue Million Forecast, by Consumption Analysis 2020 & 2033
- Table 52: Global Feed Testing Market Volume Kiloton Forecast, by Consumption Analysis 2020 & 2033
- Table 53: Global Feed Testing Market Revenue Million Forecast, by Import Market Analysis (Value & Volume) 2020 & 2033
- Table 54: Global Feed Testing Market Volume Kiloton Forecast, by Import Market Analysis (Value & Volume) 2020 & 2033
- Table 55: Global Feed Testing Market Revenue Million Forecast, by Export Market Analysis (Value & Volume) 2020 & 2033
- Table 56: Global Feed Testing Market Volume Kiloton Forecast, by Export Market Analysis (Value & Volume) 2020 & 2033
- Table 57: Global Feed Testing Market Revenue Million Forecast, by Price Trend Analysis 2020 & 2033
- Table 58: Global Feed Testing Market Volume Kiloton Forecast, by Price Trend Analysis 2020 & 2033
- Table 59: Global Feed Testing Market Revenue Million Forecast, by Country 2020 & 2033
- Table 60: Global Feed Testing Market Volume Kiloton Forecast, by Country 2020 & 2033
- Table 61: United Kingdom Feed Testing Market Revenue (Million) Forecast, by Application 2020 & 2033
- Table 62: United Kingdom Feed Testing Market Volume (Kiloton) Forecast, by Application 2020 & 2033
- Table 63: Germany Feed Testing Market Revenue (Million) Forecast, by Application 2020 & 2033
- Table 64: Germany Feed Testing Market Volume (Kiloton) Forecast, by Application 2020 & 2033
- Table 65: France Feed Testing Market Revenue (Million) Forecast, by Application 2020 & 2033
- Table 66: France Feed Testing Market Volume (Kiloton) Forecast, by Application 2020 & 2033
- Table 67: Italy Feed Testing Market Revenue (Million) Forecast, by Application 2020 & 2033
- Table 68: Italy Feed Testing Market Volume (Kiloton) Forecast, by Application 2020 & 2033
- Table 69: Spain Feed Testing Market Revenue (Million) Forecast, by Application 2020 & 2033
- Table 70: Spain Feed Testing Market Volume (Kiloton) Forecast, by Application 2020 & 2033
- Table 71: Russia Feed Testing Market Revenue (Million) Forecast, by Application 2020 & 2033
- Table 72: Russia Feed Testing Market Volume (Kiloton) Forecast, by Application 2020 & 2033
- Table 73: Benelux Feed Testing Market Revenue (Million) Forecast, by Application 2020 & 2033
- Table 74: Benelux Feed Testing Market Volume (Kiloton) Forecast, by Application 2020 & 2033
- Table 75: Nordics Feed Testing Market Revenue (Million) Forecast, by Application 2020 & 2033
- Table 76: Nordics Feed Testing Market Volume (Kiloton) Forecast, by Application 2020 & 2033
- Table 77: Rest of Europe Feed Testing Market Revenue (Million) Forecast, by Application 2020 & 2033
- Table 78: Rest of Europe Feed Testing Market Volume (Kiloton) Forecast, by Application 2020 & 2033
- Table 79: Global Feed Testing Market Revenue Million Forecast, by Production Analysis 2020 & 2033
- Table 80: Global Feed Testing Market Volume Kiloton Forecast, by Production Analysis 2020 & 2033
- Table 81: Global Feed Testing Market Revenue Million Forecast, by Consumption Analysis 2020 & 2033
- Table 82: Global Feed Testing Market Volume Kiloton Forecast, by Consumption Analysis 2020 & 2033
- Table 83: Global Feed Testing Market Revenue Million Forecast, by Import Market Analysis (Value & Volume) 2020 & 2033
- Table 84: Global Feed Testing Market Volume Kiloton Forecast, by Import Market Analysis (Value & Volume) 2020 & 2033
- Table 85: Global Feed Testing Market Revenue Million Forecast, by Export Market Analysis (Value & Volume) 2020 & 2033
- Table 86: Global Feed Testing Market Volume Kiloton Forecast, by Export Market Analysis (Value & Volume) 2020 & 2033
- Table 87: Global Feed Testing Market Revenue Million Forecast, by Price Trend Analysis 2020 & 2033
- Table 88: Global Feed Testing Market Volume Kiloton Forecast, by Price Trend Analysis 2020 & 2033
- Table 89: Global Feed Testing Market Revenue Million Forecast, by Country 2020 & 2033
- Table 90: Global Feed Testing Market Volume Kiloton Forecast, by Country 2020 & 2033
- Table 91: Turkey Feed Testing Market Revenue (Million) Forecast, by Application 2020 & 2033
- Table 92: Turkey Feed Testing Market Volume (Kiloton) Forecast, by Application 2020 & 2033
- Table 93: Israel Feed Testing Market Revenue (Million) Forecast, by Application 2020 & 2033
- Table 94: Israel Feed Testing Market Volume (Kiloton) Forecast, by Application 2020 & 2033
- Table 95: GCC Feed Testing Market Revenue (Million) Forecast, by Application 2020 & 2033
- Table 96: GCC Feed Testing Market Volume (Kiloton) Forecast, by Application 2020 & 2033
- Table 97: North Africa Feed Testing Market Revenue (Million) Forecast, by Application 2020 & 2033
- Table 98: North Africa Feed Testing Market Volume (Kiloton) Forecast, by Application 2020 & 2033
- Table 99: South Africa Feed Testing Market Revenue (Million) Forecast, by Application 2020 & 2033
- Table 100: South Africa Feed Testing Market Volume (Kiloton) Forecast, by Application 2020 & 2033
- Table 101: Rest of Middle East & Africa Feed Testing Market Revenue (Million) Forecast, by Application 2020 & 2033
- Table 102: Rest of Middle East & Africa Feed Testing Market Volume (Kiloton) Forecast, by Application 2020 & 2033
- Table 103: Global Feed Testing Market Revenue Million Forecast, by Production Analysis 2020 & 2033
- Table 104: Global Feed Testing Market Volume Kiloton Forecast, by Production Analysis 2020 & 2033
- Table 105: Global Feed Testing Market Revenue Million Forecast, by Consumption Analysis 2020 & 2033
- Table 106: Global Feed Testing Market Volume Kiloton Forecast, by Consumption Analysis 2020 & 2033
- Table 107: Global Feed Testing Market Revenue Million Forecast, by Import Market Analysis (Value & Volume) 2020 & 2033
- Table 108: Global Feed Testing Market Volume Kiloton Forecast, by Import Market Analysis (Value & Volume) 2020 & 2033
- Table 109: Global Feed Testing Market Revenue Million Forecast, by Export Market Analysis (Value & Volume) 2020 & 2033
- Table 110: Global Feed Testing Market Volume Kiloton Forecast, by Export Market Analysis (Value & Volume) 2020 & 2033
- Table 111: Global Feed Testing Market Revenue Million Forecast, by Price Trend Analysis 2020 & 2033
- Table 112: Global Feed Testing Market Volume Kiloton Forecast, by Price Trend Analysis 2020 & 2033
- Table 113: Global Feed Testing Market Revenue Million Forecast, by Country 2020 & 2033
- Table 114: Global Feed Testing Market Volume Kiloton Forecast, by Country 2020 & 2033
- Table 115: China Feed Testing Market Revenue (Million) Forecast, by Application 2020 & 2033
- Table 116: China Feed Testing Market Volume (Kiloton) Forecast, by Application 2020 & 2033
- Table 117: India Feed Testing Market Revenue (Million) Forecast, by Application 2020 & 2033
- Table 118: India Feed Testing Market Volume (Kiloton) Forecast, by Application 2020 & 2033
- Table 119: Japan Feed Testing Market Revenue (Million) Forecast, by Application 2020 & 2033
- Table 120: Japan Feed Testing Market Volume (Kiloton) Forecast, by Application 2020 & 2033
- Table 121: South Korea Feed Testing Market Revenue (Million) Forecast, by Application 2020 & 2033
- Table 122: South Korea Feed Testing Market Volume (Kiloton) Forecast, by Application 2020 & 2033
- Table 123: ASEAN Feed Testing Market Revenue (Million) Forecast, by Application 2020 & 2033
- Table 124: ASEAN Feed Testing Market Volume (Kiloton) Forecast, by Application 2020 & 2033
- Table 125: Oceania Feed Testing Market Revenue (Million) Forecast, by Application 2020 & 2033
- Table 126: Oceania Feed Testing Market Volume (Kiloton) Forecast, by Application 2020 & 2033
- Table 127: Rest of Asia Pacific Feed Testing Market Revenue (Million) Forecast, by Application 2020 & 2033
- Table 128: Rest of Asia Pacific Feed Testing Market Volume (Kiloton) Forecast, by Application 2020 & 2033
Frequently Asked Questions
1. What is the projected Compound Annual Growth Rate (CAGR) of the Feed Testing Market?
The projected CAGR is approximately 9.80%.
2. Which companies are prominent players in the Feed Testing Market?
Key companies in the market include SGS SA, R J Hill Laboratories Ltd, NSF International*List Not Exhaustive, Intertek Group PLC, Adpen Laboratories Inc, Bruker Biosciences Corporation, Genetic ID NA Inc, Genon Laboratories Ltd, Eurofins Scientific, Invisible Sentinel Inc.
3. What are the main segments of the Feed Testing Market?
The market segments include Production Analysis, Consumption Analysis, Import Market Analysis (Value & Volume), Export Market Analysis (Value & Volume), Price Trend Analysis.
4. Can you provide details about the market size?
The market size is estimated to be USD 2.54 Million as of 2022.
5. What are some drivers contributing to market growth?
Decreasing Per Capita Arable Land; Increased Demand for Food.
6. What are the notable trends driving market growth?
Increasing Government Regulations Driving Growth of Pet Food Testing Market.
7. Are there any restraints impacting market growth?
High Initial Investments; Requirement of Precision Agriculture.
8. Can you provide examples of recent developments in the market?
N/A
9. What pricing options are available for accessing the report?
Pricing options include single-user, multi-user, and enterprise licenses priced at USD 4750, USD 5250, and USD 8750 respectively.
10. Is the market size provided in terms of value or volume?
The market size is provided in terms of value, measured in Million and volume, measured in Kiloton.
11. Are there any specific market keywords associated with the report?
Yes, the market keyword associated with the report is "Feed Testing Market," which aids in identifying and referencing the specific market segment covered.
12. How do I determine which pricing option suits my needs best?
The pricing options vary based on user requirements and access needs. Individual users may opt for single-user licenses, while businesses requiring broader access may choose multi-user or enterprise licenses for cost-effective access to the report.
13. Are there any additional resources or data provided in the Feed Testing Market report?
While the report offers comprehensive insights, it's advisable to review the specific contents or supplementary materials provided to ascertain if additional resources or data are available.
14. How can I stay updated on further developments or reports in the Feed Testing Market?
To stay informed about further developments, trends, and reports in the Feed Testing Market, consider subscribing to industry newsletters, following relevant companies and organizations, or regularly checking reputable industry news sources and publications.
Methodology
Step 1 - Identification of Relevant Samples Size from Population Database


Step 2 - Approaches for Defining Global Market Size (Value, Volume* & Price*)

Note*: In applicable scenarios
Step 3 - Data Sources
Primary Research
- Web Analytics
- Survey Reports
- Research Institute
- Latest Research Reports
- Opinion Leaders
Secondary Research
- Annual Reports
- White Paper
- Latest Press Release
- Industry Association
- Paid Database
- Investor Presentations

Step 4 - Data Triangulation
Involves using different sources of information in order to increase the validity of a study
These sources are likely to be stakeholders in a program - participants, other researchers, program staff, other community members, and so on.
Then we put all data in single framework & apply various statistical tools to find out the dynamic on the market.
During the analysis stage, feedback from the stakeholder groups would be compared to determine areas of agreement as well as areas of divergence