

Key Insights
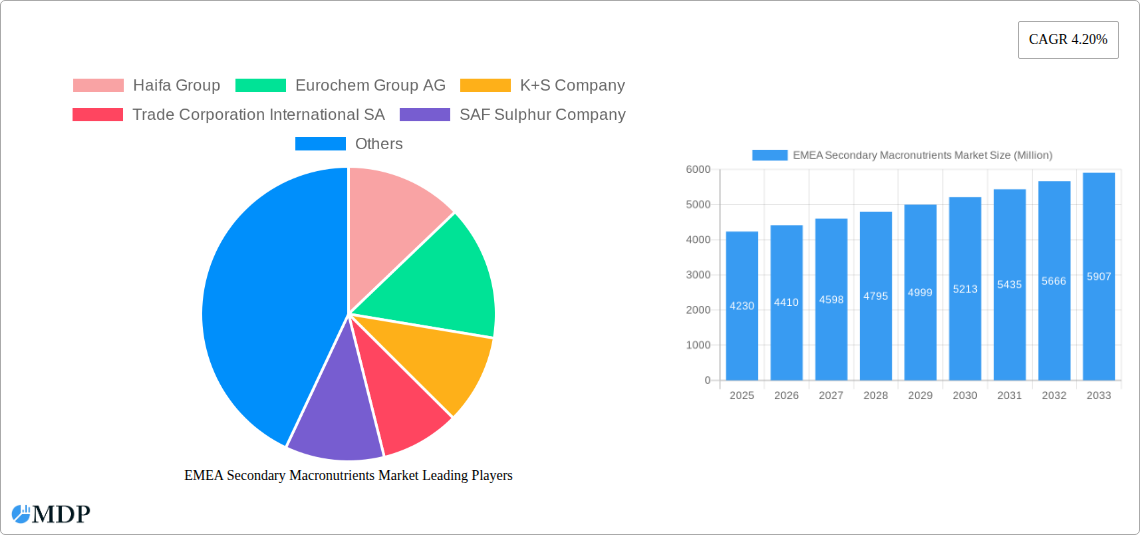
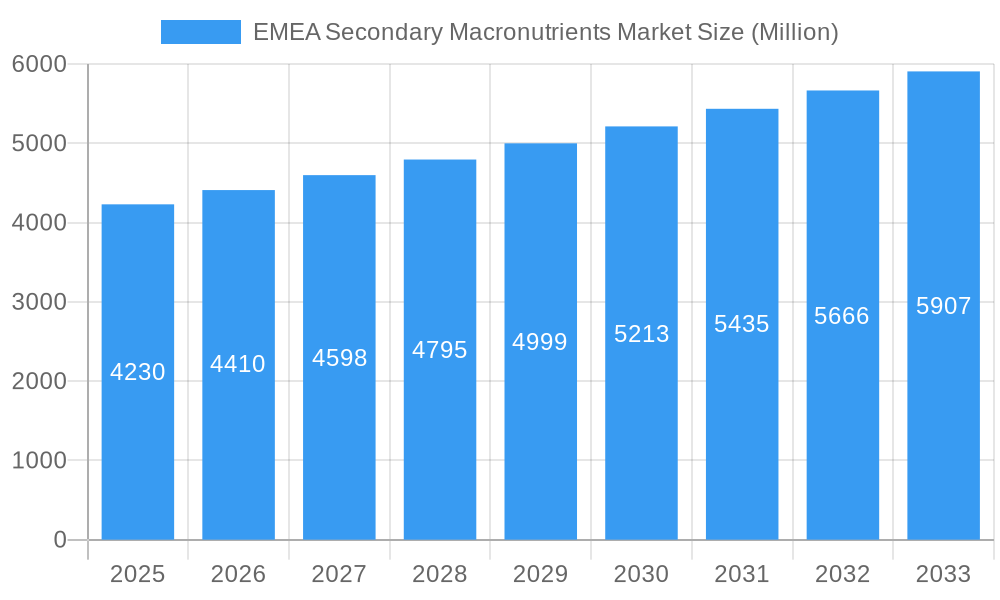
The EMEA Secondary Macronutrients Market, valued at approximately $4.23 billion in 2025, is projected to experience robust growth, driven by the increasing demand for enhanced crop yields and the rising adoption of sustainable agricultural practices. The market's Compound Annual Growth Rate (CAGR) of 4.20% from 2025 to 2033 indicates a steady expansion, fueled by factors such as escalating food insecurity, favorable government policies promoting efficient fertilization, and the growing awareness among farmers about the importance of balanced nutrition for optimal crop health. Significant market segments include sulfur, calcium, and magnesium-based fertilizers, applied through solid and liquid methods across diverse crop types, ranging from grains and cereals to fruits and vegetables and ornamental plants. Key players like Haifa Group, Eurochem Group AG, and Yara International ASA are driving innovation and expanding their market presence through strategic partnerships and product diversification. The market's growth, however, might be tempered by fluctuations in raw material prices and potential regulatory changes impacting fertilizer usage.
EMEA Secondary Macronutrients Market Market Size (In Billion)
Regional variations within EMEA are anticipated. While Western European nations demonstrate a mature market with established application techniques, regions like the Middle East and Africa present considerable growth potential due to expanding agricultural activities and increasing investments in modern farming methods. The Asia-Pacific region, encompassing key markets such as India and China, will likely contribute significantly to the overall growth trajectory, primarily driven by rising agricultural production and evolving farming practices. Market segmentation based on application method shows a preference for solid fertilizers in certain regions due to established distribution channels and familiarity amongst farmers. Conversely, liquid fertilizers are gaining traction owing to their ease of application and precise nutrient delivery. The market's future outlook is positive, with opportunities for innovation in fertilizer formulations and delivery systems contributing to its sustained growth throughout the forecast period.
EMEA Secondary Macronutrients Market Company Market Share
EMEA Secondary Macronutrients Market: A Comprehensive Report (2019-2033)
This in-depth report provides a comprehensive analysis of the EMEA Secondary Macronutrients Market, offering invaluable insights for industry stakeholders seeking to navigate this dynamic sector. Covering the period 2019-2033, with a focus on 2025, this study unveils key trends, challenges, and opportunities shaping the future of secondary macronutrient production and consumption across Europe, the Middle East, and Africa. The report utilizes a robust methodology, incorporating historical data (2019-2024), current estimates (2025), and future projections (2025-2033) to provide a clear and actionable roadmap for success.
High-traffic keywords: EMEA secondary macronutrients market, sulfur market, calcium market, magnesium market, fertilizer market, agricultural chemicals, crop nutrition, market analysis, market forecast, market trends, market size, market share, EMEA agriculture, CAGR, M&A, industry development
EMEA Secondary Macronutrients Market Dynamics & Concentration
The EMEA secondary macronutrients market is characterized by a moderately concentrated landscape, with a few major players holding significant market share. The market's dynamics are driven by several factors, including innovation in product formulations (e.g., controlled-release fertilizers), evolving regulatory frameworks focused on sustainable agriculture, and the increasing demand for higher-yielding and more resilient crops. Product substitution, primarily through the adoption of organic alternatives, poses a moderate challenge. End-user trends reveal a growing preference for customized solutions tailored to specific crop types and soil conditions. Mergers and acquisitions (M&A) activity has been relatively stable in recent years, with approximately xx M&A deals recorded between 2019 and 2024. Major players are strategically focusing on expanding their geographic reach and product portfolios to maintain competitiveness. Market share analysis reveals that the top 5 players account for approximately xx% of the overall market, with a forecast to reach xx% by 2033.
- Market concentration: Moderately concentrated
- Innovation drivers: Controlled-release fertilizers, bio-fertilizers
- Regulatory impact: Increasing focus on sustainable agriculture practices
- Product substitution: Organic alternatives
- End-user trends: Demand for customized solutions, precision agriculture
- M&A activity: xx deals (2019-2024), xx predicted for 2025-2033
EMEA Secondary Macronutrients Market Industry Trends & Analysis
The EMEA secondary macronutrients market is projected to experience a CAGR of xx% during the forecast period (2025-2033), driven by several key factors. Rising global food demand, coupled with the increasing intensity of agriculture in many EMEA regions, fuels the need for efficient nutrient management. Technological advancements, including precision farming techniques and the adoption of sensor-based technologies for optimized fertilizer application, are enhancing market growth. Consumer preferences are shifting towards products with enhanced environmental profiles, leading to increased demand for sustainable and environmentally friendly formulations. Competitive dynamics are characterized by both consolidation among major players and the emergence of specialized niche players offering innovative products and services. The market penetration of liquid application methods is steadily increasing, projected to reach xx% by 2033, driven by improved efficacy and ease of application compared to solid forms. Overall, the market demonstrates robust growth potential, driven by a complex interplay of technological advancement, environmental concerns, and economic factors.
Leading Markets & Segments in EMEA Secondary Macronutrients Market
The analysis of leading markets and segments reveals that the sulfur nutrient type dominates the market, accounting for approximately xx% of the total market value in 2025. This is closely followed by calcium and magnesium. In terms of application method, the solid form is still prevalent, though the liquid segment shows a strong growth potential. Geographically, Western Europe shows the largest market share.
Key Drivers for Sulfur Dominance:
- High demand from grains and cereals cultivation.
- Essential nutrient for various crop types.
- Relatively cost-effective compared to other secondary macronutrients.
Key Drivers for Leading Regions/Countries (Example: Western Europe):
- Intensive agricultural practices.
- Favorable economic conditions and government support for agriculture.
- Well-established distribution networks.
- High adoption rate of precision agriculture technologies.
Crop Type Analysis: Grains and cereals constitute the largest crop type segment, followed by pulses and oilseeds, then fruits and vegetables. Turfs and ornamentals account for a smaller yet growing segment.
EMEA Secondary Macronutrients Market Product Developments
Significant product innovation is occurring, primarily focusing on improving fertilizer efficacy, sustainability, and ease of application. Companies are developing controlled-release formulations to maximize nutrient uptake and minimize environmental impact. The integration of micronutrients into secondary macronutrient products is gaining traction, offering enhanced nutritional benefits to crops. Furthermore, the use of advanced technologies in manufacturing processes aims to improve product quality and reduce production costs. These developments improve market fit by addressing farmers' concerns about efficiency, environmental responsibility, and cost-effectiveness.
Key Drivers of EMEA Secondary Macronutrients Market Growth
Several factors contribute to the market's growth. Firstly, increasing global food demand necessitates higher crop yields, leading to a greater reliance on optimized fertilization strategies. Secondly, technological advancements in precision agriculture improve application efficiency and reduce nutrient waste. Finally, favorable government policies and supportive regulatory frameworks encourage the adoption of advanced agricultural practices, boosting the market.
Challenges in the EMEA Secondary Macronutrients Market
The market faces challenges such as price volatility in raw materials, particularly sulfur, and potential supply chain disruptions. Furthermore, stringent environmental regulations can increase compliance costs, and intense competition from established and emerging players can pressure profit margins. These factors, if unaddressed, could negatively impact market growth. For example, a 10% increase in sulfur prices could potentially decrease market demand by xx%.
Emerging Opportunities in EMEA Secondary Macronutrients Market
Significant opportunities exist in developing customized nutrient solutions tailored to specific crop types and soil conditions. Strategic partnerships between fertilizer producers and agricultural technology companies are expected to generate innovation, leading to a more efficient and sustainable agricultural sector. Furthermore, expansion into emerging markets within EMEA, characterized by high growth potential in agricultural production, offers considerable scope for market expansion.
Leading Players in the EMEA Secondary Macronutrients Market Sector
- Haifa Group
- Eurochem Group AG
- K+S Company
- Trade Corporation International SA
- SAF Sulphur Company
- Saudi United Fertilizer Company (al-asmida)
- Al-tayseer Chemical Industry
- Israel Chemical Company
- Takamul National Agriculture
- Yara International ASA
Key Milestones in EMEA Secondary Macronutrients Market Industry
- 2020: Introduction of a new controlled-release sulfur fertilizer by Haifa Group.
- 2022: Merger between two regional fertilizer distributors, leading to increased market consolidation.
- 2023: Implementation of stricter environmental regulations in several European countries.
- 2024: Launch of a precision agriculture platform integrating fertilizer recommendations and application technology.
Strategic Outlook for EMEA Secondary Macronutrients Market Market
The EMEA secondary macronutrients market presents a promising outlook, characterized by consistent growth driven by technological innovation and increasing demand for sustainable agricultural practices. Strategic investments in research and development, strategic partnerships, and expansion into new markets will be key to long-term success. The focus on providing customized solutions and utilizing advanced technologies for optimized nutrient management will be crucial for companies to capture significant market share and thrive in this competitive landscape.
EMEA Secondary Macronutrients Market Segmentation
- 1. Production Analysis
- 2. Consumption Analysis
- 3. Import Market Analysis (Value & Volume)
- 4. Export Market Analysis (Value & Volume)
- 5. Price Trend Analysis
EMEA Secondary Macronutrients Market Segmentation By Geography
-
1. North America
- 1.1. United States
- 1.2. Canada
- 1.3. Mexico
-
2. South America
- 2.1. Brazil
- 2.2. Argentina
- 2.3. Rest of South America
-
3. Europe
- 3.1. United Kingdom
- 3.2. Germany
- 3.3. France
- 3.4. Italy
- 3.5. Spain
- 3.6. Russia
- 3.7. Benelux
- 3.8. Nordics
- 3.9. Rest of Europe
-
4. Middle East & Africa
- 4.1. Turkey
- 4.2. Israel
- 4.3. GCC
- 4.4. North Africa
- 4.5. South Africa
- 4.6. Rest of Middle East & Africa
-
5. Asia Pacific
- 5.1. China
- 5.2. India
- 5.3. Japan
- 5.4. South Korea
- 5.5. ASEAN
- 5.6. Oceania
- 5.7. Rest of Asia Pacific
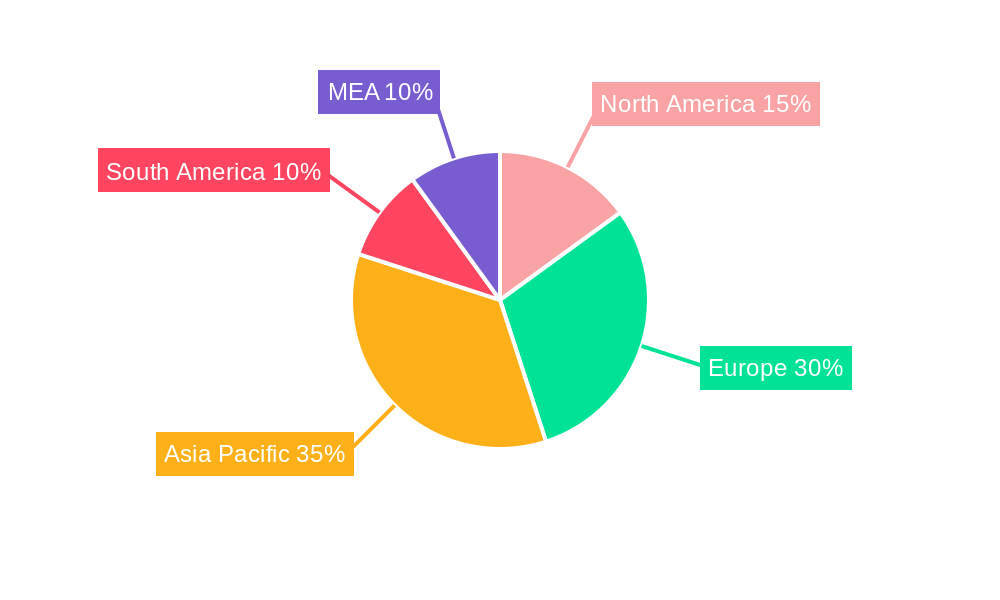
EMEA Secondary Macronutrients Market Regional Market Share
Geographic Coverage of EMEA Secondary Macronutrients Market
EMEA Secondary Macronutrients Market REPORT HIGHLIGHTS
| Aspects | Details |
|---|---|
| Study Period | 2020-2034 |
| Base Year | 2025 |
| Estimated Year | 2026 |
| Forecast Period | 2026-2034 |
| Historical Period | 2020-2025 |
| Growth Rate | CAGR of 4.20% from 2020-2034 |
| Segmentation |
|
Table of Contents
- 1. Introduction
- 1.1. Research Scope
- 1.2. Market Segmentation
- 1.3. Research Objective
- 1.4. Definitions and Assumptions
- 2. Executive Summary
- 2.1. Market Snapshot
- 3. Market Dynamics
- 3.1. Market Drivers
- 3.2. Market Restrains
- 3.3. Market Trends
- 3.4. Market Opportunities
- 4. Market Factor Analysis
- 4.1. Porters Five Forces
- 4.1.1. Bargaining Power of Suppliers
- 4.1.2. Bargaining Power of Buyers
- 4.1.3. Threat of New Entrants
- 4.1.4. Threat of Substitutes
- 4.1.5. Competitive Rivalry
- 4.2. PESTEL analysis
- 4.3. BCG Analysis
- 4.3.1. Stars (High Growth, High Market Share)
- 4.3.2. Cash Cows (Low Growth, High Market Share)
- 4.3.3. Question Mark (High Growth, Low Market Share)
- 4.3.4. Dogs (Low Growth, Low Market Share)
- 4.4. Ansoff Matrix Analysis
- 4.5. Supply Chain Analysis
- 4.6. Regulatory Landscape
- 4.7. Current Market Potential and Opportunity Assessment (TAM–SAM–SOM Framework)
- 4.8. MDP Analyst Note
- 4.1. Porters Five Forces
- 5. Market Analysis, Insights and Forecast 2021-2033
- 5.1. Market Analysis, Insights and Forecast - by Production Analysis
- 5.2. Market Analysis, Insights and Forecast - by Consumption Analysis
- 5.3. Market Analysis, Insights and Forecast - by Import Market Analysis (Value & Volume)
- 5.4. Market Analysis, Insights and Forecast - by Export Market Analysis (Value & Volume)
- 5.5. Market Analysis, Insights and Forecast - by Price Trend Analysis
- 5.6. Market Analysis, Insights and Forecast - by Region
- 5.6.1. North America
- 5.6.2. South America
- 5.6.3. Europe
- 5.6.4. Middle East & Africa
- 5.6.5. Asia Pacific
- 6. Global EMEA Secondary Macronutrients Market Analysis, Insights and Forecast, 2021-2033
- 6.1. Market Analysis, Insights and Forecast - by Production Analysis
- 6.2. Market Analysis, Insights and Forecast - by Consumption Analysis
- 6.3. Market Analysis, Insights and Forecast - by Import Market Analysis (Value & Volume)
- 6.4. Market Analysis, Insights and Forecast - by Export Market Analysis (Value & Volume)
- 6.5. Market Analysis, Insights and Forecast - by Price Trend Analysis
- 7. North America EMEA Secondary Macronutrients Market Analysis, Insights and Forecast, 2020-2032
- 7.1. Market Analysis, Insights and Forecast - by Production Analysis
- 7.2. Market Analysis, Insights and Forecast - by Consumption Analysis
- 7.3. Market Analysis, Insights and Forecast - by Import Market Analysis (Value & Volume)
- 7.4. Market Analysis, Insights and Forecast - by Export Market Analysis (Value & Volume)
- 7.5. Market Analysis, Insights and Forecast - by Price Trend Analysis
- 8. South America EMEA Secondary Macronutrients Market Analysis, Insights and Forecast, 2020-2032
- 8.1. Market Analysis, Insights and Forecast - by Production Analysis
- 8.2. Market Analysis, Insights and Forecast - by Consumption Analysis
- 8.3. Market Analysis, Insights and Forecast - by Import Market Analysis (Value & Volume)
- 8.4. Market Analysis, Insights and Forecast - by Export Market Analysis (Value & Volume)
- 8.5. Market Analysis, Insights and Forecast - by Price Trend Analysis
- 9. Europe EMEA Secondary Macronutrients Market Analysis, Insights and Forecast, 2020-2032
- 9.1. Market Analysis, Insights and Forecast - by Production Analysis
- 9.2. Market Analysis, Insights and Forecast - by Consumption Analysis
- 9.3. Market Analysis, Insights and Forecast - by Import Market Analysis (Value & Volume)
- 9.4. Market Analysis, Insights and Forecast - by Export Market Analysis (Value & Volume)
- 9.5. Market Analysis, Insights and Forecast - by Price Trend Analysis
- 10. Middle East & Africa EMEA Secondary Macronutrients Market Analysis, Insights and Forecast, 2020-2032
- 10.1. Market Analysis, Insights and Forecast - by Production Analysis
- 10.2. Market Analysis, Insights and Forecast - by Consumption Analysis
- 10.3. Market Analysis, Insights and Forecast - by Import Market Analysis (Value & Volume)
- 10.4. Market Analysis, Insights and Forecast - by Export Market Analysis (Value & Volume)
- 10.5. Market Analysis, Insights and Forecast - by Price Trend Analysis
- 11. Asia Pacific EMEA Secondary Macronutrients Market Analysis, Insights and Forecast, 2020-2032
- 11.1. Market Analysis, Insights and Forecast - by Production Analysis
- 11.2. Market Analysis, Insights and Forecast - by Consumption Analysis
- 11.3. Market Analysis, Insights and Forecast - by Import Market Analysis (Value & Volume)
- 11.4. Market Analysis, Insights and Forecast - by Export Market Analysis (Value & Volume)
- 11.5. Market Analysis, Insights and Forecast - by Price Trend Analysis
- 12. Competitive Analysis
- 12.1. Company Profiles
- 12.1.1 Haifa Group
- 12.1.1.1. Company Overview
- 12.1.1.2. Products
- 12.1.1.3. Company Financials
- 12.1.1.4. SWOT Analysis
- 12.1.2 Eurochem Group AG
- 12.1.2.1. Company Overview
- 12.1.2.2. Products
- 12.1.2.3. Company Financials
- 12.1.2.4. SWOT Analysis
- 12.1.3 K+S Company
- 12.1.3.1. Company Overview
- 12.1.3.2. Products
- 12.1.3.3. Company Financials
- 12.1.3.4. SWOT Analysis
- 12.1.4 Trade Corporation International SA
- 12.1.4.1. Company Overview
- 12.1.4.2. Products
- 12.1.4.3. Company Financials
- 12.1.4.4. SWOT Analysis
- 12.1.5 SAF Sulphur Company
- 12.1.5.1. Company Overview
- 12.1.5.2. Products
- 12.1.5.3. Company Financials
- 12.1.5.4. SWOT Analysis
- 12.1.6 Saudi United Fertilizer Company (al-asmida)
- 12.1.6.1. Company Overview
- 12.1.6.2. Products
- 12.1.6.3. Company Financials
- 12.1.6.4. SWOT Analysis
- 12.1.7 Al-tayseer Chemical Industry
- 12.1.7.1. Company Overview
- 12.1.7.2. Products
- 12.1.7.3. Company Financials
- 12.1.7.4. SWOT Analysis
- 12.1.8 Israel Chemical Company
- 12.1.8.1. Company Overview
- 12.1.8.2. Products
- 12.1.8.3. Company Financials
- 12.1.8.4. SWOT Analysis
- 12.1.9 Takamul National Agriculture
- 12.1.9.1. Company Overview
- 12.1.9.2. Products
- 12.1.9.3. Company Financials
- 12.1.9.4. SWOT Analysis
- 12.1.10 Yara International ASA
- 12.1.10.1. Company Overview
- 12.1.10.2. Products
- 12.1.10.3. Company Financials
- 12.1.10.4. SWOT Analysis
- 12.1.1 Haifa Group
- 12.2. Market Entropy
- 12.2.1 Company's Key Areas Served
- 12.2.2 Recent Developments
- 12.3. Company Market Share Analysis 2025
- 12.3.1 Top 5 Companies Market Share Analysis
- 12.3.2 Top 3 Companies Market Share Analysis
- 12.4. List of Potential Customers
- 13. Research Methodology
List of Figures
- Figure 1: Global EMEA Secondary Macronutrients Market Revenue Breakdown (Million, %) by Region 2025 & 2033
- Figure 2: North America EMEA Secondary Macronutrients Market Revenue (Million), by Production Analysis 2025 & 2033
- Figure 3: North America EMEA Secondary Macronutrients Market Revenue Share (%), by Production Analysis 2025 & 2033
- Figure 4: North America EMEA Secondary Macronutrients Market Revenue (Million), by Consumption Analysis 2025 & 2033
- Figure 5: North America EMEA Secondary Macronutrients Market Revenue Share (%), by Consumption Analysis 2025 & 2033
- Figure 6: North America EMEA Secondary Macronutrients Market Revenue (Million), by Import Market Analysis (Value & Volume) 2025 & 2033
- Figure 7: North America EMEA Secondary Macronutrients Market Revenue Share (%), by Import Market Analysis (Value & Volume) 2025 & 2033
- Figure 8: North America EMEA Secondary Macronutrients Market Revenue (Million), by Export Market Analysis (Value & Volume) 2025 & 2033
- Figure 9: North America EMEA Secondary Macronutrients Market Revenue Share (%), by Export Market Analysis (Value & Volume) 2025 & 2033
- Figure 10: North America EMEA Secondary Macronutrients Market Revenue (Million), by Price Trend Analysis 2025 & 2033
- Figure 11: North America EMEA Secondary Macronutrients Market Revenue Share (%), by Price Trend Analysis 2025 & 2033
- Figure 12: North America EMEA Secondary Macronutrients Market Revenue (Million), by Country 2025 & 2033
- Figure 13: North America EMEA Secondary Macronutrients Market Revenue Share (%), by Country 2025 & 2033
- Figure 14: South America EMEA Secondary Macronutrients Market Revenue (Million), by Production Analysis 2025 & 2033
- Figure 15: South America EMEA Secondary Macronutrients Market Revenue Share (%), by Production Analysis 2025 & 2033
- Figure 16: South America EMEA Secondary Macronutrients Market Revenue (Million), by Consumption Analysis 2025 & 2033
- Figure 17: South America EMEA Secondary Macronutrients Market Revenue Share (%), by Consumption Analysis 2025 & 2033
- Figure 18: South America EMEA Secondary Macronutrients Market Revenue (Million), by Import Market Analysis (Value & Volume) 2025 & 2033
- Figure 19: South America EMEA Secondary Macronutrients Market Revenue Share (%), by Import Market Analysis (Value & Volume) 2025 & 2033
- Figure 20: South America EMEA Secondary Macronutrients Market Revenue (Million), by Export Market Analysis (Value & Volume) 2025 & 2033
- Figure 21: South America EMEA Secondary Macronutrients Market Revenue Share (%), by Export Market Analysis (Value & Volume) 2025 & 2033
- Figure 22: South America EMEA Secondary Macronutrients Market Revenue (Million), by Price Trend Analysis 2025 & 2033
- Figure 23: South America EMEA Secondary Macronutrients Market Revenue Share (%), by Price Trend Analysis 2025 & 2033
- Figure 24: South America EMEA Secondary Macronutrients Market Revenue (Million), by Country 2025 & 2033
- Figure 25: South America EMEA Secondary Macronutrients Market Revenue Share (%), by Country 2025 & 2033
- Figure 26: Europe EMEA Secondary Macronutrients Market Revenue (Million), by Production Analysis 2025 & 2033
- Figure 27: Europe EMEA Secondary Macronutrients Market Revenue Share (%), by Production Analysis 2025 & 2033
- Figure 28: Europe EMEA Secondary Macronutrients Market Revenue (Million), by Consumption Analysis 2025 & 2033
- Figure 29: Europe EMEA Secondary Macronutrients Market Revenue Share (%), by Consumption Analysis 2025 & 2033
- Figure 30: Europe EMEA Secondary Macronutrients Market Revenue (Million), by Import Market Analysis (Value & Volume) 2025 & 2033
- Figure 31: Europe EMEA Secondary Macronutrients Market Revenue Share (%), by Import Market Analysis (Value & Volume) 2025 & 2033
- Figure 32: Europe EMEA Secondary Macronutrients Market Revenue (Million), by Export Market Analysis (Value & Volume) 2025 & 2033
- Figure 33: Europe EMEA Secondary Macronutrients Market Revenue Share (%), by Export Market Analysis (Value & Volume) 2025 & 2033
- Figure 34: Europe EMEA Secondary Macronutrients Market Revenue (Million), by Price Trend Analysis 2025 & 2033
- Figure 35: Europe EMEA Secondary Macronutrients Market Revenue Share (%), by Price Trend Analysis 2025 & 2033
- Figure 36: Europe EMEA Secondary Macronutrients Market Revenue (Million), by Country 2025 & 2033
- Figure 37: Europe EMEA Secondary Macronutrients Market Revenue Share (%), by Country 2025 & 2033
- Figure 38: Middle East & Africa EMEA Secondary Macronutrients Market Revenue (Million), by Production Analysis 2025 & 2033
- Figure 39: Middle East & Africa EMEA Secondary Macronutrients Market Revenue Share (%), by Production Analysis 2025 & 2033
- Figure 40: Middle East & Africa EMEA Secondary Macronutrients Market Revenue (Million), by Consumption Analysis 2025 & 2033
- Figure 41: Middle East & Africa EMEA Secondary Macronutrients Market Revenue Share (%), by Consumption Analysis 2025 & 2033
- Figure 42: Middle East & Africa EMEA Secondary Macronutrients Market Revenue (Million), by Import Market Analysis (Value & Volume) 2025 & 2033
- Figure 43: Middle East & Africa EMEA Secondary Macronutrients Market Revenue Share (%), by Import Market Analysis (Value & Volume) 2025 & 2033
- Figure 44: Middle East & Africa EMEA Secondary Macronutrients Market Revenue (Million), by Export Market Analysis (Value & Volume) 2025 & 2033
- Figure 45: Middle East & Africa EMEA Secondary Macronutrients Market Revenue Share (%), by Export Market Analysis (Value & Volume) 2025 & 2033
- Figure 46: Middle East & Africa EMEA Secondary Macronutrients Market Revenue (Million), by Price Trend Analysis 2025 & 2033
- Figure 47: Middle East & Africa EMEA Secondary Macronutrients Market Revenue Share (%), by Price Trend Analysis 2025 & 2033
- Figure 48: Middle East & Africa EMEA Secondary Macronutrients Market Revenue (Million), by Country 2025 & 2033
- Figure 49: Middle East & Africa EMEA Secondary Macronutrients Market Revenue Share (%), by Country 2025 & 2033
- Figure 50: Asia Pacific EMEA Secondary Macronutrients Market Revenue (Million), by Production Analysis 2025 & 2033
- Figure 51: Asia Pacific EMEA Secondary Macronutrients Market Revenue Share (%), by Production Analysis 2025 & 2033
- Figure 52: Asia Pacific EMEA Secondary Macronutrients Market Revenue (Million), by Consumption Analysis 2025 & 2033
- Figure 53: Asia Pacific EMEA Secondary Macronutrients Market Revenue Share (%), by Consumption Analysis 2025 & 2033
- Figure 54: Asia Pacific EMEA Secondary Macronutrients Market Revenue (Million), by Import Market Analysis (Value & Volume) 2025 & 2033
- Figure 55: Asia Pacific EMEA Secondary Macronutrients Market Revenue Share (%), by Import Market Analysis (Value & Volume) 2025 & 2033
- Figure 56: Asia Pacific EMEA Secondary Macronutrients Market Revenue (Million), by Export Market Analysis (Value & Volume) 2025 & 2033
- Figure 57: Asia Pacific EMEA Secondary Macronutrients Market Revenue Share (%), by Export Market Analysis (Value & Volume) 2025 & 2033
- Figure 58: Asia Pacific EMEA Secondary Macronutrients Market Revenue (Million), by Price Trend Analysis 2025 & 2033
- Figure 59: Asia Pacific EMEA Secondary Macronutrients Market Revenue Share (%), by Price Trend Analysis 2025 & 2033
- Figure 60: Asia Pacific EMEA Secondary Macronutrients Market Revenue (Million), by Country 2025 & 2033
- Figure 61: Asia Pacific EMEA Secondary Macronutrients Market Revenue Share (%), by Country 2025 & 2033
List of Tables
- Table 1: Global EMEA Secondary Macronutrients Market Revenue Million Forecast, by Production Analysis 2020 & 2033
- Table 2: Global EMEA Secondary Macronutrients Market Revenue Million Forecast, by Consumption Analysis 2020 & 2033
- Table 3: Global EMEA Secondary Macronutrients Market Revenue Million Forecast, by Import Market Analysis (Value & Volume) 2020 & 2033
- Table 4: Global EMEA Secondary Macronutrients Market Revenue Million Forecast, by Export Market Analysis (Value & Volume) 2020 & 2033
- Table 5: Global EMEA Secondary Macronutrients Market Revenue Million Forecast, by Price Trend Analysis 2020 & 2033
- Table 6: Global EMEA Secondary Macronutrients Market Revenue Million Forecast, by Region 2020 & 2033
- Table 7: Global EMEA Secondary Macronutrients Market Revenue Million Forecast, by Production Analysis 2020 & 2033
- Table 8: Global EMEA Secondary Macronutrients Market Revenue Million Forecast, by Consumption Analysis 2020 & 2033
- Table 9: Global EMEA Secondary Macronutrients Market Revenue Million Forecast, by Import Market Analysis (Value & Volume) 2020 & 2033
- Table 10: Global EMEA Secondary Macronutrients Market Revenue Million Forecast, by Export Market Analysis (Value & Volume) 2020 & 2033
- Table 11: Global EMEA Secondary Macronutrients Market Revenue Million Forecast, by Price Trend Analysis 2020 & 2033
- Table 12: Global EMEA Secondary Macronutrients Market Revenue Million Forecast, by Country 2020 & 2033
- Table 13: United States EMEA Secondary Macronutrients Market Revenue (Million) Forecast, by Application 2020 & 2033
- Table 14: Canada EMEA Secondary Macronutrients Market Revenue (Million) Forecast, by Application 2020 & 2033
- Table 15: Mexico EMEA Secondary Macronutrients Market Revenue (Million) Forecast, by Application 2020 & 2033
- Table 16: Global EMEA Secondary Macronutrients Market Revenue Million Forecast, by Production Analysis 2020 & 2033
- Table 17: Global EMEA Secondary Macronutrients Market Revenue Million Forecast, by Consumption Analysis 2020 & 2033
- Table 18: Global EMEA Secondary Macronutrients Market Revenue Million Forecast, by Import Market Analysis (Value & Volume) 2020 & 2033
- Table 19: Global EMEA Secondary Macronutrients Market Revenue Million Forecast, by Export Market Analysis (Value & Volume) 2020 & 2033
- Table 20: Global EMEA Secondary Macronutrients Market Revenue Million Forecast, by Price Trend Analysis 2020 & 2033
- Table 21: Global EMEA Secondary Macronutrients Market Revenue Million Forecast, by Country 2020 & 2033
- Table 22: Brazil EMEA Secondary Macronutrients Market Revenue (Million) Forecast, by Application 2020 & 2033
- Table 23: Argentina EMEA Secondary Macronutrients Market Revenue (Million) Forecast, by Application 2020 & 2033
- Table 24: Rest of South America EMEA Secondary Macronutrients Market Revenue (Million) Forecast, by Application 2020 & 2033
- Table 25: Global EMEA Secondary Macronutrients Market Revenue Million Forecast, by Production Analysis 2020 & 2033
- Table 26: Global EMEA Secondary Macronutrients Market Revenue Million Forecast, by Consumption Analysis 2020 & 2033
- Table 27: Global EMEA Secondary Macronutrients Market Revenue Million Forecast, by Import Market Analysis (Value & Volume) 2020 & 2033
- Table 28: Global EMEA Secondary Macronutrients Market Revenue Million Forecast, by Export Market Analysis (Value & Volume) 2020 & 2033
- Table 29: Global EMEA Secondary Macronutrients Market Revenue Million Forecast, by Price Trend Analysis 2020 & 2033
- Table 30: Global EMEA Secondary Macronutrients Market Revenue Million Forecast, by Country 2020 & 2033
- Table 31: United Kingdom EMEA Secondary Macronutrients Market Revenue (Million) Forecast, by Application 2020 & 2033
- Table 32: Germany EMEA Secondary Macronutrients Market Revenue (Million) Forecast, by Application 2020 & 2033
- Table 33: France EMEA Secondary Macronutrients Market Revenue (Million) Forecast, by Application 2020 & 2033
- Table 34: Italy EMEA Secondary Macronutrients Market Revenue (Million) Forecast, by Application 2020 & 2033
- Table 35: Spain EMEA Secondary Macronutrients Market Revenue (Million) Forecast, by Application 2020 & 2033
- Table 36: Russia EMEA Secondary Macronutrients Market Revenue (Million) Forecast, by Application 2020 & 2033
- Table 37: Benelux EMEA Secondary Macronutrients Market Revenue (Million) Forecast, by Application 2020 & 2033
- Table 38: Nordics EMEA Secondary Macronutrients Market Revenue (Million) Forecast, by Application 2020 & 2033
- Table 39: Rest of Europe EMEA Secondary Macronutrients Market Revenue (Million) Forecast, by Application 2020 & 2033
- Table 40: Global EMEA Secondary Macronutrients Market Revenue Million Forecast, by Production Analysis 2020 & 2033
- Table 41: Global EMEA Secondary Macronutrients Market Revenue Million Forecast, by Consumption Analysis 2020 & 2033
- Table 42: Global EMEA Secondary Macronutrients Market Revenue Million Forecast, by Import Market Analysis (Value & Volume) 2020 & 2033
- Table 43: Global EMEA Secondary Macronutrients Market Revenue Million Forecast, by Export Market Analysis (Value & Volume) 2020 & 2033
- Table 44: Global EMEA Secondary Macronutrients Market Revenue Million Forecast, by Price Trend Analysis 2020 & 2033
- Table 45: Global EMEA Secondary Macronutrients Market Revenue Million Forecast, by Country 2020 & 2033
- Table 46: Turkey EMEA Secondary Macronutrients Market Revenue (Million) Forecast, by Application 2020 & 2033
- Table 47: Israel EMEA Secondary Macronutrients Market Revenue (Million) Forecast, by Application 2020 & 2033
- Table 48: GCC EMEA Secondary Macronutrients Market Revenue (Million) Forecast, by Application 2020 & 2033
- Table 49: North Africa EMEA Secondary Macronutrients Market Revenue (Million) Forecast, by Application 2020 & 2033
- Table 50: South Africa EMEA Secondary Macronutrients Market Revenue (Million) Forecast, by Application 2020 & 2033
- Table 51: Rest of Middle East & Africa EMEA Secondary Macronutrients Market Revenue (Million) Forecast, by Application 2020 & 2033
- Table 52: Global EMEA Secondary Macronutrients Market Revenue Million Forecast, by Production Analysis 2020 & 2033
- Table 53: Global EMEA Secondary Macronutrients Market Revenue Million Forecast, by Consumption Analysis 2020 & 2033
- Table 54: Global EMEA Secondary Macronutrients Market Revenue Million Forecast, by Import Market Analysis (Value & Volume) 2020 & 2033
- Table 55: Global EMEA Secondary Macronutrients Market Revenue Million Forecast, by Export Market Analysis (Value & Volume) 2020 & 2033
- Table 56: Global EMEA Secondary Macronutrients Market Revenue Million Forecast, by Price Trend Analysis 2020 & 2033
- Table 57: Global EMEA Secondary Macronutrients Market Revenue Million Forecast, by Country 2020 & 2033
- Table 58: China EMEA Secondary Macronutrients Market Revenue (Million) Forecast, by Application 2020 & 2033
- Table 59: India EMEA Secondary Macronutrients Market Revenue (Million) Forecast, by Application 2020 & 2033
- Table 60: Japan EMEA Secondary Macronutrients Market Revenue (Million) Forecast, by Application 2020 & 2033
- Table 61: South Korea EMEA Secondary Macronutrients Market Revenue (Million) Forecast, by Application 2020 & 2033
- Table 62: ASEAN EMEA Secondary Macronutrients Market Revenue (Million) Forecast, by Application 2020 & 2033
- Table 63: Oceania EMEA Secondary Macronutrients Market Revenue (Million) Forecast, by Application 2020 & 2033
- Table 64: Rest of Asia Pacific EMEA Secondary Macronutrients Market Revenue (Million) Forecast, by Application 2020 & 2033
Frequently Asked Questions
1. What is the projected Compound Annual Growth Rate (CAGR) of the EMEA Secondary Macronutrients Market?
The projected CAGR is approximately 4.20%.
2. Which companies are prominent players in the EMEA Secondary Macronutrients Market?
Key companies in the market include Haifa Group, Eurochem Group AG, K+S Company, Trade Corporation International SA, SAF Sulphur Company, Saudi United Fertilizer Company (al-asmida), Al-tayseer Chemical Industry, Israel Chemical Company, Takamul National Agriculture, Yara International ASA.
3. What are the main segments of the EMEA Secondary Macronutrients Market?
The market segments include Production Analysis, Consumption Analysis, Import Market Analysis (Value & Volume), Export Market Analysis (Value & Volume), Price Trend Analysis.
4. Can you provide details about the market size?
The market size is estimated to be USD 4.23 Million as of 2022.
5. What are some drivers contributing to market growth?
Seed Treatment As A Solution To Enhance Yield; Growing Awareness For Seed Treatment Among The Farmers; Rising Trend Of Organic Farming.
6. What are the notable trends driving market growth?
Secondary Macronutrients Ensure Healthy Plant Growth.
7. Are there any restraints impacting market growth?
Limitations Across Farm-Level Seed Treatment; Rising Environmental Concerns.
8. Can you provide examples of recent developments in the market?
N/A
9. What pricing options are available for accessing the report?
Pricing options include single-user, multi-user, and enterprise licenses priced at USD 4750, USD 5250, and USD 8750 respectively.
10. Is the market size provided in terms of value or volume?
The market size is provided in terms of value, measured in Million.
11. Are there any specific market keywords associated with the report?
Yes, the market keyword associated with the report is "EMEA Secondary Macronutrients Market," which aids in identifying and referencing the specific market segment covered.
12. How do I determine which pricing option suits my needs best?
The pricing options vary based on user requirements and access needs. Individual users may opt for single-user licenses, while businesses requiring broader access may choose multi-user or enterprise licenses for cost-effective access to the report.
13. Are there any additional resources or data provided in the EMEA Secondary Macronutrients Market report?
While the report offers comprehensive insights, it's advisable to review the specific contents or supplementary materials provided to ascertain if additional resources or data are available.
14. How can I stay updated on further developments or reports in the EMEA Secondary Macronutrients Market?
To stay informed about further developments, trends, and reports in the EMEA Secondary Macronutrients Market, consider subscribing to industry newsletters, following relevant companies and organizations, or regularly checking reputable industry news sources and publications.
Methodology
Step 1 - Identification of Relevant Samples Size from Population Database


Step 2 - Approaches for Defining Global Market Size (Value, Volume* & Price*)

Note*: In applicable scenarios
Step 3 - Data Sources
Primary Research
- Web Analytics
- Survey Reports
- Research Institute
- Latest Research Reports
- Opinion Leaders
Secondary Research
- Annual Reports
- White Paper
- Latest Press Release
- Industry Association
- Paid Database
- Investor Presentations

Step 4 - Data Triangulation
Involves using different sources of information in order to increase the validity of a study
These sources are likely to be stakeholders in a program - participants, other researchers, program staff, other community members, and so on.
Then we put all data in single framework & apply various statistical tools to find out the dynamic on the market.
During the analysis stage, feedback from the stakeholder groups would be compared to determine areas of agreement as well as areas of divergence