

Key Insights
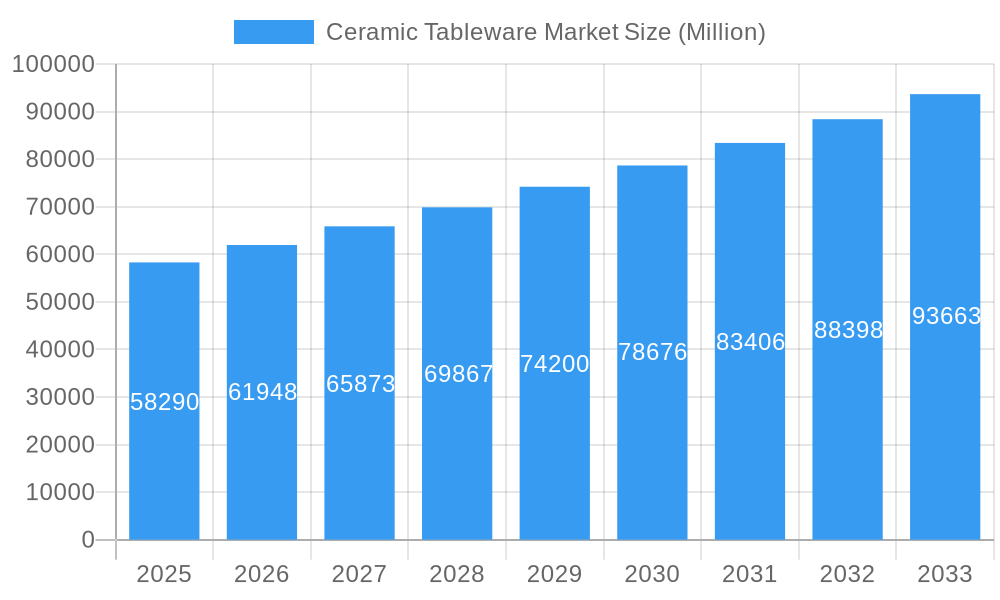
The global ceramic tableware market, valued at $58.29 billion in 2025, is projected to experience robust growth, exhibiting a Compound Annual Growth Rate (CAGR) of 6.21% from 2025 to 2033. This expansion is fueled by several key drivers. Rising disposable incomes in developing economies are leading to increased consumer spending on home goods, including premium ceramic tableware. The growing popularity of casual dining and home entertaining further boosts demand. Simultaneously, evolving consumer preferences towards sustainable and eco-friendly products are driving innovation in materials and manufacturing processes. The market is segmented by material type (porcelain and bone china, stoneware, others), end-user (household, commercial), and distribution channel (supermarkets, specialty stores, online, wholesalers). Porcelain and bone china currently hold a significant market share due to their durability and aesthetic appeal, but stoneware is gaining traction due to its cost-effectiveness and versatility. The online channel is rapidly expanding, offering convenience and wider product choices to consumers. Geographic expansion is also notable, with Asia-Pacific exhibiting strong growth potential owing to its large and rapidly growing middle class.
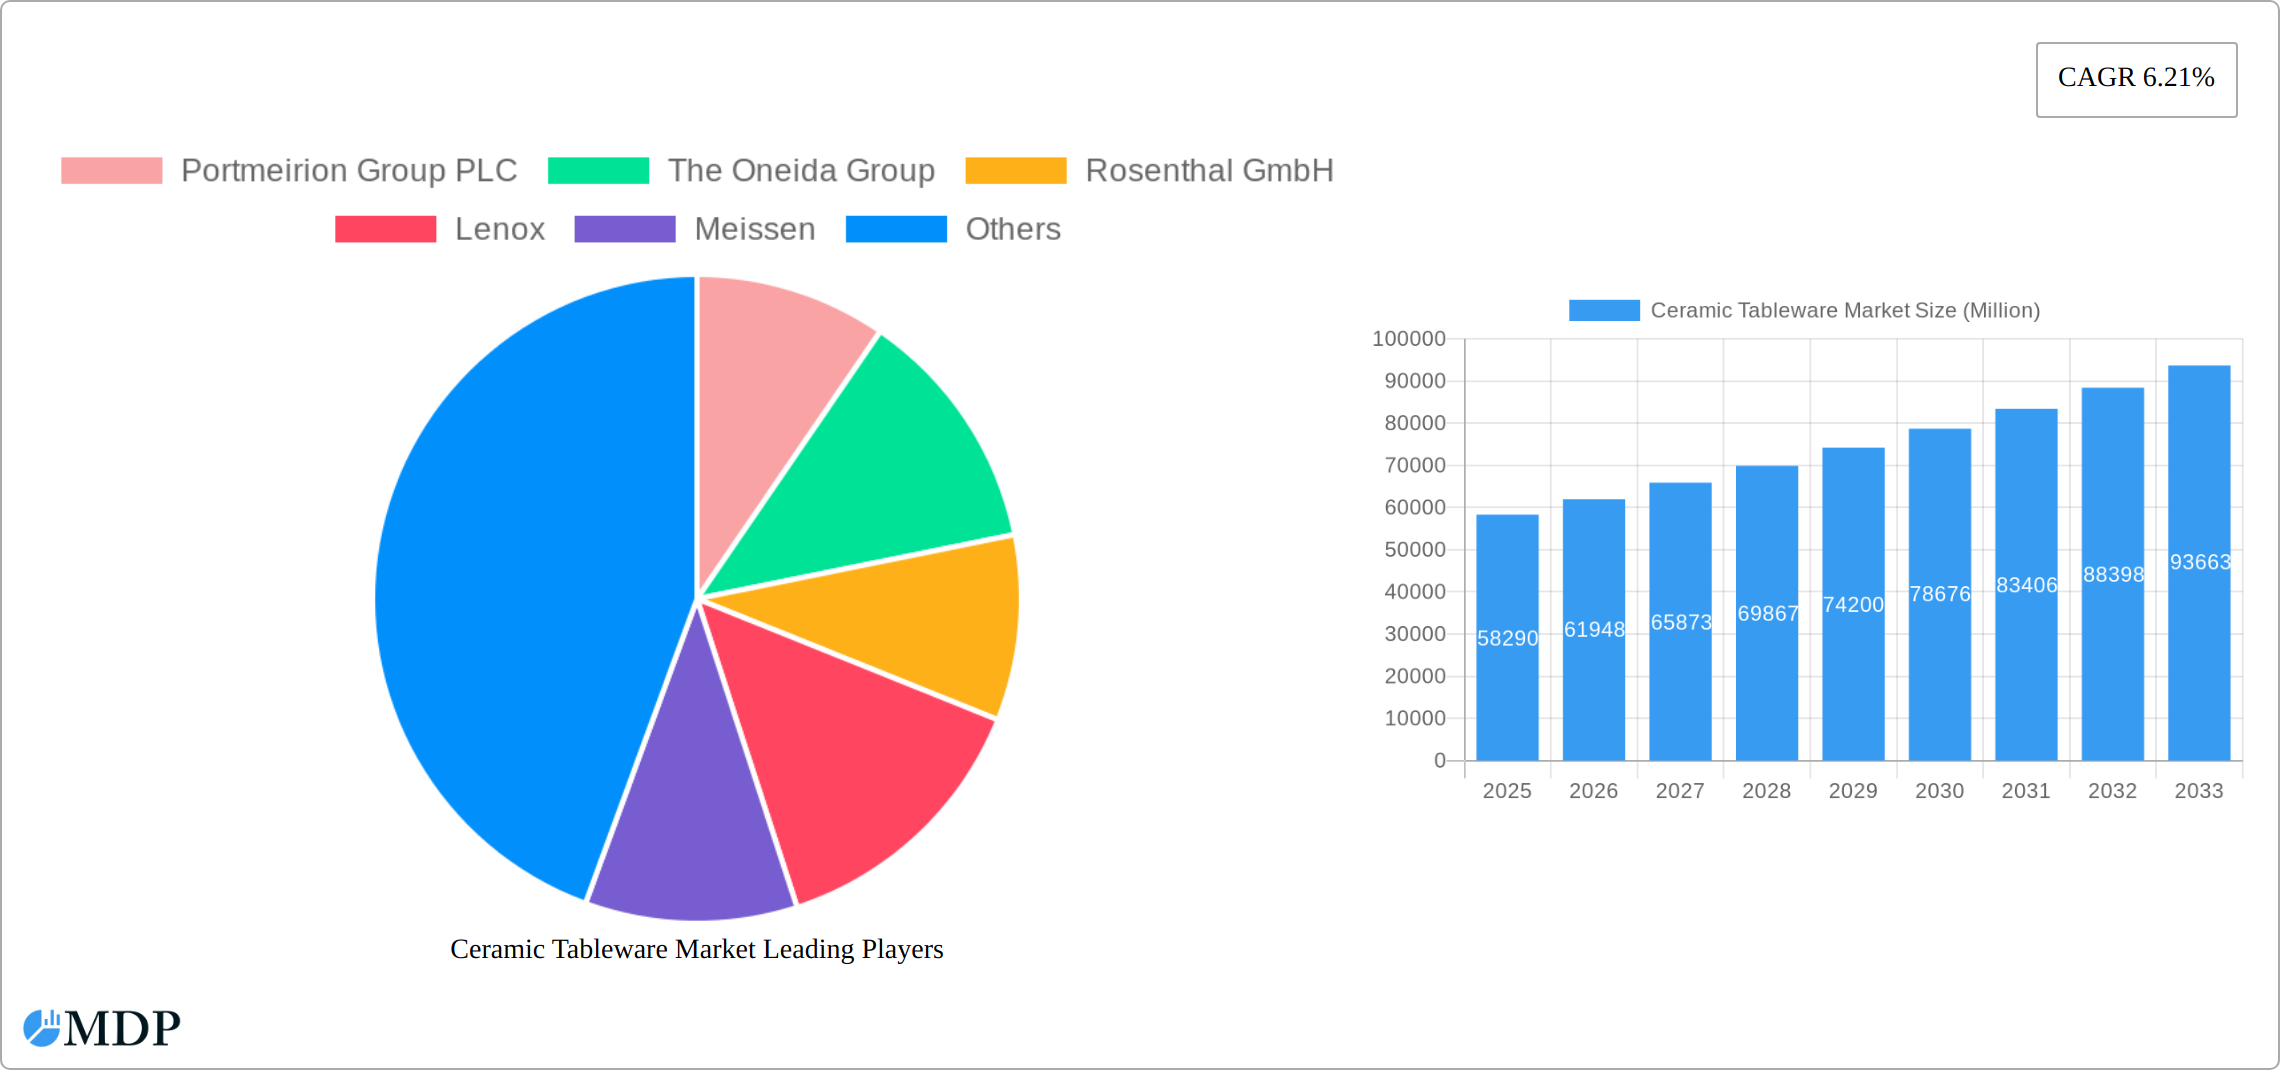
Ceramic Tableware Market Market Size (In Billion)
However, the market faces certain challenges. Fluctuations in raw material prices, particularly clay and glaze, can impact profitability. Intense competition among established players and emerging brands necessitates continuous innovation and differentiation strategies. Furthermore, the increasing prevalence of disposable tableware presents a threat to the overall market. Despite these restraints, the long-term outlook for the ceramic tableware market remains positive, driven by factors such as changing lifestyles, increased urbanization, and the growing emphasis on enhancing the dining experience. Strategic partnerships, product diversification, and efficient supply chain management will be critical for success in this dynamic market. Key players, including Portmeirion Group PLC, The Oneida Group, and Rosenthal GmbH, are actively investing in research and development to introduce innovative designs and materials, thereby maintaining their competitive edge.
Ceramic Tableware Market Company Market Share
Dive Deep into the Lucrative Ceramic Tableware Market: A Comprehensive Report (2019-2033)
This comprehensive report provides an in-depth analysis of the global Ceramic Tableware Market, offering invaluable insights for industry stakeholders, investors, and strategic decision-makers. With a study period spanning 2019-2033, a base year of 2025, and a forecast period of 2025-2033, this report unveils the market's current dynamics, future trajectory, and key players shaping its evolution. The market size is projected at xx Million in 2025 and is expected to witness significant growth over the forecast period.
Ceramic Tableware Market Market Dynamics & Concentration
The global ceramic tableware market exhibits a moderately concentrated landscape, with key players like Portmeirion Group PLC, The Oneida Group, Rosenthal GmbH, and Lenox holding significant market share. Innovation in design, material science (e.g., lightweight yet durable porcelain), and manufacturing processes are driving market growth. Stringent regulatory frameworks concerning food safety and environmental sustainability influence manufacturing practices. The market also faces competition from substitute materials like melamine and plastic, especially in the commercial sector. End-user preferences are shifting towards sustainable and aesthetically pleasing tableware, influencing product development. The historical period (2019-2024) witnessed xx M&A deals, indicating consolidation within the industry. Market share data reveals that the top five players collectively account for approximately xx% of the global market.
- Innovation Drivers: Sustainable materials, innovative designs, smart tableware concepts.
- Regulatory Landscape: Food safety standards, environmental regulations impacting material sourcing and manufacturing.
- Product Substitutes: Melamine, plastic, and other materials offering cost advantages.
- End-User Trends: Growing demand for aesthetically pleasing, durable, and sustainable tableware.
- M&A Activity: Consolidation among key players through mergers and acquisitions (xx deals from 2019-2024).
Ceramic Tableware Market Industry Trends & Analysis
The ceramic tableware market is experiencing a Compound Annual Growth Rate (CAGR) of xx% during the forecast period (2025-2033). Key growth drivers include rising disposable incomes in emerging economies, increasing demand for premium tableware, and the growing popularity of home cooking and entertaining. Technological advancements such as 3D printing are opening new avenues for customized designs and production efficiencies. Consumer preferences are leaning towards eco-friendly and ethically sourced products, creating opportunities for manufacturers committed to sustainability. Intense competition necessitates continuous innovation and diversification of product portfolios. Market penetration of premium tableware is steadily increasing, particularly in developed nations, while demand for affordable options remains strong in developing markets.
Leading Markets & Segments in Ceramic Tableware Market
The Asia-Pacific region currently dominates the ceramic tableware market, driven by factors such as a large and growing middle class, robust economic growth in countries like China and India, and expanding hospitality and food service sectors. Within the segment breakdown:
- Type: Porcelain and Bone China remains the leading segment due to its aesthetic appeal and durability.
- End User: The household segment accounts for a significant share of the market, while the commercial segment is projected to exhibit strong growth.
- Distribution Channel: Online sales are witnessing significant growth, complemented by strong presence in supermarkets & hypermarkets and specialty stores.
Key Drivers by Region:
- Asia-Pacific: Rapid urbanization, rising disposable incomes, and a large consumer base.
- Europe: Established culinary culture, emphasis on quality and design, and significant tourism sector.
- North America: High disposable income, preference for premium tableware, and a strong hospitality sector.
Ceramic Tableware Market Product Developments
The ceramic tableware market is experiencing a wave of innovation, driven by a focus on creating lightweight, durable, and microwave-safe products. Modern designs prioritize both aesthetics and functionality, catering to a broad spectrum of consumer tastes and lifestyles. Significant advancements in manufacturing processes have resulted in increased production efficiency and reduced costs, making high-quality ceramic tableware more accessible. A notable trend is the growing emphasis on sustainability and ethical sourcing of materials, coupled with innovative surface treatments that enhance durability and resistance to stains. This commitment to eco-consciousness directly addresses the rising consumer demand for environmentally friendly products. Furthermore, we're seeing the emergence of smart tableware incorporating technology for enhanced functionality and user experience.
Key Drivers of Ceramic Tableware Market Growth
Several factors are propelling the growth of the ceramic tableware market:
- Rising Disposable Incomes and Changing Consumer Preferences: Increased purchasing power, particularly in developing economies, fuels demand for higher-quality and aesthetically pleasing tableware. This is further amplified by shifting lifestyle trends, such as an increased focus on home cooking and entertaining.
- Technological Advancements in Manufacturing and Design: Innovations in manufacturing techniques, materials science, and design aesthetics continuously improve product quality, durability, and efficiency, leading to more attractive and functional tableware options.
- E-commerce Expansion and Global Reach: The growth of online retail platforms significantly expands market reach, enabling brands to connect with a wider consumer base globally and facilitating the sale of specialized or niche tableware items.
Challenges in the Ceramic Tableware Market Market
The industry faces challenges such as:
- Fluctuating Raw Material Prices: Increases in the cost of clay and other raw materials impact production costs.
- Intense Competition: The market is characterized by a diverse range of players, leading to price competition.
- Supply Chain Disruptions: Global events and geopolitical instability can disrupt the supply chain, impacting production and delivery.
Emerging Opportunities in Ceramic Tableware Market
The ceramic tableware market presents significant opportunities for growth and expansion:
- Expansion into Untapped Markets: Developing economies represent a vast, largely untapped market with substantial growth potential for ceramic tableware manufacturers.
- Strategic Partnerships and Collaborations: Joint ventures and collaborations can leverage the expertise and resources of different companies, fostering innovation and expanding market reach.
- Premiumization and Niche Product Development: Catering to discerning consumers with high-end, handcrafted, or uniquely designed tableware offers opportunities for premium pricing and strong brand loyalty.
- Sustainable and Ethical Sourcing Initiatives: The increasing consumer preference for eco-friendly and ethically sourced products presents a key opportunity for manufacturers to differentiate themselves and attract environmentally conscious buyers.
Leading Players in the Ceramic Tableware Market Sector
- Portmeirion Group PLC
- The Oneida Group
- Rosenthal GmbH
- Lenox
- Meissen
- Libbey
- Seltmann Weiden
- RAK Porcelain
- Narumi
- KAHLA Porzellan
- WMF
- SCHONWALD
- Churchill China
- Villeroy & Boch
- TATA ceramics
- Sitong Group
- Fiskars Group
Key Milestones in Ceramic Tableware Market Industry
- 2021: Introduction of innovative eco-friendly ceramic materials by several leading manufacturers marked a significant shift towards sustainable practices.
- 2022: Several major mergers and acquisitions (M&A) activities reshaped the market landscape, consolidating market share among key players.
- 2023: The launch of smart tableware technologies, integrating sensors and connectivity, signaled a new era of technologically advanced tableware.
- Ongoing Trends: The industry continues to witness a strong focus on personalization, customization options, and the development of unique designs to cater to diverse consumer preferences.
Strategic Outlook for Ceramic Tableware Market Market
The ceramic tableware market is poised for significant growth, driven by evolving consumer preferences, technological advancements, and strategic partnerships. Manufacturers focusing on sustainable practices, innovative designs, and expanding into emerging markets are well-positioned to capitalize on the market's potential. The forecast period will witness increased competition and further consolidation, creating opportunities for both large-scale and niche players.
Ceramic Tableware Market Segmentation
-
1. Type
- 1.1. Porcelain and Bone China
- 1.2. Stoneware (Ceramic)
- 1.3. Others
-
2. End User
- 2.1. Household
-
2.2. Commercial
- 2.2.1. Accommodation and Hospitality Segment
- 2.2.2. Food Service Segment
- 2.2.3. Others
-
3. Distribution Channel
- 3.1. Supermarkets & Hypermarkets
- 3.2. Specialty Stores
- 3.3. Wholesalers
- 3.4. Online
- 3.5. Others
Ceramic Tableware Market Segmentation By Geography
- 1. North America
- 2. Asia Pacific
- 3. Europe
- 4. Latin America
- 5. Middle East and Africa
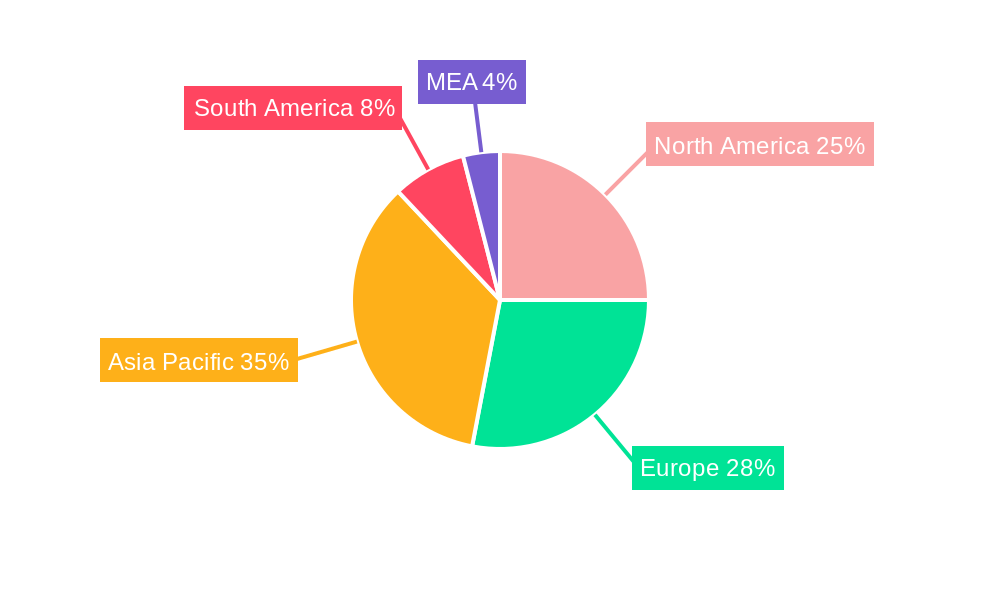
Ceramic Tableware Market Regional Market Share
Geographic Coverage of Ceramic Tableware Market
Ceramic Tableware Market REPORT HIGHLIGHTS
| Aspects | Details |
|---|---|
| Study Period | 2020-2034 |
| Base Year | 2025 |
| Estimated Year | 2026 |
| Forecast Period | 2026-2034 |
| Historical Period | 2020-2025 |
| Growth Rate | CAGR of 6.21% from 2020-2034 |
| Segmentation |
|
Table of Contents
- 1. Introduction
- 1.1. Research Scope
- 1.2. Market Segmentation
- 1.3. Research Objective
- 1.4. Definitions and Assumptions
- 2. Executive Summary
- 2.1. Market Snapshot
- 3. Market Dynamics
- 3.1. Market Drivers
- 3.2. Market Restrains
- 3.3. Market Trends
- 3.4. Market Opportunities
- 4. Market Factor Analysis
- 4.1. Porters Five Forces
- 4.1.1. Bargaining Power of Suppliers
- 4.1.2. Bargaining Power of Buyers
- 4.1.3. Threat of New Entrants
- 4.1.4. Threat of Substitutes
- 4.1.5. Competitive Rivalry
- 4.2. PESTEL analysis
- 4.3. BCG Analysis
- 4.3.1. Stars (High Growth, High Market Share)
- 4.3.2. Cash Cows (Low Growth, High Market Share)
- 4.3.3. Question Mark (High Growth, Low Market Share)
- 4.3.4. Dogs (Low Growth, Low Market Share)
- 4.4. Ansoff Matrix Analysis
- 4.5. Supply Chain Analysis
- 4.6. Regulatory Landscape
- 4.7. Current Market Potential and Opportunity Assessment (TAM–SAM–SOM Framework)
- 4.8. MDP Analyst Note
- 4.1. Porters Five Forces
- 5. Market Analysis, Insights and Forecast 2021-2033
- 5.1. Market Analysis, Insights and Forecast - by Type
- 5.1.1. Porcelain and Bone China
- 5.1.2. Stoneware (Ceramic)
- 5.1.3. Others
- 5.2. Market Analysis, Insights and Forecast - by End User
- 5.2.1. Household
- 5.2.2. Commercial
- 5.2.2.1. Accommodation and Hospitality Segment
- 5.2.2.2. Food Service Segment
- 5.2.2.3. Others
- 5.3. Market Analysis, Insights and Forecast - by Distribution Channel
- 5.3.1. Supermarkets & Hypermarkets
- 5.3.2. Specialty Stores
- 5.3.3. Wholesalers
- 5.3.4. Online
- 5.3.5. Others
- 5.4. Market Analysis, Insights and Forecast - by Region
- 5.4.1. North America
- 5.4.2. Asia Pacific
- 5.4.3. Europe
- 5.4.4. Latin America
- 5.4.5. Middle East and Africa
- 5.1. Market Analysis, Insights and Forecast - by Type
- 6. Global Ceramic Tableware Market Analysis, Insights and Forecast, 2021-2033
- 6.1. Market Analysis, Insights and Forecast - by Type
- 6.1.1. Porcelain and Bone China
- 6.1.2. Stoneware (Ceramic)
- 6.1.3. Others
- 6.2. Market Analysis, Insights and Forecast - by End User
- 6.2.1. Household
- 6.2.2. Commercial
- 6.2.2.1. Accommodation and Hospitality Segment
- 6.2.2.2. Food Service Segment
- 6.2.2.3. Others
- 6.3. Market Analysis, Insights and Forecast - by Distribution Channel
- 6.3.1. Supermarkets & Hypermarkets
- 6.3.2. Specialty Stores
- 6.3.3. Wholesalers
- 6.3.4. Online
- 6.3.5. Others
- 6.1. Market Analysis, Insights and Forecast - by Type
- 7. North America Ceramic Tableware Market Analysis, Insights and Forecast, 2020-2032
- 7.1. Market Analysis, Insights and Forecast - by Type
- 7.1.1. Porcelain and Bone China
- 7.1.2. Stoneware (Ceramic)
- 7.1.3. Others
- 7.2. Market Analysis, Insights and Forecast - by End User
- 7.2.1. Household
- 7.2.2. Commercial
- 7.2.2.1. Accommodation and Hospitality Segment
- 7.2.2.2. Food Service Segment
- 7.2.2.3. Others
- 7.3. Market Analysis, Insights and Forecast - by Distribution Channel
- 7.3.1. Supermarkets & Hypermarkets
- 7.3.2. Specialty Stores
- 7.3.3. Wholesalers
- 7.3.4. Online
- 7.3.5. Others
- 7.1. Market Analysis, Insights and Forecast - by Type
- 8. Asia Pacific Ceramic Tableware Market Analysis, Insights and Forecast, 2020-2032
- 8.1. Market Analysis, Insights and Forecast - by Type
- 8.1.1. Porcelain and Bone China
- 8.1.2. Stoneware (Ceramic)
- 8.1.3. Others
- 8.2. Market Analysis, Insights and Forecast - by End User
- 8.2.1. Household
- 8.2.2. Commercial
- 8.2.2.1. Accommodation and Hospitality Segment
- 8.2.2.2. Food Service Segment
- 8.2.2.3. Others
- 8.3. Market Analysis, Insights and Forecast - by Distribution Channel
- 8.3.1. Supermarkets & Hypermarkets
- 8.3.2. Specialty Stores
- 8.3.3. Wholesalers
- 8.3.4. Online
- 8.3.5. Others
- 8.1. Market Analysis, Insights and Forecast - by Type
- 9. Europe Ceramic Tableware Market Analysis, Insights and Forecast, 2020-2032
- 9.1. Market Analysis, Insights and Forecast - by Type
- 9.1.1. Porcelain and Bone China
- 9.1.2. Stoneware (Ceramic)
- 9.1.3. Others
- 9.2. Market Analysis, Insights and Forecast - by End User
- 9.2.1. Household
- 9.2.2. Commercial
- 9.2.2.1. Accommodation and Hospitality Segment
- 9.2.2.2. Food Service Segment
- 9.2.2.3. Others
- 9.3. Market Analysis, Insights and Forecast - by Distribution Channel
- 9.3.1. Supermarkets & Hypermarkets
- 9.3.2. Specialty Stores
- 9.3.3. Wholesalers
- 9.3.4. Online
- 9.3.5. Others
- 9.1. Market Analysis, Insights and Forecast - by Type
- 10. Latin America Ceramic Tableware Market Analysis, Insights and Forecast, 2020-2032
- 10.1. Market Analysis, Insights and Forecast - by Type
- 10.1.1. Porcelain and Bone China
- 10.1.2. Stoneware (Ceramic)
- 10.1.3. Others
- 10.2. Market Analysis, Insights and Forecast - by End User
- 10.2.1. Household
- 10.2.2. Commercial
- 10.2.2.1. Accommodation and Hospitality Segment
- 10.2.2.2. Food Service Segment
- 10.2.2.3. Others
- 10.3. Market Analysis, Insights and Forecast - by Distribution Channel
- 10.3.1. Supermarkets & Hypermarkets
- 10.3.2. Specialty Stores
- 10.3.3. Wholesalers
- 10.3.4. Online
- 10.3.5. Others
- 10.1. Market Analysis, Insights and Forecast - by Type
- 11. Middle East and Africa Ceramic Tableware Market Analysis, Insights and Forecast, 2020-2032
- 11.1. Market Analysis, Insights and Forecast - by Type
- 11.1.1. Porcelain and Bone China
- 11.1.2. Stoneware (Ceramic)
- 11.1.3. Others
- 11.2. Market Analysis, Insights and Forecast - by End User
- 11.2.1. Household
- 11.2.2. Commercial
- 11.2.2.1. Accommodation and Hospitality Segment
- 11.2.2.2. Food Service Segment
- 11.2.2.3. Others
- 11.3. Market Analysis, Insights and Forecast - by Distribution Channel
- 11.3.1. Supermarkets & Hypermarkets
- 11.3.2. Specialty Stores
- 11.3.3. Wholesalers
- 11.3.4. Online
- 11.3.5. Others
- 11.1. Market Analysis, Insights and Forecast - by Type
- 12. Competitive Analysis
- 12.1. Company Profiles
- 12.1.1 Portmeirion Group PLC
- 12.1.1.1. Company Overview
- 12.1.1.2. Products
- 12.1.1.3. Company Financials
- 12.1.1.4. SWOT Analysis
- 12.1.2 The Oneida Group
- 12.1.2.1. Company Overview
- 12.1.2.2. Products
- 12.1.2.3. Company Financials
- 12.1.2.4. SWOT Analysis
- 12.1.3 Rosenthal GmbH
- 12.1.3.1. Company Overview
- 12.1.3.2. Products
- 12.1.3.3. Company Financials
- 12.1.3.4. SWOT Analysis
- 12.1.4 Lenox
- 12.1.4.1. Company Overview
- 12.1.4.2. Products
- 12.1.4.3. Company Financials
- 12.1.4.4. SWOT Analysis
- 12.1.5 Meissen
- 12.1.5.1. Company Overview
- 12.1.5.2. Products
- 12.1.5.3. Company Financials
- 12.1.5.4. SWOT Analysis
- 12.1.6 Libbey
- 12.1.6.1. Company Overview
- 12.1.6.2. Products
- 12.1.6.3. Company Financials
- 12.1.6.4. SWOT Analysis
- 12.1.7 Seltmann Weiden
- 12.1.7.1. Company Overview
- 12.1.7.2. Products
- 12.1.7.3. Company Financials
- 12.1.7.4. SWOT Analysis
- 12.1.8 RAK Porcelain
- 12.1.8.1. Company Overview
- 12.1.8.2. Products
- 12.1.8.3. Company Financials
- 12.1.8.4. SWOT Analysis
- 12.1.9 Narumi
- 12.1.9.1. Company Overview
- 12.1.9.2. Products
- 12.1.9.3. Company Financials
- 12.1.9.4. SWOT Analysis
- 12.1.10 KAHLA Porzellan
- 12.1.10.1. Company Overview
- 12.1.10.2. Products
- 12.1.10.3. Company Financials
- 12.1.10.4. SWOT Analysis
- 12.1.11 WMF
- 12.1.11.1. Company Overview
- 12.1.11.2. Products
- 12.1.11.3. Company Financials
- 12.1.11.4. SWOT Analysis
- 12.1.12 SCHONWALD
- 12.1.12.1. Company Overview
- 12.1.12.2. Products
- 12.1.12.3. Company Financials
- 12.1.12.4. SWOT Analysis
- 12.1.13 Churchill China
- 12.1.13.1. Company Overview
- 12.1.13.2. Products
- 12.1.13.3. Company Financials
- 12.1.13.4. SWOT Analysis
- 12.1.14 Villeroy & Boch
- 12.1.14.1. Company Overview
- 12.1.14.2. Products
- 12.1.14.3. Company Financials
- 12.1.14.4. SWOT Analysis
- 12.1.15 TATA ceramics
- 12.1.15.1. Company Overview
- 12.1.15.2. Products
- 12.1.15.3. Company Financials
- 12.1.15.4. SWOT Analysis
- 12.1.16 Sitong Group
- 12.1.16.1. Company Overview
- 12.1.16.2. Products
- 12.1.16.3. Company Financials
- 12.1.16.4. SWOT Analysis
- 12.1.17 Fiskars Group
- 12.1.17.1. Company Overview
- 12.1.17.2. Products
- 12.1.17.3. Company Financials
- 12.1.17.4. SWOT Analysis
- 12.1.1 Portmeirion Group PLC
- 12.2. Market Entropy
- 12.2.1 Company's Key Areas Served
- 12.2.2 Recent Developments
- 12.3. Company Market Share Analysis 2025
- 12.3.1 Top 5 Companies Market Share Analysis
- 12.3.2 Top 3 Companies Market Share Analysis
- 12.4. List of Potential Customers
- 13. Research Methodology
List of Figures
- Figure 1: Global Ceramic Tableware Market Revenue Breakdown (Million, %) by Region 2025 & 2033
- Figure 2: Global Ceramic Tableware Market Volume Breakdown (K Unit, %) by Region 2025 & 2033
- Figure 3: North America Ceramic Tableware Market Revenue (Million), by Type 2025 & 2033
- Figure 4: North America Ceramic Tableware Market Volume (K Unit), by Type 2025 & 2033
- Figure 5: North America Ceramic Tableware Market Revenue Share (%), by Type 2025 & 2033
- Figure 6: North America Ceramic Tableware Market Volume Share (%), by Type 2025 & 2033
- Figure 7: North America Ceramic Tableware Market Revenue (Million), by End User 2025 & 2033
- Figure 8: North America Ceramic Tableware Market Volume (K Unit), by End User 2025 & 2033
- Figure 9: North America Ceramic Tableware Market Revenue Share (%), by End User 2025 & 2033
- Figure 10: North America Ceramic Tableware Market Volume Share (%), by End User 2025 & 2033
- Figure 11: North America Ceramic Tableware Market Revenue (Million), by Distribution Channel 2025 & 2033
- Figure 12: North America Ceramic Tableware Market Volume (K Unit), by Distribution Channel 2025 & 2033
- Figure 13: North America Ceramic Tableware Market Revenue Share (%), by Distribution Channel 2025 & 2033
- Figure 14: North America Ceramic Tableware Market Volume Share (%), by Distribution Channel 2025 & 2033
- Figure 15: North America Ceramic Tableware Market Revenue (Million), by Country 2025 & 2033
- Figure 16: North America Ceramic Tableware Market Volume (K Unit), by Country 2025 & 2033
- Figure 17: North America Ceramic Tableware Market Revenue Share (%), by Country 2025 & 2033
- Figure 18: North America Ceramic Tableware Market Volume Share (%), by Country 2025 & 2033
- Figure 19: Asia Pacific Ceramic Tableware Market Revenue (Million), by Type 2025 & 2033
- Figure 20: Asia Pacific Ceramic Tableware Market Volume (K Unit), by Type 2025 & 2033
- Figure 21: Asia Pacific Ceramic Tableware Market Revenue Share (%), by Type 2025 & 2033
- Figure 22: Asia Pacific Ceramic Tableware Market Volume Share (%), by Type 2025 & 2033
- Figure 23: Asia Pacific Ceramic Tableware Market Revenue (Million), by End User 2025 & 2033
- Figure 24: Asia Pacific Ceramic Tableware Market Volume (K Unit), by End User 2025 & 2033
- Figure 25: Asia Pacific Ceramic Tableware Market Revenue Share (%), by End User 2025 & 2033
- Figure 26: Asia Pacific Ceramic Tableware Market Volume Share (%), by End User 2025 & 2033
- Figure 27: Asia Pacific Ceramic Tableware Market Revenue (Million), by Distribution Channel 2025 & 2033
- Figure 28: Asia Pacific Ceramic Tableware Market Volume (K Unit), by Distribution Channel 2025 & 2033
- Figure 29: Asia Pacific Ceramic Tableware Market Revenue Share (%), by Distribution Channel 2025 & 2033
- Figure 30: Asia Pacific Ceramic Tableware Market Volume Share (%), by Distribution Channel 2025 & 2033
- Figure 31: Asia Pacific Ceramic Tableware Market Revenue (Million), by Country 2025 & 2033
- Figure 32: Asia Pacific Ceramic Tableware Market Volume (K Unit), by Country 2025 & 2033
- Figure 33: Asia Pacific Ceramic Tableware Market Revenue Share (%), by Country 2025 & 2033
- Figure 34: Asia Pacific Ceramic Tableware Market Volume Share (%), by Country 2025 & 2033
- Figure 35: Europe Ceramic Tableware Market Revenue (Million), by Type 2025 & 2033
- Figure 36: Europe Ceramic Tableware Market Volume (K Unit), by Type 2025 & 2033
- Figure 37: Europe Ceramic Tableware Market Revenue Share (%), by Type 2025 & 2033
- Figure 38: Europe Ceramic Tableware Market Volume Share (%), by Type 2025 & 2033
- Figure 39: Europe Ceramic Tableware Market Revenue (Million), by End User 2025 & 2033
- Figure 40: Europe Ceramic Tableware Market Volume (K Unit), by End User 2025 & 2033
- Figure 41: Europe Ceramic Tableware Market Revenue Share (%), by End User 2025 & 2033
- Figure 42: Europe Ceramic Tableware Market Volume Share (%), by End User 2025 & 2033
- Figure 43: Europe Ceramic Tableware Market Revenue (Million), by Distribution Channel 2025 & 2033
- Figure 44: Europe Ceramic Tableware Market Volume (K Unit), by Distribution Channel 2025 & 2033
- Figure 45: Europe Ceramic Tableware Market Revenue Share (%), by Distribution Channel 2025 & 2033
- Figure 46: Europe Ceramic Tableware Market Volume Share (%), by Distribution Channel 2025 & 2033
- Figure 47: Europe Ceramic Tableware Market Revenue (Million), by Country 2025 & 2033
- Figure 48: Europe Ceramic Tableware Market Volume (K Unit), by Country 2025 & 2033
- Figure 49: Europe Ceramic Tableware Market Revenue Share (%), by Country 2025 & 2033
- Figure 50: Europe Ceramic Tableware Market Volume Share (%), by Country 2025 & 2033
- Figure 51: Latin America Ceramic Tableware Market Revenue (Million), by Type 2025 & 2033
- Figure 52: Latin America Ceramic Tableware Market Volume (K Unit), by Type 2025 & 2033
- Figure 53: Latin America Ceramic Tableware Market Revenue Share (%), by Type 2025 & 2033
- Figure 54: Latin America Ceramic Tableware Market Volume Share (%), by Type 2025 & 2033
- Figure 55: Latin America Ceramic Tableware Market Revenue (Million), by End User 2025 & 2033
- Figure 56: Latin America Ceramic Tableware Market Volume (K Unit), by End User 2025 & 2033
- Figure 57: Latin America Ceramic Tableware Market Revenue Share (%), by End User 2025 & 2033
- Figure 58: Latin America Ceramic Tableware Market Volume Share (%), by End User 2025 & 2033
- Figure 59: Latin America Ceramic Tableware Market Revenue (Million), by Distribution Channel 2025 & 2033
- Figure 60: Latin America Ceramic Tableware Market Volume (K Unit), by Distribution Channel 2025 & 2033
- Figure 61: Latin America Ceramic Tableware Market Revenue Share (%), by Distribution Channel 2025 & 2033
- Figure 62: Latin America Ceramic Tableware Market Volume Share (%), by Distribution Channel 2025 & 2033
- Figure 63: Latin America Ceramic Tableware Market Revenue (Million), by Country 2025 & 2033
- Figure 64: Latin America Ceramic Tableware Market Volume (K Unit), by Country 2025 & 2033
- Figure 65: Latin America Ceramic Tableware Market Revenue Share (%), by Country 2025 & 2033
- Figure 66: Latin America Ceramic Tableware Market Volume Share (%), by Country 2025 & 2033
- Figure 67: Middle East and Africa Ceramic Tableware Market Revenue (Million), by Type 2025 & 2033
- Figure 68: Middle East and Africa Ceramic Tableware Market Volume (K Unit), by Type 2025 & 2033
- Figure 69: Middle East and Africa Ceramic Tableware Market Revenue Share (%), by Type 2025 & 2033
- Figure 70: Middle East and Africa Ceramic Tableware Market Volume Share (%), by Type 2025 & 2033
- Figure 71: Middle East and Africa Ceramic Tableware Market Revenue (Million), by End User 2025 & 2033
- Figure 72: Middle East and Africa Ceramic Tableware Market Volume (K Unit), by End User 2025 & 2033
- Figure 73: Middle East and Africa Ceramic Tableware Market Revenue Share (%), by End User 2025 & 2033
- Figure 74: Middle East and Africa Ceramic Tableware Market Volume Share (%), by End User 2025 & 2033
- Figure 75: Middle East and Africa Ceramic Tableware Market Revenue (Million), by Distribution Channel 2025 & 2033
- Figure 76: Middle East and Africa Ceramic Tableware Market Volume (K Unit), by Distribution Channel 2025 & 2033
- Figure 77: Middle East and Africa Ceramic Tableware Market Revenue Share (%), by Distribution Channel 2025 & 2033
- Figure 78: Middle East and Africa Ceramic Tableware Market Volume Share (%), by Distribution Channel 2025 & 2033
- Figure 79: Middle East and Africa Ceramic Tableware Market Revenue (Million), by Country 2025 & 2033
- Figure 80: Middle East and Africa Ceramic Tableware Market Volume (K Unit), by Country 2025 & 2033
- Figure 81: Middle East and Africa Ceramic Tableware Market Revenue Share (%), by Country 2025 & 2033
- Figure 82: Middle East and Africa Ceramic Tableware Market Volume Share (%), by Country 2025 & 2033
List of Tables
- Table 1: Global Ceramic Tableware Market Revenue Million Forecast, by Type 2020 & 2033
- Table 2: Global Ceramic Tableware Market Volume K Unit Forecast, by Type 2020 & 2033
- Table 3: Global Ceramic Tableware Market Revenue Million Forecast, by End User 2020 & 2033
- Table 4: Global Ceramic Tableware Market Volume K Unit Forecast, by End User 2020 & 2033
- Table 5: Global Ceramic Tableware Market Revenue Million Forecast, by Distribution Channel 2020 & 2033
- Table 6: Global Ceramic Tableware Market Volume K Unit Forecast, by Distribution Channel 2020 & 2033
- Table 7: Global Ceramic Tableware Market Revenue Million Forecast, by Region 2020 & 2033
- Table 8: Global Ceramic Tableware Market Volume K Unit Forecast, by Region 2020 & 2033
- Table 9: Global Ceramic Tableware Market Revenue Million Forecast, by Type 2020 & 2033
- Table 10: Global Ceramic Tableware Market Volume K Unit Forecast, by Type 2020 & 2033
- Table 11: Global Ceramic Tableware Market Revenue Million Forecast, by End User 2020 & 2033
- Table 12: Global Ceramic Tableware Market Volume K Unit Forecast, by End User 2020 & 2033
- Table 13: Global Ceramic Tableware Market Revenue Million Forecast, by Distribution Channel 2020 & 2033
- Table 14: Global Ceramic Tableware Market Volume K Unit Forecast, by Distribution Channel 2020 & 2033
- Table 15: Global Ceramic Tableware Market Revenue Million Forecast, by Country 2020 & 2033
- Table 16: Global Ceramic Tableware Market Volume K Unit Forecast, by Country 2020 & 2033
- Table 17: Global Ceramic Tableware Market Revenue Million Forecast, by Type 2020 & 2033
- Table 18: Global Ceramic Tableware Market Volume K Unit Forecast, by Type 2020 & 2033
- Table 19: Global Ceramic Tableware Market Revenue Million Forecast, by End User 2020 & 2033
- Table 20: Global Ceramic Tableware Market Volume K Unit Forecast, by End User 2020 & 2033
- Table 21: Global Ceramic Tableware Market Revenue Million Forecast, by Distribution Channel 2020 & 2033
- Table 22: Global Ceramic Tableware Market Volume K Unit Forecast, by Distribution Channel 2020 & 2033
- Table 23: Global Ceramic Tableware Market Revenue Million Forecast, by Country 2020 & 2033
- Table 24: Global Ceramic Tableware Market Volume K Unit Forecast, by Country 2020 & 2033
- Table 25: Global Ceramic Tableware Market Revenue Million Forecast, by Type 2020 & 2033
- Table 26: Global Ceramic Tableware Market Volume K Unit Forecast, by Type 2020 & 2033
- Table 27: Global Ceramic Tableware Market Revenue Million Forecast, by End User 2020 & 2033
- Table 28: Global Ceramic Tableware Market Volume K Unit Forecast, by End User 2020 & 2033
- Table 29: Global Ceramic Tableware Market Revenue Million Forecast, by Distribution Channel 2020 & 2033
- Table 30: Global Ceramic Tableware Market Volume K Unit Forecast, by Distribution Channel 2020 & 2033
- Table 31: Global Ceramic Tableware Market Revenue Million Forecast, by Country 2020 & 2033
- Table 32: Global Ceramic Tableware Market Volume K Unit Forecast, by Country 2020 & 2033
- Table 33: Global Ceramic Tableware Market Revenue Million Forecast, by Type 2020 & 2033
- Table 34: Global Ceramic Tableware Market Volume K Unit Forecast, by Type 2020 & 2033
- Table 35: Global Ceramic Tableware Market Revenue Million Forecast, by End User 2020 & 2033
- Table 36: Global Ceramic Tableware Market Volume K Unit Forecast, by End User 2020 & 2033
- Table 37: Global Ceramic Tableware Market Revenue Million Forecast, by Distribution Channel 2020 & 2033
- Table 38: Global Ceramic Tableware Market Volume K Unit Forecast, by Distribution Channel 2020 & 2033
- Table 39: Global Ceramic Tableware Market Revenue Million Forecast, by Country 2020 & 2033
- Table 40: Global Ceramic Tableware Market Volume K Unit Forecast, by Country 2020 & 2033
- Table 41: Global Ceramic Tableware Market Revenue Million Forecast, by Type 2020 & 2033
- Table 42: Global Ceramic Tableware Market Volume K Unit Forecast, by Type 2020 & 2033
- Table 43: Global Ceramic Tableware Market Revenue Million Forecast, by End User 2020 & 2033
- Table 44: Global Ceramic Tableware Market Volume K Unit Forecast, by End User 2020 & 2033
- Table 45: Global Ceramic Tableware Market Revenue Million Forecast, by Distribution Channel 2020 & 2033
- Table 46: Global Ceramic Tableware Market Volume K Unit Forecast, by Distribution Channel 2020 & 2033
- Table 47: Global Ceramic Tableware Market Revenue Million Forecast, by Country 2020 & 2033
- Table 48: Global Ceramic Tableware Market Volume K Unit Forecast, by Country 2020 & 2033
Frequently Asked Questions
1. What is the projected Compound Annual Growth Rate (CAGR) of the Ceramic Tableware Market?
The projected CAGR is approximately 6.21%.
2. Which companies are prominent players in the Ceramic Tableware Market?
Key companies in the market include Portmeirion Group PLC, The Oneida Group, Rosenthal GmbH, Lenox, Meissen, Libbey, Seltmann Weiden, RAK Porcelain, Narumi, KAHLA Porzellan, WMF, SCHONWALD, Churchill China, Villeroy & Boch, TATA ceramics, Sitong Group, Fiskars Group.
3. What are the main segments of the Ceramic Tableware Market?
The market segments include Type, End User, Distribution Channel.
4. Can you provide details about the market size?
The market size is estimated to be USD 58.29 Million as of 2022.
5. What are some drivers contributing to market growth?
Increasing Demand for Office Supplies; Growing E-commerce Trends.
6. What are the notable trends driving market growth?
Rapid Growth of Online Sales is Driving the Market.
7. Are there any restraints impacting market growth?
Increasing Digitization of Work and Communication.
8. Can you provide examples of recent developments in the market?
N/A
9. What pricing options are available for accessing the report?
Pricing options include single-user, multi-user, and enterprise licenses priced at USD 4750, USD 5250, and USD 8750 respectively.
10. Is the market size provided in terms of value or volume?
The market size is provided in terms of value, measured in Million and volume, measured in K Unit.
11. Are there any specific market keywords associated with the report?
Yes, the market keyword associated with the report is "Ceramic Tableware Market," which aids in identifying and referencing the specific market segment covered.
12. How do I determine which pricing option suits my needs best?
The pricing options vary based on user requirements and access needs. Individual users may opt for single-user licenses, while businesses requiring broader access may choose multi-user or enterprise licenses for cost-effective access to the report.
13. Are there any additional resources or data provided in the Ceramic Tableware Market report?
While the report offers comprehensive insights, it's advisable to review the specific contents or supplementary materials provided to ascertain if additional resources or data are available.
14. How can I stay updated on further developments or reports in the Ceramic Tableware Market?
To stay informed about further developments, trends, and reports in the Ceramic Tableware Market, consider subscribing to industry newsletters, following relevant companies and organizations, or regularly checking reputable industry news sources and publications.
Methodology
Step 1 - Identification of Relevant Samples Size from Population Database


Step 2 - Approaches for Defining Global Market Size (Value, Volume* & Price*)

Note*: In applicable scenarios
Step 3 - Data Sources
Primary Research
- Web Analytics
- Survey Reports
- Research Institute
- Latest Research Reports
- Opinion Leaders
Secondary Research
- Annual Reports
- White Paper
- Latest Press Release
- Industry Association
- Paid Database
- Investor Presentations

Step 4 - Data Triangulation
Involves using different sources of information in order to increase the validity of a study
These sources are likely to be stakeholders in a program - participants, other researchers, program staff, other community members, and so on.
Then we put all data in single framework & apply various statistical tools to find out the dynamic on the market.
During the analysis stage, feedback from the stakeholder groups would be compared to determine areas of agreement as well as areas of divergence