

Key Insights
The Asia-Pacific (APAC) biofertilizers market is experiencing robust growth, driven by increasing demand for sustainable agricultural practices and a rising global population requiring enhanced food production. The market's Compound Annual Growth Rate (CAGR) of 10.80% from 2019 to 2024 suggests a significant expansion, projected to continue throughout the forecast period (2025-2033). Several factors contribute to this growth. Firstly, the region's large agricultural sector, particularly in countries like India, China, and Japan, creates substantial demand for eco-friendly alternatives to chemical fertilizers. Secondly, government initiatives promoting sustainable agriculture and reduced reliance on synthetic inputs are further bolstering market adoption. The increasing awareness among farmers regarding the benefits of biofertilizers, such as improved soil health, enhanced nutrient uptake, and reduced environmental impact, is also a key driver. Segment-wise, the grains & cereals application segment likely holds the largest market share due to the high consumption of cereals across APAC. Within microorganisms, Rhizobium, Azospirillum, and Phosphate Solubilizing Bacteria are expected to be the leading segments due to their proven efficacy in various crops. However, challenges such as inconsistent product quality, lack of awareness in certain regions, and high initial investment costs could potentially restrain market growth. Despite these challenges, the long-term outlook remains positive, with a projected substantial market expansion throughout the forecast period.
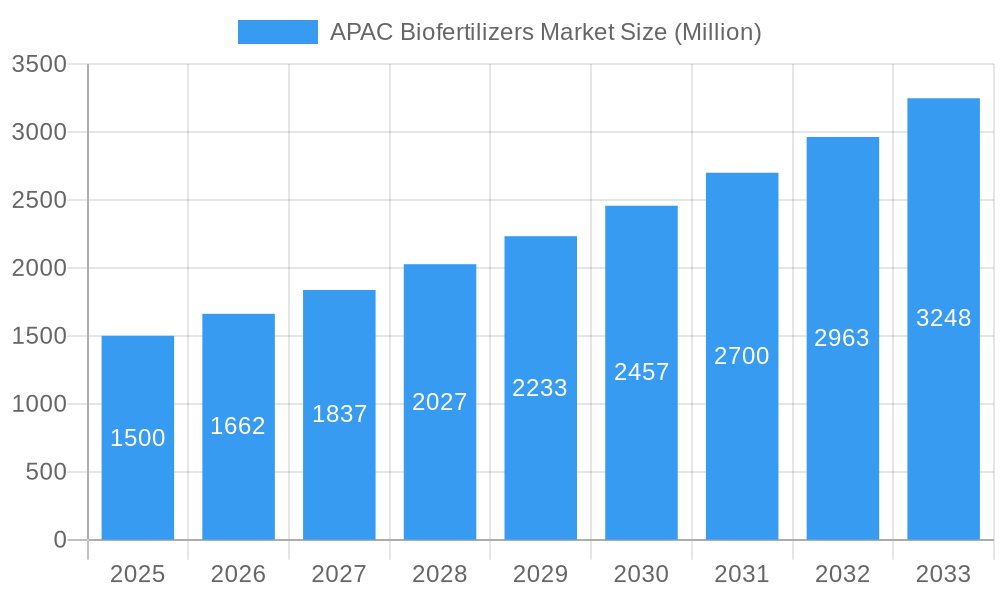
APAC Biofertilizers Market Market Size (In Billion)
The APAC biofertilizers market is characterized by a diverse landscape of both established multinational companies and regional players. Companies such as Symborg SL, CBF China Biofertilizers AG, and Biomax Naturals are actively contributing to the market's growth through research and development, product innovation, and strategic partnerships. India and China, being major agricultural economies in the region, are key contributors to market expansion. However, growth is not uniform across the entire APAC region; differences in agricultural practices, infrastructure development, and farmer awareness levels result in varying market penetration rates. Future growth will likely be influenced by advancements in biofertilizer technology, increasing government support for sustainable agriculture, and expanding farmer education programs. Moreover, the growing focus on precision agriculture and the integration of biofertilizers within integrated pest management strategies will further drive market expansion in the coming years. The development of customized biofertilizers tailored to specific crop needs and soil conditions will also significantly shape the market's future trajectory.
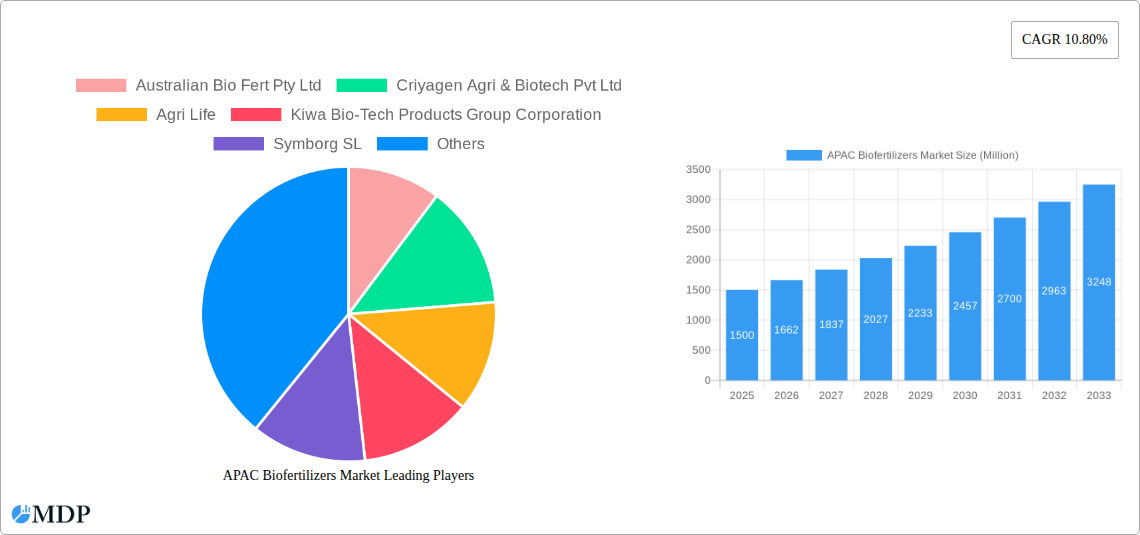
APAC Biofertilizers Market Company Market Share
APAC Biofertilizers Market: A Comprehensive Report 2019-2033
This in-depth report provides a comprehensive analysis of the Asia-Pacific (APAC) biofertilizers market from 2019 to 2033, offering invaluable insights for industry stakeholders, investors, and researchers. With a focus on market dynamics, leading players, and future growth projections, this report is an essential resource for navigating this rapidly evolving sector. The report covers key segments including Microorganisms (Rhizobium, Azospirillum, Azotobacter, Blue-Green Algae, Phosphate Solubilizing Bacteria, Mycorrhiza, Other Microorganisms) and Applications (Grains & Cereals, Pulses & Oilseeds, Commercial Crops, Fruits & Vegetables, Other Applications). The market size is projected to reach xx Million by 2033, exhibiting a CAGR of xx% during the forecast period (2025-2033). The base year for this report is 2025, with historical data covering 2019-2024.
APAC Biofertilizers Market Dynamics & Concentration
The APAC biofertilizers market is characterized by a moderately fragmented landscape, with several key players vying for market share. Market concentration is expected to shift slightly towards consolidation in the coming years, driven by mergers & acquisitions (M&A) activity and the increasing dominance of larger, multinational companies. In 2024, approximately xx M&A deals were recorded in the APAC region, contributing to a xx% increase in market concentration. Innovation is a key driver, with companies continuously developing new biofertilizer formulations and application technologies to enhance crop yields and address sustainability concerns. Stringent regulatory frameworks, particularly regarding product registration and environmental impact assessments, also influence market dynamics. The market faces competition from traditional chemical fertilizers, but increasing awareness of environmental concerns and the rising demand for sustainable agricultural practices are driving adoption of biofertilizers. End-user trends towards organic and sustainable farming are further propelling market growth.
- Market Share: The top 5 players hold approximately xx% of the market share in 2024.
- M&A Activity: The number of M&A deals is projected to increase by xx% annually during the forecast period.
- Regulatory Landscape: Stringent regulations on biofertilizer registration and labeling are expected to remain in place.
- Product Substitutes: Chemical fertilizers remain the primary substitute, but their market share is declining due to growing environmental concerns.
APAC Biofertilizers Market Industry Trends & Analysis
The APAC biofertilizers market is experiencing robust growth, driven by several key factors. The increasing adoption of sustainable agricultural practices, rising awareness about the environmental impact of chemical fertilizers, and supportive government policies promoting organic farming are key growth stimulants. Technological advancements, such as the development of novel biofertilizer formulations with enhanced efficacy, also contribute significantly to market expansion. Consumer preferences are shifting towards organic and sustainably produced food, creating a strong demand for biofertilizers. Competitive dynamics are intense, with companies focusing on product innovation, strategic partnerships, and geographic expansion to gain market share. The market penetration of biofertilizers in the APAC region is estimated at xx% in 2024, and is projected to reach xx% by 2033. The overall market exhibits a strong growth trajectory, with a projected CAGR of xx% during the forecast period.
Leading Markets & Segments in APAC Biofertilizers Market
Within the APAC region, India and China are currently the largest markets for biofertilizers, driven by extensive agricultural land and a growing emphasis on sustainable farming practices. Among the microorganisms, Rhizobium and Phosphate Solubilizing Bacteria dominate the market due to their wide applicability and proven efficacy in enhancing nutrient uptake by various crops. In terms of application, Grains & Cereals and Pulses & Oilseeds segments demonstrate high demand, reflecting the substantial acreage under these crops across the APAC region.
- Key Drivers in India: Government initiatives promoting organic farming, favorable climate conditions for biofertilizer application.
- Key Drivers in China: Growing awareness of environmental sustainability, increasing demand for high-quality agricultural products.
- Dominant Microorganism Segment: Rhizobium and Phosphate Solubilizing Bacteria dominate due to their effectiveness and wide applicability.
- Dominant Application Segment: Grains & Cereals and Pulses & Oilseeds represent the largest market share due to extensive cultivation.
APAC Biofertilizers Market Product Developments
Recent product developments focus on enhanced efficacy, improved shelf life, and user-friendly formulations. Companies are actively investing in research and development to create novel biofertilizers tailored to specific crops and soil conditions. Nanotechnology and advanced delivery systems are being explored to improve nutrient uptake and overall efficiency. The emphasis is on providing sustainable and cost-effective solutions that cater to the diverse needs of the APAC agricultural sector.
Key Drivers of APAC Biofertilizers Market Growth
Several factors fuel the growth of the APAC biofertilizers market. Government regulations promoting sustainable agriculture and reducing reliance on chemical fertilizers are significant. Rising consumer preference for organic food and the increasing awareness of the environmental impact of traditional farming practices also contribute. Technological advancements in biofertilizer production and formulation enhance their efficacy and make them more attractive to farmers.
Challenges in the APAC Biofertilizers Market Market
The APAC biofertilizers market faces several challenges. The high initial cost of biofertilizers compared to chemical fertilizers can deter farmers, particularly smallholder farmers. The inconsistent quality of some biofertilizers and the lack of awareness among farmers about their benefits also hinder market growth. Furthermore, complexities in the regulatory landscape and supply chain inefficiencies pose additional barriers to market expansion. These factors result in a xx% lower adoption rate compared to developed markets.
Emerging Opportunities in APAC Biofertilizers Market
The APAC biofertilizers market presents significant opportunities for growth. Technological breakthroughs in biofertilizer production and formulation, leading to higher efficacy and improved shelf life, offer considerable potential. Strategic partnerships between biofertilizer producers, agricultural input suppliers, and farming communities can accelerate market adoption. Expansion into new markets, particularly in Southeast Asia and Oceania, presents further growth prospects.
Leading Players in the APAC Biofertilizers Market Sector
- Australian Bio Fert Pty Ltd
- Criyagen Agri & Biotech Pvt Ltd
- Agri Life
- Kiwa Bio-Tech Products Group Corporation
- Symborg SL
- CBF China Biofertilizers AG
- Biomax Naturals
- Agrinos AS
- BioAg Pty Ltd
- Camson Biotechnologies Limited
- National Fertilizer Ltd
Key Milestones in APAC Biofertilizers Market Industry
- 2020: Increased government funding for research and development of biofertilizers in several APAC countries.
- 2022: Launch of several new biofertilizer formulations with improved efficacy and shelf life.
- 2023: Several key players announce strategic partnerships to expand distribution networks.
- 2024: Increased M&A activity as larger companies consolidate their market positions.
Strategic Outlook for APAC Biofertilizers Market Market
The future of the APAC biofertilizers market is promising. Continued innovation, supportive government policies, and rising consumer demand for sustainable agriculture are expected to drive significant growth. Strategic partnerships and investments in research and development will be crucial for companies to succeed in this dynamic market. The market is projected to experience substantial expansion, driven by a combination of technological advancements and increased adoption rates.
APAC Biofertilizers Market Segmentation
- 1. Production Analysis
- 2. Consumption Analysis
- 3. Import Market Analysis (Value & Volume)
- 4. Export Market Analysis (Value & Volume)
- 5. Price Trend Analysis
APAC Biofertilizers Market Segmentation By Geography
-
1. North America
- 1.1. United States
- 1.2. Canada
- 1.3. Mexico
-
2. South America
- 2.1. Brazil
- 2.2. Argentina
- 2.3. Rest of South America
-
3. Europe
- 3.1. United Kingdom
- 3.2. Germany
- 3.3. France
- 3.4. Italy
- 3.5. Spain
- 3.6. Russia
- 3.7. Benelux
- 3.8. Nordics
- 3.9. Rest of Europe
-
4. Middle East & Africa
- 4.1. Turkey
- 4.2. Israel
- 4.3. GCC
- 4.4. North Africa
- 4.5. South Africa
- 4.6. Rest of Middle East & Africa
-
5. Asia Pacific
- 5.1. China
- 5.2. India
- 5.3. Japan
- 5.4. South Korea
- 5.5. ASEAN
- 5.6. Oceania
- 5.7. Rest of Asia Pacific
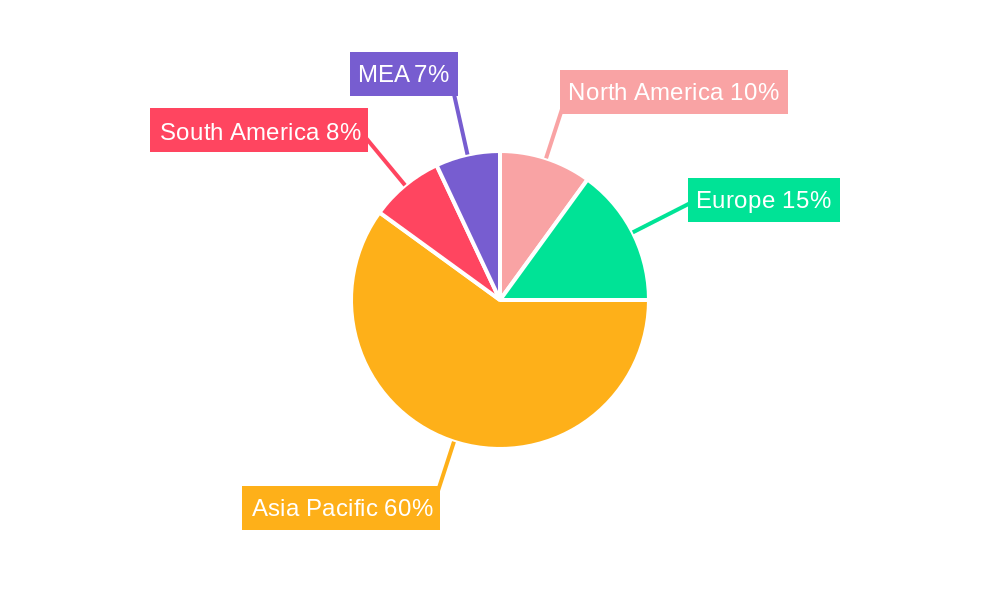
APAC Biofertilizers Market Regional Market Share
Geographic Coverage of APAC Biofertilizers Market
APAC Biofertilizers Market REPORT HIGHLIGHTS
| Aspects | Details |
|---|---|
| Study Period | 2020-2034 |
| Base Year | 2025 |
| Estimated Year | 2026 |
| Forecast Period | 2026-2034 |
| Historical Period | 2020-2025 |
| Growth Rate | CAGR of 13.6% from 2020-2034 |
| Segmentation |
|
Table of Contents
- 1. Introduction
- 1.1. Research Scope
- 1.2. Market Segmentation
- 1.3. Research Objective
- 1.4. Definitions and Assumptions
- 2. Executive Summary
- 2.1. Market Snapshot
- 3. Market Dynamics
- 3.1. Market Drivers
- 3.2. Market Restrains
- 3.3. Market Trends
- 3.4. Market Opportunities
- 4. Market Factor Analysis
- 4.1. Porters Five Forces
- 4.1.1. Bargaining Power of Suppliers
- 4.1.2. Bargaining Power of Buyers
- 4.1.3. Threat of New Entrants
- 4.1.4. Threat of Substitutes
- 4.1.5. Competitive Rivalry
- 4.2. PESTEL analysis
- 4.3. BCG Analysis
- 4.3.1. Stars (High Growth, High Market Share)
- 4.3.2. Cash Cows (Low Growth, High Market Share)
- 4.3.3. Question Mark (High Growth, Low Market Share)
- 4.3.4. Dogs (Low Growth, Low Market Share)
- 4.4. Ansoff Matrix Analysis
- 4.5. Supply Chain Analysis
- 4.6. Regulatory Landscape
- 4.7. Current Market Potential and Opportunity Assessment (TAM–SAM–SOM Framework)
- 4.8. MDP Analyst Note
- 4.1. Porters Five Forces
- 5. Market Analysis, Insights and Forecast 2021-2033
- 5.1. Market Analysis, Insights and Forecast - by Production Analysis
- 5.2. Market Analysis, Insights and Forecast - by Consumption Analysis
- 5.3. Market Analysis, Insights and Forecast - by Import Market Analysis (Value & Volume)
- 5.4. Market Analysis, Insights and Forecast - by Export Market Analysis (Value & Volume)
- 5.5. Market Analysis, Insights and Forecast - by Price Trend Analysis
- 5.6. Market Analysis, Insights and Forecast - by Region
- 5.6.1. North America
- 5.6.2. South America
- 5.6.3. Europe
- 5.6.4. Middle East & Africa
- 5.6.5. Asia Pacific
- 6. Global APAC Biofertilizers Market Analysis, Insights and Forecast, 2021-2033
- 6.1. Market Analysis, Insights and Forecast - by Production Analysis
- 6.2. Market Analysis, Insights and Forecast - by Consumption Analysis
- 6.3. Market Analysis, Insights and Forecast - by Import Market Analysis (Value & Volume)
- 6.4. Market Analysis, Insights and Forecast - by Export Market Analysis (Value & Volume)
- 6.5. Market Analysis, Insights and Forecast - by Price Trend Analysis
- 7. North America APAC Biofertilizers Market Analysis, Insights and Forecast, 2020-2032
- 7.1. Market Analysis, Insights and Forecast - by Production Analysis
- 7.2. Market Analysis, Insights and Forecast - by Consumption Analysis
- 7.3. Market Analysis, Insights and Forecast - by Import Market Analysis (Value & Volume)
- 7.4. Market Analysis, Insights and Forecast - by Export Market Analysis (Value & Volume)
- 7.5. Market Analysis, Insights and Forecast - by Price Trend Analysis
- 8. South America APAC Biofertilizers Market Analysis, Insights and Forecast, 2020-2032
- 8.1. Market Analysis, Insights and Forecast - by Production Analysis
- 8.2. Market Analysis, Insights and Forecast - by Consumption Analysis
- 8.3. Market Analysis, Insights and Forecast - by Import Market Analysis (Value & Volume)
- 8.4. Market Analysis, Insights and Forecast - by Export Market Analysis (Value & Volume)
- 8.5. Market Analysis, Insights and Forecast - by Price Trend Analysis
- 9. Europe APAC Biofertilizers Market Analysis, Insights and Forecast, 2020-2032
- 9.1. Market Analysis, Insights and Forecast - by Production Analysis
- 9.2. Market Analysis, Insights and Forecast - by Consumption Analysis
- 9.3. Market Analysis, Insights and Forecast - by Import Market Analysis (Value & Volume)
- 9.4. Market Analysis, Insights and Forecast - by Export Market Analysis (Value & Volume)
- 9.5. Market Analysis, Insights and Forecast - by Price Trend Analysis
- 10. Middle East & Africa APAC Biofertilizers Market Analysis, Insights and Forecast, 2020-2032
- 10.1. Market Analysis, Insights and Forecast - by Production Analysis
- 10.2. Market Analysis, Insights and Forecast - by Consumption Analysis
- 10.3. Market Analysis, Insights and Forecast - by Import Market Analysis (Value & Volume)
- 10.4. Market Analysis, Insights and Forecast - by Export Market Analysis (Value & Volume)
- 10.5. Market Analysis, Insights and Forecast - by Price Trend Analysis
- 11. Asia Pacific APAC Biofertilizers Market Analysis, Insights and Forecast, 2020-2032
- 11.1. Market Analysis, Insights and Forecast - by Production Analysis
- 11.2. Market Analysis, Insights and Forecast - by Consumption Analysis
- 11.3. Market Analysis, Insights and Forecast - by Import Market Analysis (Value & Volume)
- 11.4. Market Analysis, Insights and Forecast - by Export Market Analysis (Value & Volume)
- 11.5. Market Analysis, Insights and Forecast - by Price Trend Analysis
- 12. Competitive Analysis
- 12.1. Company Profiles
- 12.1.1 Australian Bio Fert Pty Ltd
- 12.1.1.1. Company Overview
- 12.1.1.2. Products
- 12.1.1.3. Company Financials
- 12.1.1.4. SWOT Analysis
- 12.1.2 Criyagen Agri & Biotech Pvt Ltd
- 12.1.2.1. Company Overview
- 12.1.2.2. Products
- 12.1.2.3. Company Financials
- 12.1.2.4. SWOT Analysis
- 12.1.3 Agri Life
- 12.1.3.1. Company Overview
- 12.1.3.2. Products
- 12.1.3.3. Company Financials
- 12.1.3.4. SWOT Analysis
- 12.1.4 Kiwa Bio-Tech Products Group Corporation
- 12.1.4.1. Company Overview
- 12.1.4.2. Products
- 12.1.4.3. Company Financials
- 12.1.4.4. SWOT Analysis
- 12.1.5 Symborg SL
- 12.1.5.1. Company Overview
- 12.1.5.2. Products
- 12.1.5.3. Company Financials
- 12.1.5.4. SWOT Analysis
- 12.1.6 CBF China Biofertilizers AG
- 12.1.6.1. Company Overview
- 12.1.6.2. Products
- 12.1.6.3. Company Financials
- 12.1.6.4. SWOT Analysis
- 12.1.7 Biomax Naturals
- 12.1.7.1. Company Overview
- 12.1.7.2. Products
- 12.1.7.3. Company Financials
- 12.1.7.4. SWOT Analysis
- 12.1.8 Agrinos AS
- 12.1.8.1. Company Overview
- 12.1.8.2. Products
- 12.1.8.3. Company Financials
- 12.1.8.4. SWOT Analysis
- 12.1.9 BioAg Pty Ltd
- 12.1.9.1. Company Overview
- 12.1.9.2. Products
- 12.1.9.3. Company Financials
- 12.1.9.4. SWOT Analysis
- 12.1.10 Camson Biotechnologies Limited
- 12.1.10.1. Company Overview
- 12.1.10.2. Products
- 12.1.10.3. Company Financials
- 12.1.10.4. SWOT Analysis
- 12.1.11 National Fertilizer Ltd
- 12.1.11.1. Company Overview
- 12.1.11.2. Products
- 12.1.11.3. Company Financials
- 12.1.11.4. SWOT Analysis
- 12.1.1 Australian Bio Fert Pty Ltd
- 12.2. Market Entropy
- 12.2.1 Company's Key Areas Served
- 12.2.2 Recent Developments
- 12.3. Company Market Share Analysis 2025
- 12.3.1 Top 5 Companies Market Share Analysis
- 12.3.2 Top 3 Companies Market Share Analysis
- 12.4. List of Potential Customers
- 13. Research Methodology
List of Figures
- Figure 1: Global APAC Biofertilizers Market Revenue Breakdown (million, %) by Region 2025 & 2033
- Figure 2: Global APAC Biofertilizers Market Volume Breakdown (Kiloton, %) by Region 2025 & 2033
- Figure 3: North America APAC Biofertilizers Market Revenue (million), by Production Analysis 2025 & 2033
- Figure 4: North America APAC Biofertilizers Market Volume (Kiloton), by Production Analysis 2025 & 2033
- Figure 5: North America APAC Biofertilizers Market Revenue Share (%), by Production Analysis 2025 & 2033
- Figure 6: North America APAC Biofertilizers Market Volume Share (%), by Production Analysis 2025 & 2033
- Figure 7: North America APAC Biofertilizers Market Revenue (million), by Consumption Analysis 2025 & 2033
- Figure 8: North America APAC Biofertilizers Market Volume (Kiloton), by Consumption Analysis 2025 & 2033
- Figure 9: North America APAC Biofertilizers Market Revenue Share (%), by Consumption Analysis 2025 & 2033
- Figure 10: North America APAC Biofertilizers Market Volume Share (%), by Consumption Analysis 2025 & 2033
- Figure 11: North America APAC Biofertilizers Market Revenue (million), by Import Market Analysis (Value & Volume) 2025 & 2033
- Figure 12: North America APAC Biofertilizers Market Volume (Kiloton), by Import Market Analysis (Value & Volume) 2025 & 2033
- Figure 13: North America APAC Biofertilizers Market Revenue Share (%), by Import Market Analysis (Value & Volume) 2025 & 2033
- Figure 14: North America APAC Biofertilizers Market Volume Share (%), by Import Market Analysis (Value & Volume) 2025 & 2033
- Figure 15: North America APAC Biofertilizers Market Revenue (million), by Export Market Analysis (Value & Volume) 2025 & 2033
- Figure 16: North America APAC Biofertilizers Market Volume (Kiloton), by Export Market Analysis (Value & Volume) 2025 & 2033
- Figure 17: North America APAC Biofertilizers Market Revenue Share (%), by Export Market Analysis (Value & Volume) 2025 & 2033
- Figure 18: North America APAC Biofertilizers Market Volume Share (%), by Export Market Analysis (Value & Volume) 2025 & 2033
- Figure 19: North America APAC Biofertilizers Market Revenue (million), by Price Trend Analysis 2025 & 2033
- Figure 20: North America APAC Biofertilizers Market Volume (Kiloton), by Price Trend Analysis 2025 & 2033
- Figure 21: North America APAC Biofertilizers Market Revenue Share (%), by Price Trend Analysis 2025 & 2033
- Figure 22: North America APAC Biofertilizers Market Volume Share (%), by Price Trend Analysis 2025 & 2033
- Figure 23: North America APAC Biofertilizers Market Revenue (million), by Country 2025 & 2033
- Figure 24: North America APAC Biofertilizers Market Volume (Kiloton), by Country 2025 & 2033
- Figure 25: North America APAC Biofertilizers Market Revenue Share (%), by Country 2025 & 2033
- Figure 26: North America APAC Biofertilizers Market Volume Share (%), by Country 2025 & 2033
- Figure 27: South America APAC Biofertilizers Market Revenue (million), by Production Analysis 2025 & 2033
- Figure 28: South America APAC Biofertilizers Market Volume (Kiloton), by Production Analysis 2025 & 2033
- Figure 29: South America APAC Biofertilizers Market Revenue Share (%), by Production Analysis 2025 & 2033
- Figure 30: South America APAC Biofertilizers Market Volume Share (%), by Production Analysis 2025 & 2033
- Figure 31: South America APAC Biofertilizers Market Revenue (million), by Consumption Analysis 2025 & 2033
- Figure 32: South America APAC Biofertilizers Market Volume (Kiloton), by Consumption Analysis 2025 & 2033
- Figure 33: South America APAC Biofertilizers Market Revenue Share (%), by Consumption Analysis 2025 & 2033
- Figure 34: South America APAC Biofertilizers Market Volume Share (%), by Consumption Analysis 2025 & 2033
- Figure 35: South America APAC Biofertilizers Market Revenue (million), by Import Market Analysis (Value & Volume) 2025 & 2033
- Figure 36: South America APAC Biofertilizers Market Volume (Kiloton), by Import Market Analysis (Value & Volume) 2025 & 2033
- Figure 37: South America APAC Biofertilizers Market Revenue Share (%), by Import Market Analysis (Value & Volume) 2025 & 2033
- Figure 38: South America APAC Biofertilizers Market Volume Share (%), by Import Market Analysis (Value & Volume) 2025 & 2033
- Figure 39: South America APAC Biofertilizers Market Revenue (million), by Export Market Analysis (Value & Volume) 2025 & 2033
- Figure 40: South America APAC Biofertilizers Market Volume (Kiloton), by Export Market Analysis (Value & Volume) 2025 & 2033
- Figure 41: South America APAC Biofertilizers Market Revenue Share (%), by Export Market Analysis (Value & Volume) 2025 & 2033
- Figure 42: South America APAC Biofertilizers Market Volume Share (%), by Export Market Analysis (Value & Volume) 2025 & 2033
- Figure 43: South America APAC Biofertilizers Market Revenue (million), by Price Trend Analysis 2025 & 2033
- Figure 44: South America APAC Biofertilizers Market Volume (Kiloton), by Price Trend Analysis 2025 & 2033
- Figure 45: South America APAC Biofertilizers Market Revenue Share (%), by Price Trend Analysis 2025 & 2033
- Figure 46: South America APAC Biofertilizers Market Volume Share (%), by Price Trend Analysis 2025 & 2033
- Figure 47: South America APAC Biofertilizers Market Revenue (million), by Country 2025 & 2033
- Figure 48: South America APAC Biofertilizers Market Volume (Kiloton), by Country 2025 & 2033
- Figure 49: South America APAC Biofertilizers Market Revenue Share (%), by Country 2025 & 2033
- Figure 50: South America APAC Biofertilizers Market Volume Share (%), by Country 2025 & 2033
- Figure 51: Europe APAC Biofertilizers Market Revenue (million), by Production Analysis 2025 & 2033
- Figure 52: Europe APAC Biofertilizers Market Volume (Kiloton), by Production Analysis 2025 & 2033
- Figure 53: Europe APAC Biofertilizers Market Revenue Share (%), by Production Analysis 2025 & 2033
- Figure 54: Europe APAC Biofertilizers Market Volume Share (%), by Production Analysis 2025 & 2033
- Figure 55: Europe APAC Biofertilizers Market Revenue (million), by Consumption Analysis 2025 & 2033
- Figure 56: Europe APAC Biofertilizers Market Volume (Kiloton), by Consumption Analysis 2025 & 2033
- Figure 57: Europe APAC Biofertilizers Market Revenue Share (%), by Consumption Analysis 2025 & 2033
- Figure 58: Europe APAC Biofertilizers Market Volume Share (%), by Consumption Analysis 2025 & 2033
- Figure 59: Europe APAC Biofertilizers Market Revenue (million), by Import Market Analysis (Value & Volume) 2025 & 2033
- Figure 60: Europe APAC Biofertilizers Market Volume (Kiloton), by Import Market Analysis (Value & Volume) 2025 & 2033
- Figure 61: Europe APAC Biofertilizers Market Revenue Share (%), by Import Market Analysis (Value & Volume) 2025 & 2033
- Figure 62: Europe APAC Biofertilizers Market Volume Share (%), by Import Market Analysis (Value & Volume) 2025 & 2033
- Figure 63: Europe APAC Biofertilizers Market Revenue (million), by Export Market Analysis (Value & Volume) 2025 & 2033
- Figure 64: Europe APAC Biofertilizers Market Volume (Kiloton), by Export Market Analysis (Value & Volume) 2025 & 2033
- Figure 65: Europe APAC Biofertilizers Market Revenue Share (%), by Export Market Analysis (Value & Volume) 2025 & 2033
- Figure 66: Europe APAC Biofertilizers Market Volume Share (%), by Export Market Analysis (Value & Volume) 2025 & 2033
- Figure 67: Europe APAC Biofertilizers Market Revenue (million), by Price Trend Analysis 2025 & 2033
- Figure 68: Europe APAC Biofertilizers Market Volume (Kiloton), by Price Trend Analysis 2025 & 2033
- Figure 69: Europe APAC Biofertilizers Market Revenue Share (%), by Price Trend Analysis 2025 & 2033
- Figure 70: Europe APAC Biofertilizers Market Volume Share (%), by Price Trend Analysis 2025 & 2033
- Figure 71: Europe APAC Biofertilizers Market Revenue (million), by Country 2025 & 2033
- Figure 72: Europe APAC Biofertilizers Market Volume (Kiloton), by Country 2025 & 2033
- Figure 73: Europe APAC Biofertilizers Market Revenue Share (%), by Country 2025 & 2033
- Figure 74: Europe APAC Biofertilizers Market Volume Share (%), by Country 2025 & 2033
- Figure 75: Middle East & Africa APAC Biofertilizers Market Revenue (million), by Production Analysis 2025 & 2033
- Figure 76: Middle East & Africa APAC Biofertilizers Market Volume (Kiloton), by Production Analysis 2025 & 2033
- Figure 77: Middle East & Africa APAC Biofertilizers Market Revenue Share (%), by Production Analysis 2025 & 2033
- Figure 78: Middle East & Africa APAC Biofertilizers Market Volume Share (%), by Production Analysis 2025 & 2033
- Figure 79: Middle East & Africa APAC Biofertilizers Market Revenue (million), by Consumption Analysis 2025 & 2033
- Figure 80: Middle East & Africa APAC Biofertilizers Market Volume (Kiloton), by Consumption Analysis 2025 & 2033
- Figure 81: Middle East & Africa APAC Biofertilizers Market Revenue Share (%), by Consumption Analysis 2025 & 2033
- Figure 82: Middle East & Africa APAC Biofertilizers Market Volume Share (%), by Consumption Analysis 2025 & 2033
- Figure 83: Middle East & Africa APAC Biofertilizers Market Revenue (million), by Import Market Analysis (Value & Volume) 2025 & 2033
- Figure 84: Middle East & Africa APAC Biofertilizers Market Volume (Kiloton), by Import Market Analysis (Value & Volume) 2025 & 2033
- Figure 85: Middle East & Africa APAC Biofertilizers Market Revenue Share (%), by Import Market Analysis (Value & Volume) 2025 & 2033
- Figure 86: Middle East & Africa APAC Biofertilizers Market Volume Share (%), by Import Market Analysis (Value & Volume) 2025 & 2033
- Figure 87: Middle East & Africa APAC Biofertilizers Market Revenue (million), by Export Market Analysis (Value & Volume) 2025 & 2033
- Figure 88: Middle East & Africa APAC Biofertilizers Market Volume (Kiloton), by Export Market Analysis (Value & Volume) 2025 & 2033
- Figure 89: Middle East & Africa APAC Biofertilizers Market Revenue Share (%), by Export Market Analysis (Value & Volume) 2025 & 2033
- Figure 90: Middle East & Africa APAC Biofertilizers Market Volume Share (%), by Export Market Analysis (Value & Volume) 2025 & 2033
- Figure 91: Middle East & Africa APAC Biofertilizers Market Revenue (million), by Price Trend Analysis 2025 & 2033
- Figure 92: Middle East & Africa APAC Biofertilizers Market Volume (Kiloton), by Price Trend Analysis 2025 & 2033
- Figure 93: Middle East & Africa APAC Biofertilizers Market Revenue Share (%), by Price Trend Analysis 2025 & 2033
- Figure 94: Middle East & Africa APAC Biofertilizers Market Volume Share (%), by Price Trend Analysis 2025 & 2033
- Figure 95: Middle East & Africa APAC Biofertilizers Market Revenue (million), by Country 2025 & 2033
- Figure 96: Middle East & Africa APAC Biofertilizers Market Volume (Kiloton), by Country 2025 & 2033
- Figure 97: Middle East & Africa APAC Biofertilizers Market Revenue Share (%), by Country 2025 & 2033
- Figure 98: Middle East & Africa APAC Biofertilizers Market Volume Share (%), by Country 2025 & 2033
- Figure 99: Asia Pacific APAC Biofertilizers Market Revenue (million), by Production Analysis 2025 & 2033
- Figure 100: Asia Pacific APAC Biofertilizers Market Volume (Kiloton), by Production Analysis 2025 & 2033
- Figure 101: Asia Pacific APAC Biofertilizers Market Revenue Share (%), by Production Analysis 2025 & 2033
- Figure 102: Asia Pacific APAC Biofertilizers Market Volume Share (%), by Production Analysis 2025 & 2033
- Figure 103: Asia Pacific APAC Biofertilizers Market Revenue (million), by Consumption Analysis 2025 & 2033
- Figure 104: Asia Pacific APAC Biofertilizers Market Volume (Kiloton), by Consumption Analysis 2025 & 2033
- Figure 105: Asia Pacific APAC Biofertilizers Market Revenue Share (%), by Consumption Analysis 2025 & 2033
- Figure 106: Asia Pacific APAC Biofertilizers Market Volume Share (%), by Consumption Analysis 2025 & 2033
- Figure 107: Asia Pacific APAC Biofertilizers Market Revenue (million), by Import Market Analysis (Value & Volume) 2025 & 2033
- Figure 108: Asia Pacific APAC Biofertilizers Market Volume (Kiloton), by Import Market Analysis (Value & Volume) 2025 & 2033
- Figure 109: Asia Pacific APAC Biofertilizers Market Revenue Share (%), by Import Market Analysis (Value & Volume) 2025 & 2033
- Figure 110: Asia Pacific APAC Biofertilizers Market Volume Share (%), by Import Market Analysis (Value & Volume) 2025 & 2033
- Figure 111: Asia Pacific APAC Biofertilizers Market Revenue (million), by Export Market Analysis (Value & Volume) 2025 & 2033
- Figure 112: Asia Pacific APAC Biofertilizers Market Volume (Kiloton), by Export Market Analysis (Value & Volume) 2025 & 2033
- Figure 113: Asia Pacific APAC Biofertilizers Market Revenue Share (%), by Export Market Analysis (Value & Volume) 2025 & 2033
- Figure 114: Asia Pacific APAC Biofertilizers Market Volume Share (%), by Export Market Analysis (Value & Volume) 2025 & 2033
- Figure 115: Asia Pacific APAC Biofertilizers Market Revenue (million), by Price Trend Analysis 2025 & 2033
- Figure 116: Asia Pacific APAC Biofertilizers Market Volume (Kiloton), by Price Trend Analysis 2025 & 2033
- Figure 117: Asia Pacific APAC Biofertilizers Market Revenue Share (%), by Price Trend Analysis 2025 & 2033
- Figure 118: Asia Pacific APAC Biofertilizers Market Volume Share (%), by Price Trend Analysis 2025 & 2033
- Figure 119: Asia Pacific APAC Biofertilizers Market Revenue (million), by Country 2025 & 2033
- Figure 120: Asia Pacific APAC Biofertilizers Market Volume (Kiloton), by Country 2025 & 2033
- Figure 121: Asia Pacific APAC Biofertilizers Market Revenue Share (%), by Country 2025 & 2033
- Figure 122: Asia Pacific APAC Biofertilizers Market Volume Share (%), by Country 2025 & 2033
List of Tables
- Table 1: Global APAC Biofertilizers Market Revenue million Forecast, by Production Analysis 2020 & 2033
- Table 2: Global APAC Biofertilizers Market Volume Kiloton Forecast, by Production Analysis 2020 & 2033
- Table 3: Global APAC Biofertilizers Market Revenue million Forecast, by Consumption Analysis 2020 & 2033
- Table 4: Global APAC Biofertilizers Market Volume Kiloton Forecast, by Consumption Analysis 2020 & 2033
- Table 5: Global APAC Biofertilizers Market Revenue million Forecast, by Import Market Analysis (Value & Volume) 2020 & 2033
- Table 6: Global APAC Biofertilizers Market Volume Kiloton Forecast, by Import Market Analysis (Value & Volume) 2020 & 2033
- Table 7: Global APAC Biofertilizers Market Revenue million Forecast, by Export Market Analysis (Value & Volume) 2020 & 2033
- Table 8: Global APAC Biofertilizers Market Volume Kiloton Forecast, by Export Market Analysis (Value & Volume) 2020 & 2033
- Table 9: Global APAC Biofertilizers Market Revenue million Forecast, by Price Trend Analysis 2020 & 2033
- Table 10: Global APAC Biofertilizers Market Volume Kiloton Forecast, by Price Trend Analysis 2020 & 2033
- Table 11: Global APAC Biofertilizers Market Revenue million Forecast, by Region 2020 & 2033
- Table 12: Global APAC Biofertilizers Market Volume Kiloton Forecast, by Region 2020 & 2033
- Table 13: Global APAC Biofertilizers Market Revenue million Forecast, by Production Analysis 2020 & 2033
- Table 14: Global APAC Biofertilizers Market Volume Kiloton Forecast, by Production Analysis 2020 & 2033
- Table 15: Global APAC Biofertilizers Market Revenue million Forecast, by Consumption Analysis 2020 & 2033
- Table 16: Global APAC Biofertilizers Market Volume Kiloton Forecast, by Consumption Analysis 2020 & 2033
- Table 17: Global APAC Biofertilizers Market Revenue million Forecast, by Import Market Analysis (Value & Volume) 2020 & 2033
- Table 18: Global APAC Biofertilizers Market Volume Kiloton Forecast, by Import Market Analysis (Value & Volume) 2020 & 2033
- Table 19: Global APAC Biofertilizers Market Revenue million Forecast, by Export Market Analysis (Value & Volume) 2020 & 2033
- Table 20: Global APAC Biofertilizers Market Volume Kiloton Forecast, by Export Market Analysis (Value & Volume) 2020 & 2033
- Table 21: Global APAC Biofertilizers Market Revenue million Forecast, by Price Trend Analysis 2020 & 2033
- Table 22: Global APAC Biofertilizers Market Volume Kiloton Forecast, by Price Trend Analysis 2020 & 2033
- Table 23: Global APAC Biofertilizers Market Revenue million Forecast, by Country 2020 & 2033
- Table 24: Global APAC Biofertilizers Market Volume Kiloton Forecast, by Country 2020 & 2033
- Table 25: United States APAC Biofertilizers Market Revenue (million) Forecast, by Application 2020 & 2033
- Table 26: United States APAC Biofertilizers Market Volume (Kiloton) Forecast, by Application 2020 & 2033
- Table 27: Canada APAC Biofertilizers Market Revenue (million) Forecast, by Application 2020 & 2033
- Table 28: Canada APAC Biofertilizers Market Volume (Kiloton) Forecast, by Application 2020 & 2033
- Table 29: Mexico APAC Biofertilizers Market Revenue (million) Forecast, by Application 2020 & 2033
- Table 30: Mexico APAC Biofertilizers Market Volume (Kiloton) Forecast, by Application 2020 & 2033
- Table 31: Global APAC Biofertilizers Market Revenue million Forecast, by Production Analysis 2020 & 2033
- Table 32: Global APAC Biofertilizers Market Volume Kiloton Forecast, by Production Analysis 2020 & 2033
- Table 33: Global APAC Biofertilizers Market Revenue million Forecast, by Consumption Analysis 2020 & 2033
- Table 34: Global APAC Biofertilizers Market Volume Kiloton Forecast, by Consumption Analysis 2020 & 2033
- Table 35: Global APAC Biofertilizers Market Revenue million Forecast, by Import Market Analysis (Value & Volume) 2020 & 2033
- Table 36: Global APAC Biofertilizers Market Volume Kiloton Forecast, by Import Market Analysis (Value & Volume) 2020 & 2033
- Table 37: Global APAC Biofertilizers Market Revenue million Forecast, by Export Market Analysis (Value & Volume) 2020 & 2033
- Table 38: Global APAC Biofertilizers Market Volume Kiloton Forecast, by Export Market Analysis (Value & Volume) 2020 & 2033
- Table 39: Global APAC Biofertilizers Market Revenue million Forecast, by Price Trend Analysis 2020 & 2033
- Table 40: Global APAC Biofertilizers Market Volume Kiloton Forecast, by Price Trend Analysis 2020 & 2033
- Table 41: Global APAC Biofertilizers Market Revenue million Forecast, by Country 2020 & 2033
- Table 42: Global APAC Biofertilizers Market Volume Kiloton Forecast, by Country 2020 & 2033
- Table 43: Brazil APAC Biofertilizers Market Revenue (million) Forecast, by Application 2020 & 2033
- Table 44: Brazil APAC Biofertilizers Market Volume (Kiloton) Forecast, by Application 2020 & 2033
- Table 45: Argentina APAC Biofertilizers Market Revenue (million) Forecast, by Application 2020 & 2033
- Table 46: Argentina APAC Biofertilizers Market Volume (Kiloton) Forecast, by Application 2020 & 2033
- Table 47: Rest of South America APAC Biofertilizers Market Revenue (million) Forecast, by Application 2020 & 2033
- Table 48: Rest of South America APAC Biofertilizers Market Volume (Kiloton) Forecast, by Application 2020 & 2033
- Table 49: Global APAC Biofertilizers Market Revenue million Forecast, by Production Analysis 2020 & 2033
- Table 50: Global APAC Biofertilizers Market Volume Kiloton Forecast, by Production Analysis 2020 & 2033
- Table 51: Global APAC Biofertilizers Market Revenue million Forecast, by Consumption Analysis 2020 & 2033
- Table 52: Global APAC Biofertilizers Market Volume Kiloton Forecast, by Consumption Analysis 2020 & 2033
- Table 53: Global APAC Biofertilizers Market Revenue million Forecast, by Import Market Analysis (Value & Volume) 2020 & 2033
- Table 54: Global APAC Biofertilizers Market Volume Kiloton Forecast, by Import Market Analysis (Value & Volume) 2020 & 2033
- Table 55: Global APAC Biofertilizers Market Revenue million Forecast, by Export Market Analysis (Value & Volume) 2020 & 2033
- Table 56: Global APAC Biofertilizers Market Volume Kiloton Forecast, by Export Market Analysis (Value & Volume) 2020 & 2033
- Table 57: Global APAC Biofertilizers Market Revenue million Forecast, by Price Trend Analysis 2020 & 2033
- Table 58: Global APAC Biofertilizers Market Volume Kiloton Forecast, by Price Trend Analysis 2020 & 2033
- Table 59: Global APAC Biofertilizers Market Revenue million Forecast, by Country 2020 & 2033
- Table 60: Global APAC Biofertilizers Market Volume Kiloton Forecast, by Country 2020 & 2033
- Table 61: United Kingdom APAC Biofertilizers Market Revenue (million) Forecast, by Application 2020 & 2033
- Table 62: United Kingdom APAC Biofertilizers Market Volume (Kiloton) Forecast, by Application 2020 & 2033
- Table 63: Germany APAC Biofertilizers Market Revenue (million) Forecast, by Application 2020 & 2033
- Table 64: Germany APAC Biofertilizers Market Volume (Kiloton) Forecast, by Application 2020 & 2033
- Table 65: France APAC Biofertilizers Market Revenue (million) Forecast, by Application 2020 & 2033
- Table 66: France APAC Biofertilizers Market Volume (Kiloton) Forecast, by Application 2020 & 2033
- Table 67: Italy APAC Biofertilizers Market Revenue (million) Forecast, by Application 2020 & 2033
- Table 68: Italy APAC Biofertilizers Market Volume (Kiloton) Forecast, by Application 2020 & 2033
- Table 69: Spain APAC Biofertilizers Market Revenue (million) Forecast, by Application 2020 & 2033
- Table 70: Spain APAC Biofertilizers Market Volume (Kiloton) Forecast, by Application 2020 & 2033
- Table 71: Russia APAC Biofertilizers Market Revenue (million) Forecast, by Application 2020 & 2033
- Table 72: Russia APAC Biofertilizers Market Volume (Kiloton) Forecast, by Application 2020 & 2033
- Table 73: Benelux APAC Biofertilizers Market Revenue (million) Forecast, by Application 2020 & 2033
- Table 74: Benelux APAC Biofertilizers Market Volume (Kiloton) Forecast, by Application 2020 & 2033
- Table 75: Nordics APAC Biofertilizers Market Revenue (million) Forecast, by Application 2020 & 2033
- Table 76: Nordics APAC Biofertilizers Market Volume (Kiloton) Forecast, by Application 2020 & 2033
- Table 77: Rest of Europe APAC Biofertilizers Market Revenue (million) Forecast, by Application 2020 & 2033
- Table 78: Rest of Europe APAC Biofertilizers Market Volume (Kiloton) Forecast, by Application 2020 & 2033
- Table 79: Global APAC Biofertilizers Market Revenue million Forecast, by Production Analysis 2020 & 2033
- Table 80: Global APAC Biofertilizers Market Volume Kiloton Forecast, by Production Analysis 2020 & 2033
- Table 81: Global APAC Biofertilizers Market Revenue million Forecast, by Consumption Analysis 2020 & 2033
- Table 82: Global APAC Biofertilizers Market Volume Kiloton Forecast, by Consumption Analysis 2020 & 2033
- Table 83: Global APAC Biofertilizers Market Revenue million Forecast, by Import Market Analysis (Value & Volume) 2020 & 2033
- Table 84: Global APAC Biofertilizers Market Volume Kiloton Forecast, by Import Market Analysis (Value & Volume) 2020 & 2033
- Table 85: Global APAC Biofertilizers Market Revenue million Forecast, by Export Market Analysis (Value & Volume) 2020 & 2033
- Table 86: Global APAC Biofertilizers Market Volume Kiloton Forecast, by Export Market Analysis (Value & Volume) 2020 & 2033
- Table 87: Global APAC Biofertilizers Market Revenue million Forecast, by Price Trend Analysis 2020 & 2033
- Table 88: Global APAC Biofertilizers Market Volume Kiloton Forecast, by Price Trend Analysis 2020 & 2033
- Table 89: Global APAC Biofertilizers Market Revenue million Forecast, by Country 2020 & 2033
- Table 90: Global APAC Biofertilizers Market Volume Kiloton Forecast, by Country 2020 & 2033
- Table 91: Turkey APAC Biofertilizers Market Revenue (million) Forecast, by Application 2020 & 2033
- Table 92: Turkey APAC Biofertilizers Market Volume (Kiloton) Forecast, by Application 2020 & 2033
- Table 93: Israel APAC Biofertilizers Market Revenue (million) Forecast, by Application 2020 & 2033
- Table 94: Israel APAC Biofertilizers Market Volume (Kiloton) Forecast, by Application 2020 & 2033
- Table 95: GCC APAC Biofertilizers Market Revenue (million) Forecast, by Application 2020 & 2033
- Table 96: GCC APAC Biofertilizers Market Volume (Kiloton) Forecast, by Application 2020 & 2033
- Table 97: North Africa APAC Biofertilizers Market Revenue (million) Forecast, by Application 2020 & 2033
- Table 98: North Africa APAC Biofertilizers Market Volume (Kiloton) Forecast, by Application 2020 & 2033
- Table 99: South Africa APAC Biofertilizers Market Revenue (million) Forecast, by Application 2020 & 2033
- Table 100: South Africa APAC Biofertilizers Market Volume (Kiloton) Forecast, by Application 2020 & 2033
- Table 101: Rest of Middle East & Africa APAC Biofertilizers Market Revenue (million) Forecast, by Application 2020 & 2033
- Table 102: Rest of Middle East & Africa APAC Biofertilizers Market Volume (Kiloton) Forecast, by Application 2020 & 2033
- Table 103: Global APAC Biofertilizers Market Revenue million Forecast, by Production Analysis 2020 & 2033
- Table 104: Global APAC Biofertilizers Market Volume Kiloton Forecast, by Production Analysis 2020 & 2033
- Table 105: Global APAC Biofertilizers Market Revenue million Forecast, by Consumption Analysis 2020 & 2033
- Table 106: Global APAC Biofertilizers Market Volume Kiloton Forecast, by Consumption Analysis 2020 & 2033
- Table 107: Global APAC Biofertilizers Market Revenue million Forecast, by Import Market Analysis (Value & Volume) 2020 & 2033
- Table 108: Global APAC Biofertilizers Market Volume Kiloton Forecast, by Import Market Analysis (Value & Volume) 2020 & 2033
- Table 109: Global APAC Biofertilizers Market Revenue million Forecast, by Export Market Analysis (Value & Volume) 2020 & 2033
- Table 110: Global APAC Biofertilizers Market Volume Kiloton Forecast, by Export Market Analysis (Value & Volume) 2020 & 2033
- Table 111: Global APAC Biofertilizers Market Revenue million Forecast, by Price Trend Analysis 2020 & 2033
- Table 112: Global APAC Biofertilizers Market Volume Kiloton Forecast, by Price Trend Analysis 2020 & 2033
- Table 113: Global APAC Biofertilizers Market Revenue million Forecast, by Country 2020 & 2033
- Table 114: Global APAC Biofertilizers Market Volume Kiloton Forecast, by Country 2020 & 2033
- Table 115: China APAC Biofertilizers Market Revenue (million) Forecast, by Application 2020 & 2033
- Table 116: China APAC Biofertilizers Market Volume (Kiloton) Forecast, by Application 2020 & 2033
- Table 117: India APAC Biofertilizers Market Revenue (million) Forecast, by Application 2020 & 2033
- Table 118: India APAC Biofertilizers Market Volume (Kiloton) Forecast, by Application 2020 & 2033
- Table 119: Japan APAC Biofertilizers Market Revenue (million) Forecast, by Application 2020 & 2033
- Table 120: Japan APAC Biofertilizers Market Volume (Kiloton) Forecast, by Application 2020 & 2033
- Table 121: South Korea APAC Biofertilizers Market Revenue (million) Forecast, by Application 2020 & 2033
- Table 122: South Korea APAC Biofertilizers Market Volume (Kiloton) Forecast, by Application 2020 & 2033
- Table 123: ASEAN APAC Biofertilizers Market Revenue (million) Forecast, by Application 2020 & 2033
- Table 124: ASEAN APAC Biofertilizers Market Volume (Kiloton) Forecast, by Application 2020 & 2033
- Table 125: Oceania APAC Biofertilizers Market Revenue (million) Forecast, by Application 2020 & 2033
- Table 126: Oceania APAC Biofertilizers Market Volume (Kiloton) Forecast, by Application 2020 & 2033
- Table 127: Rest of Asia Pacific APAC Biofertilizers Market Revenue (million) Forecast, by Application 2020 & 2033
- Table 128: Rest of Asia Pacific APAC Biofertilizers Market Volume (Kiloton) Forecast, by Application 2020 & 2033
Frequently Asked Questions
1. What is the projected Compound Annual Growth Rate (CAGR) of the APAC Biofertilizers Market?
The projected CAGR is approximately 13.6%.
2. Which companies are prominent players in the APAC Biofertilizers Market?
Key companies in the market include Australian Bio Fert Pty Ltd, Criyagen Agri & Biotech Pvt Ltd, Agri Life, Kiwa Bio-Tech Products Group Corporation, Symborg SL, CBF China Biofertilizers AG, Biomax Naturals, Agrinos AS, BioAg Pty Ltd, Camson Biotechnologies Limited, National Fertilizer Ltd.
3. What are the main segments of the APAC Biofertilizers Market?
The market segments include Production Analysis, Consumption Analysis, Import Market Analysis (Value & Volume), Export Market Analysis (Value & Volume), Price Trend Analysis.
4. Can you provide details about the market size?
The market size is estimated to be USD 293.3 million as of 2022.
5. What are some drivers contributing to market growth?
Seed Treatment As A Solution To Enhance Yield; Growing Awareness For Seed Treatment Among The Farmers; Rising Trend Of Organic Farming.
6. What are the notable trends driving market growth?
Increased Practice for Organic Farming.
7. Are there any restraints impacting market growth?
Limitations Across Farm-Level Seed Treatment; Rising Environmental Concerns.
8. Can you provide examples of recent developments in the market?
N/A
9. What pricing options are available for accessing the report?
Pricing options include single-user, multi-user, and enterprise licenses priced at USD 4750, USD 5250, and USD 8750 respectively.
10. Is the market size provided in terms of value or volume?
The market size is provided in terms of value, measured in million and volume, measured in Kiloton.
11. Are there any specific market keywords associated with the report?
Yes, the market keyword associated with the report is "APAC Biofertilizers Market," which aids in identifying and referencing the specific market segment covered.
12. How do I determine which pricing option suits my needs best?
The pricing options vary based on user requirements and access needs. Individual users may opt for single-user licenses, while businesses requiring broader access may choose multi-user or enterprise licenses for cost-effective access to the report.
13. Are there any additional resources or data provided in the APAC Biofertilizers Market report?
While the report offers comprehensive insights, it's advisable to review the specific contents or supplementary materials provided to ascertain if additional resources or data are available.
14. How can I stay updated on further developments or reports in the APAC Biofertilizers Market?
To stay informed about further developments, trends, and reports in the APAC Biofertilizers Market, consider subscribing to industry newsletters, following relevant companies and organizations, or regularly checking reputable industry news sources and publications.
Methodology
Step 1 - Identification of Relevant Samples Size from Population Database


Step 2 - Approaches for Defining Global Market Size (Value, Volume* & Price*)

Note*: In applicable scenarios
Step 3 - Data Sources
Primary Research
- Web Analytics
- Survey Reports
- Research Institute
- Latest Research Reports
- Opinion Leaders
Secondary Research
- Annual Reports
- White Paper
- Latest Press Release
- Industry Association
- Paid Database
- Investor Presentations

Step 4 - Data Triangulation
Involves using different sources of information in order to increase the validity of a study
These sources are likely to be stakeholders in a program - participants, other researchers, program staff, other community members, and so on.
Then we put all data in single framework & apply various statistical tools to find out the dynamic on the market.
During the analysis stage, feedback from the stakeholder groups would be compared to determine areas of agreement as well as areas of divergence