

Key Insights
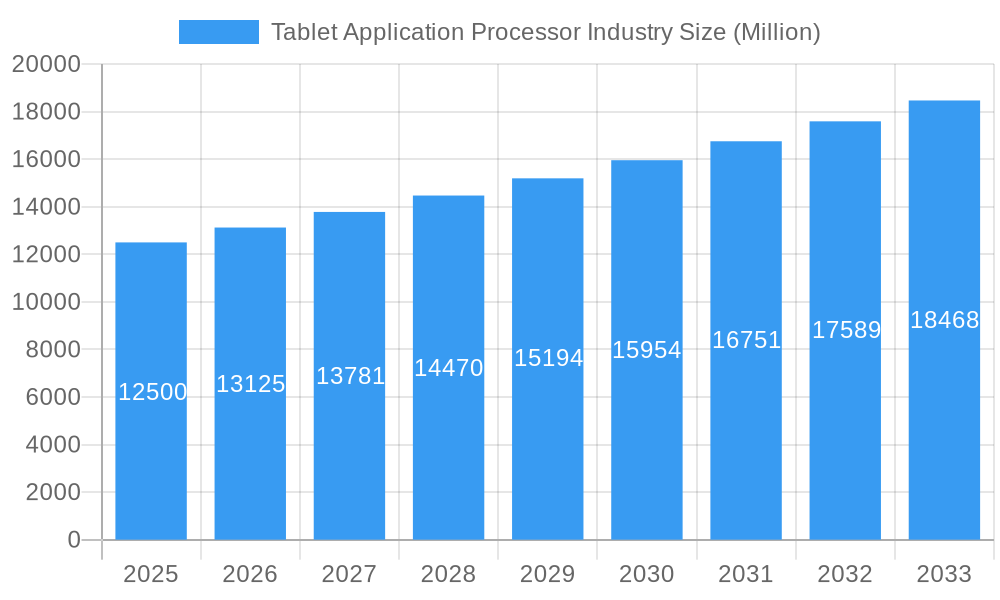
The global Tablet Application Processor market is projected for significant expansion. The market size was valued at $7.93 billion in the 2025 base year and is expected to grow at a Compound Annual Growth Rate (CAGR) of 15.71% through 2033. This growth is driven by the increasing demand for high-performance processing in tablets across consumer and enterprise sectors. Key drivers include advancements in mobile computing, enhanced user experiences, the proliferation of portable devices, the adoption of 5G connectivity, and the development of sophisticated applications requiring powerful processors. The market also sees a trend towards multi-core processors and 64-bit architecture for improved efficiency and compatibility.
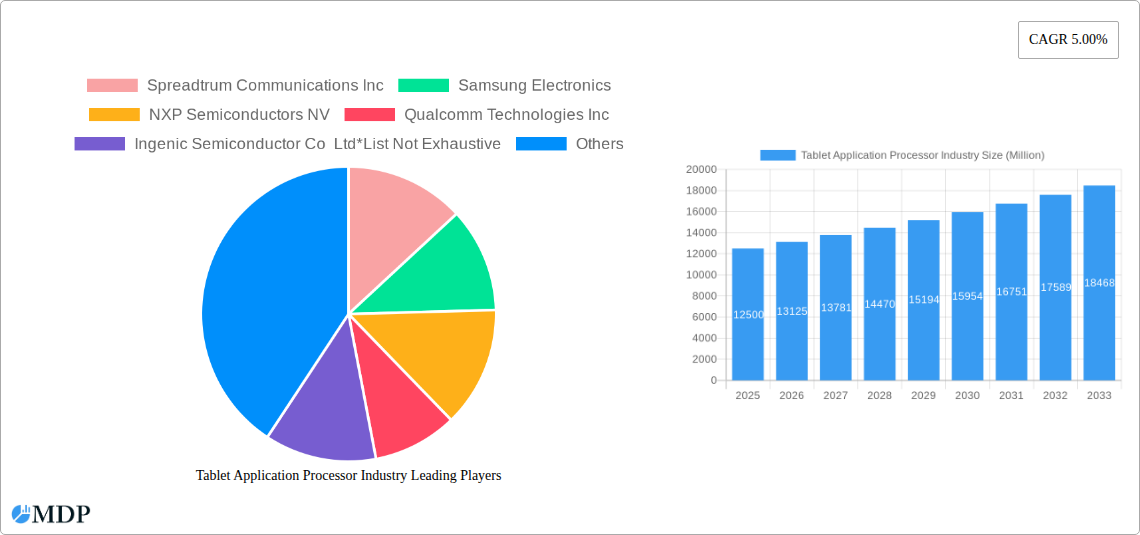
Tablet Application Processor Industry Market Size (In Billion)
Potential restraints include market commoditization and price pressures, along with extended replacement cycles for consumer tablets. However, continuous innovation by leading semiconductor manufacturers like Qualcomm, Samsung, and MediaTek is expected to mitigate these challenges. Market segmentation highlights the prominence of multi-core processors, especially in the commercial sector. The dominance of Android and Apple iOS operating systems will continue to influence processor demand. Geographically, the Asia Pacific region is anticipated to be a primary growth engine, supported by North America and Europe.
Tablet Application Processor Industry Company Market Share
Tablet Application Processor Industry: Market Dynamics, Trends, and Growth Forecast 2025–2033
This comprehensive report offers an in-depth analysis and future projections for the Tablet Application Processor Industry. Covering the period from 2025 to 2033, with 2025 as the base year, it provides strategic insights into market concentration, innovation drivers, regulatory landscapes, and emerging opportunities. This report is an essential resource for manufacturers, semiconductor suppliers, device makers, investors, and market analysts seeking a holistic understanding of the global tablet processor market.
Tablet Application Processor Industry Market Dynamics & Concentration
The Tablet Application Processor Industry exhibits a moderate to high concentration, with key players dominating market share. In the base year 2025, market share analysis reveals a significant portion held by established leaders. Innovation drivers, fueled by the relentless demand for enhanced performance, power efficiency, and advanced features such as AI capabilities, are a constant force. Regulatory frameworks, particularly concerning manufacturing standards and environmental compliance, play a crucial role in shaping industry practices. Product substitutes, though limited in direct competition, emerge from alternative computing devices. End-user trends, such as the growing adoption of tablets for productivity and specialized applications, directly influence processor demand. Mergers & Acquisitions (M&A) activities, with an estimated XX M&A deal counts in the historical period, have been instrumental in consolidating market power and expanding technological portfolios.
Tablet Application Processor Industry Trends & Analysis
The Tablet Application Processor Industry is poised for robust growth, driven by a confluence of technological advancements and evolving consumer preferences. The market is projected to experience a Compound Annual Growth Rate (CAGR) of approximately XX% from 2025 to 2033. This expansion is underpinned by several key factors. Firstly, the increasing integration of artificial intelligence (AI) and machine learning (ML) capabilities within tablet processors is a significant market growth driver, enabling more sophisticated on-device processing for applications ranging from image recognition to personalized user experiences. Secondly, the demand for higher performance and improved power efficiency continues to push innovation, leading to the development of more advanced architectures and manufacturing processes. Consumers are increasingly seeking tablets that can seamlessly handle demanding tasks, from professional content creation to immersive gaming. This trend is further amplified by the growing penetration of tablets in the commercial sector, where they are utilized for a wide array of business-critical applications, including point-of-sale systems, field service, and mobile workforce management. The competitive dynamics within the industry are intense, characterized by continuous R&D investments and strategic product differentiation. Companies are focusing on optimizing chip designs for specific operating systems and use cases, such as the burgeoning demand for 5G-enabled tablets and those designed for augmented reality (AR) experiences. The ongoing evolution of mobile operating systems, with continuous updates and new feature introductions, also necessitates regular upgrades in application processors to ensure compatibility and optimal performance. The shift towards more sustainable manufacturing practices and energy-efficient processors is also gaining traction, influencing product development and consumer choice.
Leading Markets & Segments in Tablet Application Processor Industry
The 64 Bit segment, particularly within the Android operating system and targeting the Household end-user segment, currently dominates the Tablet Application Processor Industry. This dominance is driven by several key factors, including the widespread adoption of Android devices due to their affordability and vast app ecosystem. The 64 Bit architecture is essential for supporting modern applications and operating systems, offering enhanced performance and memory handling capabilities crucial for multitasking and resource-intensive tasks prevalent in household usage, such as entertainment, education, and personal productivity.
- Dominant Region/Country: Asia Pacific continues to be a leading market due to its large consumer base and significant tablet manufacturing capabilities.
- Type Dominance (64 Bit): The prevalence of 64-bit processors is directly linked to the software ecosystem, with most modern applications and operating systems optimized for this architecture. This ensures better performance, security, and compatibility.
- Core Type Dominance (Multi-core): Multi-core processors are standard in the current tablet market, offering significant advantages in parallel processing, allowing for smoother multitasking and a more responsive user experience for a wide range of applications.
- Operating System Dominance (Android): Android's open-source nature and its presence on a vast array of devices across various price points make it the most widely used operating system, directly influencing the demand for compatible application processors.
- End User Dominance (Household): The household segment represents the largest consumer base for tablets, encompassing entertainment, educational purposes, and general web browsing, thereby driving the highest demand for application processors.
Tablet Application Processor Industry Product Developments
Recent product developments in the Tablet Application Processor Industry are characterized by a strong emphasis on enhanced AI/ML capabilities, improved power efficiency, and integrated connectivity features. Manufacturers are introducing processors with dedicated neural processing units (NPUs) to accelerate on-device artificial intelligence tasks, leading to smarter user experiences in areas like photography and voice recognition. Furthermore, advancements in lithography and chip design are yielding processors that offer superior performance while consuming less power, extending battery life for tablets. The integration of advanced graphics processing units (GPUs) and support for higher refresh rate displays are also key trends, catering to the growing demand for immersive gaming and multimedia consumption.
Key Drivers of Tablet Application Processor Industry Growth
Key drivers propelling the Tablet Application Processor Industry include the escalating demand for advanced mobile computing devices across consumer and enterprise segments. The continuous innovation in smartphone technology, which often trickles down to tablet processors, fuels performance improvements. The growing adoption of tablets for remote work, online education, and content creation necessitates more powerful and efficient processors. Furthermore, government initiatives promoting digital literacy and the increasing availability of affordable tablet devices in emerging markets are significant growth catalysts.
Challenges in the Tablet Application Processor Industry Market
The Tablet Application Processor Industry faces several challenges. Intense price competition among manufacturers can squeeze profit margins. The rapid pace of technological evolution requires substantial and continuous investment in research and development, posing a barrier for smaller players. Geopolitical factors and global supply chain disruptions, particularly concerning semiconductor manufacturing, can lead to production delays and increased costs. Furthermore, the increasing complexity of chip design and the stringent requirements for power efficiency and thermal management present ongoing technical hurdles.
Emerging Opportunities in Tablet Application Processor Industry
Emerging opportunities within the Tablet Application Processor Industry are primarily driven by the burgeoning demand for specialized tablet applications. The expansion of the augmented reality (AR) and virtual reality (VR) markets presents a significant avenue for processors with enhanced graphical capabilities and dedicated AR acceleration. The increasing integration of tablets in the Internet of Things (IoT) ecosystem, particularly for smart home and industrial automation, opens up new market segments. Furthermore, the development of foldable and flexible display technologies for tablets will require innovative processor designs capable of handling unique form factors and power requirements.
Leading Players in the Tablet Application Processor Industry Sector
- Spreadtrum Communications Inc
- Samsung Electronics
- NXP Semiconductors NV
- Qualcomm Technologies Inc
- Ingenic Semiconductor Co Ltd
- Texas Instruments Incorporated
- MediaTek Inc
- Nvidia Corporation
- Apple Inc
- HiSilicon Technologies Co Ltd
Key Milestones in Tablet Application Processor Industry Industry
- 2019: Introduction of new multi-core architectures with improved AI capabilities, enhancing on-device processing.
- 2020: Significant advancements in 7nm and 5nm fabrication processes, leading to substantial gains in power efficiency.
- 2021: Increased integration of 5G modems into tablet application processors, enabling next-generation connectivity.
- 2022: Emergence of processors with dedicated neural processing units (NPUs) for accelerated machine learning tasks.
- 2023: Growing focus on sustainable manufacturing and energy-efficient chip designs by major players.
- 2024: Launch of processors optimized for advanced AR/VR experiences and foldable tablet form factors.
Strategic Outlook for Tablet Application Processor Industry Market
The strategic outlook for the Tablet Application Processor Industry remains exceptionally strong, fueled by ongoing technological innovation and expanding application horizons. The market will continue to witness a surge in demand for processors that offer superior performance, advanced AI/ML capabilities, and enhanced power efficiency. Strategic partnerships between semiconductor manufacturers and device OEMs will be crucial for co-developing solutions tailored to emerging trends like foldable devices and AR/VR integration. The increasing adoption of tablets in enterprise and specialized sectors, alongside the persistent demand in the consumer market, will provide sustained growth opportunities, making it a highly dynamic and lucrative sector.
Tablet Application Processor Industry Segmentation
-
1. Type
- 1.1. 32 Bit
- 1.2. 64 Bit
- 1.3. Other Types
-
2. Core Type
- 2.1. Single Core
- 2.2. Multi-core
-
3. Operating System
- 3.1. Android
- 3.2. Apple iOS
- 3.3. Windows
-
4. End User
- 4.1. Household
- 4.2. Commercial
- 4.3. Other End Users
Tablet Application Processor Industry Segmentation By Geography
-
1. North America
- 1.1. United States
- 1.2. Canada
-
2. Europe
- 2.1. Germany
- 2.2. United Kingdom
- 2.3. France
- 2.4. Italy
- 2.5. Rest of Europe
-
3. Asia Pacific
- 3.1. India
- 3.2. China
- 3.3. Japan
- 3.4. South Korea
- 3.5. Rest of Asia Pacific
-
4. Rest of the World
- 4.1. Latin America
- 4.2. Middle East and Africa
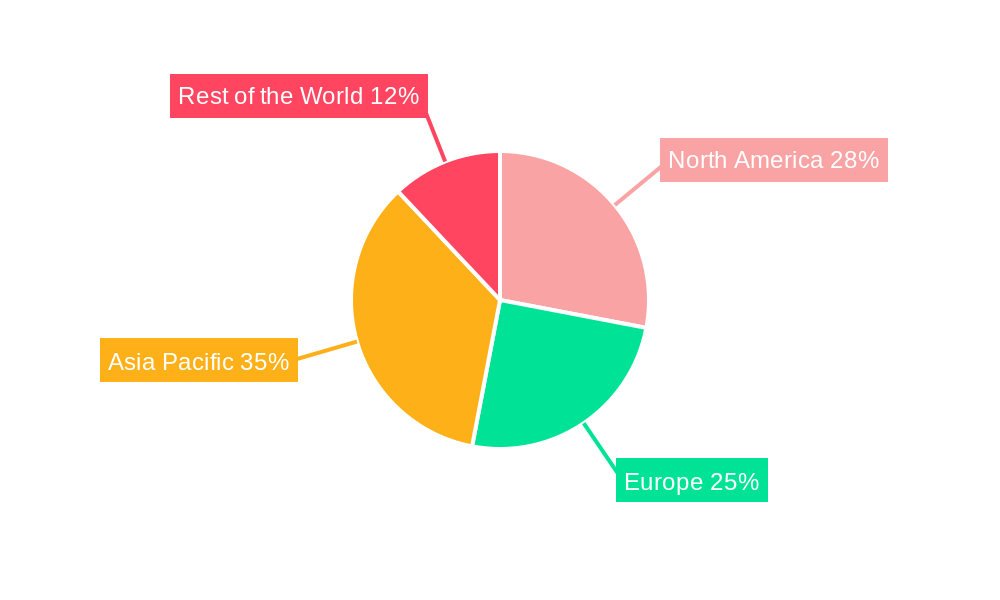
Tablet Application Processor Industry Regional Market Share
Geographic Coverage of Tablet Application Processor Industry
Tablet Application Processor Industry REPORT HIGHLIGHTS
| Aspects | Details |
|---|---|
| Study Period | 2020-2034 |
| Base Year | 2025 |
| Estimated Year | 2026 |
| Forecast Period | 2026-2034 |
| Historical Period | 2020-2025 |
| Growth Rate | CAGR of 15.71% from 2020-2034 |
| Segmentation |
|
Table of Contents
- 1. Introduction
- 1.1. Research Scope
- 1.2. Market Segmentation
- 1.3. Research Objective
- 1.4. Definitions and Assumptions
- 2. Executive Summary
- 2.1. Market Snapshot
- 3. Market Dynamics
- 3.1. Market Drivers
- 3.2. Market Restrains
- 3.3. Market Trends
- 3.4. Market Opportunities
- 4. Market Factor Analysis
- 4.1. Porters Five Forces
- 4.1.1. Bargaining Power of Suppliers
- 4.1.2. Bargaining Power of Buyers
- 4.1.3. Threat of New Entrants
- 4.1.4. Threat of Substitutes
- 4.1.5. Competitive Rivalry
- 4.2. PESTEL analysis
- 4.3. BCG Analysis
- 4.3.1. Stars (High Growth, High Market Share)
- 4.3.2. Cash Cows (Low Growth, High Market Share)
- 4.3.3. Question Mark (High Growth, Low Market Share)
- 4.3.4. Dogs (Low Growth, Low Market Share)
- 4.4. Ansoff Matrix Analysis
- 4.5. Supply Chain Analysis
- 4.6. Regulatory Landscape
- 4.7. Current Market Potential and Opportunity Assessment (TAM–SAM–SOM Framework)
- 4.8. MDP Analyst Note
- 4.1. Porters Five Forces
- 5. Market Analysis, Insights and Forecast 2021-2033
- 5.1. Market Analysis, Insights and Forecast - by Type
- 5.1.1. 32 Bit
- 5.1.2. 64 Bit
- 5.1.3. Other Types
- 5.2. Market Analysis, Insights and Forecast - by Core Type
- 5.2.1. Single Core
- 5.2.2. Multi-core
- 5.3. Market Analysis, Insights and Forecast - by Operating System
- 5.3.1. Android
- 5.3.2. Apple iOS
- 5.3.3. Windows
- 5.4. Market Analysis, Insights and Forecast - by End User
- 5.4.1. Household
- 5.4.2. Commercial
- 5.4.3. Other End Users
- 5.5. Market Analysis, Insights and Forecast - by Region
- 5.5.1. North America
- 5.5.2. Europe
- 5.5.3. Asia Pacific
- 5.5.4. Rest of the World
- 5.1. Market Analysis, Insights and Forecast - by Type
- 6. Global Tablet Application Processor Industry Analysis, Insights and Forecast, 2021-2033
- 6.1. Market Analysis, Insights and Forecast - by Type
- 6.1.1. 32 Bit
- 6.1.2. 64 Bit
- 6.1.3. Other Types
- 6.2. Market Analysis, Insights and Forecast - by Core Type
- 6.2.1. Single Core
- 6.2.2. Multi-core
- 6.3. Market Analysis, Insights and Forecast - by Operating System
- 6.3.1. Android
- 6.3.2. Apple iOS
- 6.3.3. Windows
- 6.4. Market Analysis, Insights and Forecast - by End User
- 6.4.1. Household
- 6.4.2. Commercial
- 6.4.3. Other End Users
- 6.1. Market Analysis, Insights and Forecast - by Type
- 7. North America Tablet Application Processor Industry Analysis, Insights and Forecast, 2020-2032
- 7.1. Market Analysis, Insights and Forecast - by Type
- 7.1.1. 32 Bit
- 7.1.2. 64 Bit
- 7.1.3. Other Types
- 7.2. Market Analysis, Insights and Forecast - by Core Type
- 7.2.1. Single Core
- 7.2.2. Multi-core
- 7.3. Market Analysis, Insights and Forecast - by Operating System
- 7.3.1. Android
- 7.3.2. Apple iOS
- 7.3.3. Windows
- 7.4. Market Analysis, Insights and Forecast - by End User
- 7.4.1. Household
- 7.4.2. Commercial
- 7.4.3. Other End Users
- 7.1. Market Analysis, Insights and Forecast - by Type
- 8. Europe Tablet Application Processor Industry Analysis, Insights and Forecast, 2020-2032
- 8.1. Market Analysis, Insights and Forecast - by Type
- 8.1.1. 32 Bit
- 8.1.2. 64 Bit
- 8.1.3. Other Types
- 8.2. Market Analysis, Insights and Forecast - by Core Type
- 8.2.1. Single Core
- 8.2.2. Multi-core
- 8.3. Market Analysis, Insights and Forecast - by Operating System
- 8.3.1. Android
- 8.3.2. Apple iOS
- 8.3.3. Windows
- 8.4. Market Analysis, Insights and Forecast - by End User
- 8.4.1. Household
- 8.4.2. Commercial
- 8.4.3. Other End Users
- 8.1. Market Analysis, Insights and Forecast - by Type
- 9. Asia Pacific Tablet Application Processor Industry Analysis, Insights and Forecast, 2020-2032
- 9.1. Market Analysis, Insights and Forecast - by Type
- 9.1.1. 32 Bit
- 9.1.2. 64 Bit
- 9.1.3. Other Types
- 9.2. Market Analysis, Insights and Forecast - by Core Type
- 9.2.1. Single Core
- 9.2.2. Multi-core
- 9.3. Market Analysis, Insights and Forecast - by Operating System
- 9.3.1. Android
- 9.3.2. Apple iOS
- 9.3.3. Windows
- 9.4. Market Analysis, Insights and Forecast - by End User
- 9.4.1. Household
- 9.4.2. Commercial
- 9.4.3. Other End Users
- 9.1. Market Analysis, Insights and Forecast - by Type
- 10. Rest of the World Tablet Application Processor Industry Analysis, Insights and Forecast, 2020-2032
- 10.1. Market Analysis, Insights and Forecast - by Type
- 10.1.1. 32 Bit
- 10.1.2. 64 Bit
- 10.1.3. Other Types
- 10.2. Market Analysis, Insights and Forecast - by Core Type
- 10.2.1. Single Core
- 10.2.2. Multi-core
- 10.3. Market Analysis, Insights and Forecast - by Operating System
- 10.3.1. Android
- 10.3.2. Apple iOS
- 10.3.3. Windows
- 10.4. Market Analysis, Insights and Forecast - by End User
- 10.4.1. Household
- 10.4.2. Commercial
- 10.4.3. Other End Users
- 10.1. Market Analysis, Insights and Forecast - by Type
- 11. Competitive Analysis
- 11.1. Company Profiles
- 11.1.1 Spreadtrum Communications Inc
- 11.1.1.1. Company Overview
- 11.1.1.2. Products
- 11.1.1.3. Company Financials
- 11.1.1.4. SWOT Analysis
- 11.1.2 Samsung Electronics
- 11.1.2.1. Company Overview
- 11.1.2.2. Products
- 11.1.2.3. Company Financials
- 11.1.2.4. SWOT Analysis
- 11.1.3 NXP Semiconductors NV
- 11.1.3.1. Company Overview
- 11.1.3.2. Products
- 11.1.3.3. Company Financials
- 11.1.3.4. SWOT Analysis
- 11.1.4 Qualcomm Technologies Inc
- 11.1.4.1. Company Overview
- 11.1.4.2. Products
- 11.1.4.3. Company Financials
- 11.1.4.4. SWOT Analysis
- 11.1.5 Ingenic Semiconductor Co Ltd*List Not Exhaustive
- 11.1.5.1. Company Overview
- 11.1.5.2. Products
- 11.1.5.3. Company Financials
- 11.1.5.4. SWOT Analysis
- 11.1.6 Texas Instruments Incorporated
- 11.1.6.1. Company Overview
- 11.1.6.2. Products
- 11.1.6.3. Company Financials
- 11.1.6.4. SWOT Analysis
- 11.1.7 MediaTek Inc
- 11.1.7.1. Company Overview
- 11.1.7.2. Products
- 11.1.7.3. Company Financials
- 11.1.7.4. SWOT Analysis
- 11.1.8 Nvidia Corporation
- 11.1.8.1. Company Overview
- 11.1.8.2. Products
- 11.1.8.3. Company Financials
- 11.1.8.4. SWOT Analysis
- 11.1.9 Apple Inc
- 11.1.9.1. Company Overview
- 11.1.9.2. Products
- 11.1.9.3. Company Financials
- 11.1.9.4. SWOT Analysis
- 11.1.10 HiSilicon Technologies Co Ltd
- 11.1.10.1. Company Overview
- 11.1.10.2. Products
- 11.1.10.3. Company Financials
- 11.1.10.4. SWOT Analysis
- 11.1.1 Spreadtrum Communications Inc
- 11.2. Market Entropy
- 11.2.1 Company's Key Areas Served
- 11.2.2 Recent Developments
- 11.3. Company Market Share Analysis 2025
- 11.3.1 Top 5 Companies Market Share Analysis
- 11.3.2 Top 3 Companies Market Share Analysis
- 11.4. List of Potential Customers
- 12. Research Methodology
List of Figures
- Figure 1: Global Tablet Application Processor Industry Revenue Breakdown (billion, %) by Region 2025 & 2033
- Figure 2: North America Tablet Application Processor Industry Revenue (billion), by Type 2025 & 2033
- Figure 3: North America Tablet Application Processor Industry Revenue Share (%), by Type 2025 & 2033
- Figure 4: North America Tablet Application Processor Industry Revenue (billion), by Core Type 2025 & 2033
- Figure 5: North America Tablet Application Processor Industry Revenue Share (%), by Core Type 2025 & 2033
- Figure 6: North America Tablet Application Processor Industry Revenue (billion), by Operating System 2025 & 2033
- Figure 7: North America Tablet Application Processor Industry Revenue Share (%), by Operating System 2025 & 2033
- Figure 8: North America Tablet Application Processor Industry Revenue (billion), by End User 2025 & 2033
- Figure 9: North America Tablet Application Processor Industry Revenue Share (%), by End User 2025 & 2033
- Figure 10: North America Tablet Application Processor Industry Revenue (billion), by Country 2025 & 2033
- Figure 11: North America Tablet Application Processor Industry Revenue Share (%), by Country 2025 & 2033
- Figure 12: Europe Tablet Application Processor Industry Revenue (billion), by Type 2025 & 2033
- Figure 13: Europe Tablet Application Processor Industry Revenue Share (%), by Type 2025 & 2033
- Figure 14: Europe Tablet Application Processor Industry Revenue (billion), by Core Type 2025 & 2033
- Figure 15: Europe Tablet Application Processor Industry Revenue Share (%), by Core Type 2025 & 2033
- Figure 16: Europe Tablet Application Processor Industry Revenue (billion), by Operating System 2025 & 2033
- Figure 17: Europe Tablet Application Processor Industry Revenue Share (%), by Operating System 2025 & 2033
- Figure 18: Europe Tablet Application Processor Industry Revenue (billion), by End User 2025 & 2033
- Figure 19: Europe Tablet Application Processor Industry Revenue Share (%), by End User 2025 & 2033
- Figure 20: Europe Tablet Application Processor Industry Revenue (billion), by Country 2025 & 2033
- Figure 21: Europe Tablet Application Processor Industry Revenue Share (%), by Country 2025 & 2033
- Figure 22: Asia Pacific Tablet Application Processor Industry Revenue (billion), by Type 2025 & 2033
- Figure 23: Asia Pacific Tablet Application Processor Industry Revenue Share (%), by Type 2025 & 2033
- Figure 24: Asia Pacific Tablet Application Processor Industry Revenue (billion), by Core Type 2025 & 2033
- Figure 25: Asia Pacific Tablet Application Processor Industry Revenue Share (%), by Core Type 2025 & 2033
- Figure 26: Asia Pacific Tablet Application Processor Industry Revenue (billion), by Operating System 2025 & 2033
- Figure 27: Asia Pacific Tablet Application Processor Industry Revenue Share (%), by Operating System 2025 & 2033
- Figure 28: Asia Pacific Tablet Application Processor Industry Revenue (billion), by End User 2025 & 2033
- Figure 29: Asia Pacific Tablet Application Processor Industry Revenue Share (%), by End User 2025 & 2033
- Figure 30: Asia Pacific Tablet Application Processor Industry Revenue (billion), by Country 2025 & 2033
- Figure 31: Asia Pacific Tablet Application Processor Industry Revenue Share (%), by Country 2025 & 2033
- Figure 32: Rest of the World Tablet Application Processor Industry Revenue (billion), by Type 2025 & 2033
- Figure 33: Rest of the World Tablet Application Processor Industry Revenue Share (%), by Type 2025 & 2033
- Figure 34: Rest of the World Tablet Application Processor Industry Revenue (billion), by Core Type 2025 & 2033
- Figure 35: Rest of the World Tablet Application Processor Industry Revenue Share (%), by Core Type 2025 & 2033
- Figure 36: Rest of the World Tablet Application Processor Industry Revenue (billion), by Operating System 2025 & 2033
- Figure 37: Rest of the World Tablet Application Processor Industry Revenue Share (%), by Operating System 2025 & 2033
- Figure 38: Rest of the World Tablet Application Processor Industry Revenue (billion), by End User 2025 & 2033
- Figure 39: Rest of the World Tablet Application Processor Industry Revenue Share (%), by End User 2025 & 2033
- Figure 40: Rest of the World Tablet Application Processor Industry Revenue (billion), by Country 2025 & 2033
- Figure 41: Rest of the World Tablet Application Processor Industry Revenue Share (%), by Country 2025 & 2033
List of Tables
- Table 1: Global Tablet Application Processor Industry Revenue billion Forecast, by Type 2020 & 2033
- Table 2: Global Tablet Application Processor Industry Revenue billion Forecast, by Core Type 2020 & 2033
- Table 3: Global Tablet Application Processor Industry Revenue billion Forecast, by Operating System 2020 & 2033
- Table 4: Global Tablet Application Processor Industry Revenue billion Forecast, by End User 2020 & 2033
- Table 5: Global Tablet Application Processor Industry Revenue billion Forecast, by Region 2020 & 2033
- Table 6: Global Tablet Application Processor Industry Revenue billion Forecast, by Type 2020 & 2033
- Table 7: Global Tablet Application Processor Industry Revenue billion Forecast, by Core Type 2020 & 2033
- Table 8: Global Tablet Application Processor Industry Revenue billion Forecast, by Operating System 2020 & 2033
- Table 9: Global Tablet Application Processor Industry Revenue billion Forecast, by End User 2020 & 2033
- Table 10: Global Tablet Application Processor Industry Revenue billion Forecast, by Country 2020 & 2033
- Table 11: United States Tablet Application Processor Industry Revenue (billion) Forecast, by Application 2020 & 2033
- Table 12: Canada Tablet Application Processor Industry Revenue (billion) Forecast, by Application 2020 & 2033
- Table 13: Global Tablet Application Processor Industry Revenue billion Forecast, by Type 2020 & 2033
- Table 14: Global Tablet Application Processor Industry Revenue billion Forecast, by Core Type 2020 & 2033
- Table 15: Global Tablet Application Processor Industry Revenue billion Forecast, by Operating System 2020 & 2033
- Table 16: Global Tablet Application Processor Industry Revenue billion Forecast, by End User 2020 & 2033
- Table 17: Global Tablet Application Processor Industry Revenue billion Forecast, by Country 2020 & 2033
- Table 18: Germany Tablet Application Processor Industry Revenue (billion) Forecast, by Application 2020 & 2033
- Table 19: United Kingdom Tablet Application Processor Industry Revenue (billion) Forecast, by Application 2020 & 2033
- Table 20: France Tablet Application Processor Industry Revenue (billion) Forecast, by Application 2020 & 2033
- Table 21: Italy Tablet Application Processor Industry Revenue (billion) Forecast, by Application 2020 & 2033
- Table 22: Rest of Europe Tablet Application Processor Industry Revenue (billion) Forecast, by Application 2020 & 2033
- Table 23: Global Tablet Application Processor Industry Revenue billion Forecast, by Type 2020 & 2033
- Table 24: Global Tablet Application Processor Industry Revenue billion Forecast, by Core Type 2020 & 2033
- Table 25: Global Tablet Application Processor Industry Revenue billion Forecast, by Operating System 2020 & 2033
- Table 26: Global Tablet Application Processor Industry Revenue billion Forecast, by End User 2020 & 2033
- Table 27: Global Tablet Application Processor Industry Revenue billion Forecast, by Country 2020 & 2033
- Table 28: India Tablet Application Processor Industry Revenue (billion) Forecast, by Application 2020 & 2033
- Table 29: China Tablet Application Processor Industry Revenue (billion) Forecast, by Application 2020 & 2033
- Table 30: Japan Tablet Application Processor Industry Revenue (billion) Forecast, by Application 2020 & 2033
- Table 31: South Korea Tablet Application Processor Industry Revenue (billion) Forecast, by Application 2020 & 2033
- Table 32: Rest of Asia Pacific Tablet Application Processor Industry Revenue (billion) Forecast, by Application 2020 & 2033
- Table 33: Global Tablet Application Processor Industry Revenue billion Forecast, by Type 2020 & 2033
- Table 34: Global Tablet Application Processor Industry Revenue billion Forecast, by Core Type 2020 & 2033
- Table 35: Global Tablet Application Processor Industry Revenue billion Forecast, by Operating System 2020 & 2033
- Table 36: Global Tablet Application Processor Industry Revenue billion Forecast, by End User 2020 & 2033
- Table 37: Global Tablet Application Processor Industry Revenue billion Forecast, by Country 2020 & 2033
- Table 38: Latin America Tablet Application Processor Industry Revenue (billion) Forecast, by Application 2020 & 2033
- Table 39: Middle East and Africa Tablet Application Processor Industry Revenue (billion) Forecast, by Application 2020 & 2033
Frequently Asked Questions
1. What is the projected Compound Annual Growth Rate (CAGR) of the Tablet Application Processor Industry?
The projected CAGR is approximately 15.71%.
2. Which companies are prominent players in the Tablet Application Processor Industry?
Key companies in the market include Spreadtrum Communications Inc, Samsung Electronics, NXP Semiconductors NV, Qualcomm Technologies Inc, Ingenic Semiconductor Co Ltd*List Not Exhaustive, Texas Instruments Incorporated, MediaTek Inc, Nvidia Corporation, Apple Inc, HiSilicon Technologies Co Ltd.
3. What are the main segments of the Tablet Application Processor Industry?
The market segments include Type, Core Type, Operating System, End User.
4. Can you provide details about the market size?
The market size is estimated to be USD 7.93 billion as of 2022.
5. What are some drivers contributing to market growth?
High Adoption of Octa-Core Application Processors; Increasing Adoption of Navigation Application in Automotive.
6. What are the notable trends driving market growth?
Apple iOS to Witness Significant Growth Rate.
7. Are there any restraints impacting market growth?
Concerns Regarding the Impact of COVID-19 On Supply Chain.
8. Can you provide examples of recent developments in the market?
N/A
9. What pricing options are available for accessing the report?
Pricing options include single-user, multi-user, and enterprise licenses priced at USD 4750, USD 5250, and USD 8750 respectively.
10. Is the market size provided in terms of value or volume?
The market size is provided in terms of value, measured in billion.
11. Are there any specific market keywords associated with the report?
Yes, the market keyword associated with the report is "Tablet Application Processor Industry," which aids in identifying and referencing the specific market segment covered.
12. How do I determine which pricing option suits my needs best?
The pricing options vary based on user requirements and access needs. Individual users may opt for single-user licenses, while businesses requiring broader access may choose multi-user or enterprise licenses for cost-effective access to the report.
13. Are there any additional resources or data provided in the Tablet Application Processor Industry report?
While the report offers comprehensive insights, it's advisable to review the specific contents or supplementary materials provided to ascertain if additional resources or data are available.
14. How can I stay updated on further developments or reports in the Tablet Application Processor Industry?
To stay informed about further developments, trends, and reports in the Tablet Application Processor Industry, consider subscribing to industry newsletters, following relevant companies and organizations, or regularly checking reputable industry news sources and publications.
Methodology
Step 1 - Identification of Relevant Samples Size from Population Database


Step 2 - Approaches for Defining Global Market Size (Value, Volume* & Price*)

Note*: In applicable scenarios
Step 3 - Data Sources
Primary Research
- Web Analytics
- Survey Reports
- Research Institute
- Latest Research Reports
- Opinion Leaders
Secondary Research
- Annual Reports
- White Paper
- Latest Press Release
- Industry Association
- Paid Database
- Investor Presentations

Step 4 - Data Triangulation
Involves using different sources of information in order to increase the validity of a study
These sources are likely to be stakeholders in a program - participants, other researchers, program staff, other community members, and so on.
Then we put all data in single framework & apply various statistical tools to find out the dynamic on the market.
During the analysis stage, feedback from the stakeholder groups would be compared to determine areas of agreement as well as areas of divergence