

Key Insights
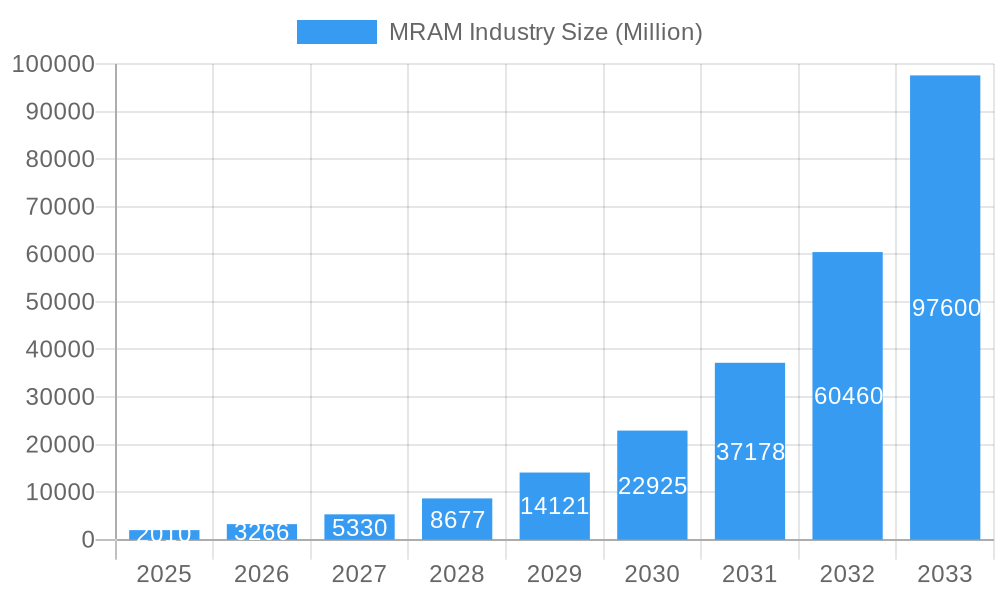
The Magnetoresistive Random Access Memory (MRAM) market is experiencing explosive growth, projected to reach \$2.01 billion in 2025 and exhibiting a remarkable Compound Annual Growth Rate (CAGR) of 62.12%. This surge is driven by several key factors. Firstly, the inherent advantages of MRAM, such as non-volatility, high speed, and low power consumption, are increasingly crucial in diverse applications demanding enhanced data retention and processing efficiency. The miniaturization trend in electronics fuels the demand for high-density memory solutions, making MRAM a compelling alternative to traditional memory technologies. Secondly, advancements in MRAM technology, particularly in Spin-transfer Torque (STT)-MRAM, are continuously improving performance metrics, reducing costs, and expanding addressable markets. The increasing integration of MRAM into embedded systems within consumer electronics, automotive, and industrial applications is a major growth driver. Finally, strong government support for technological advancements in several key regions further accelerates market expansion.
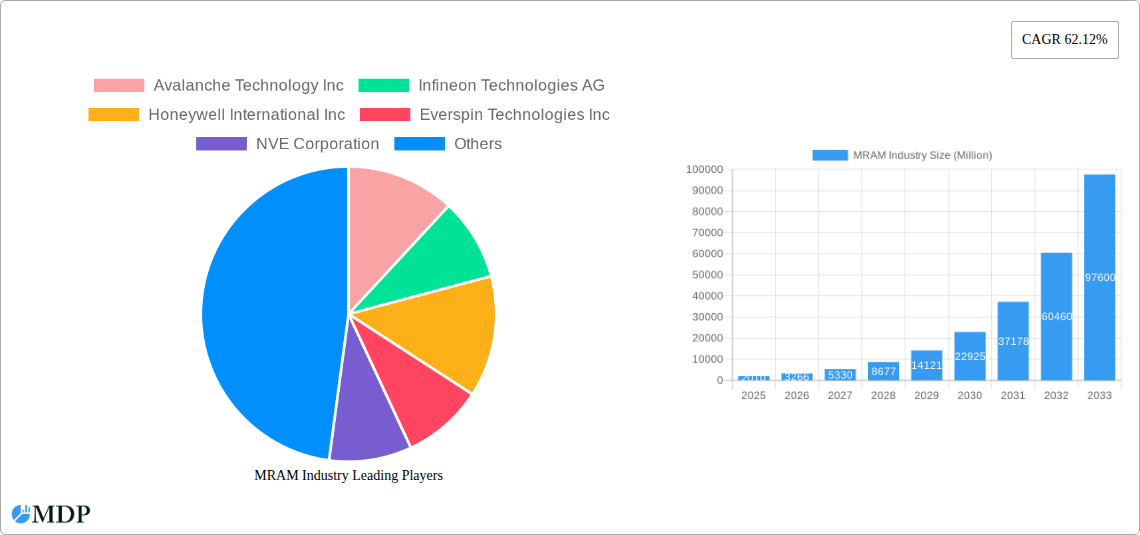
MRAM Industry Market Size (In Billion)
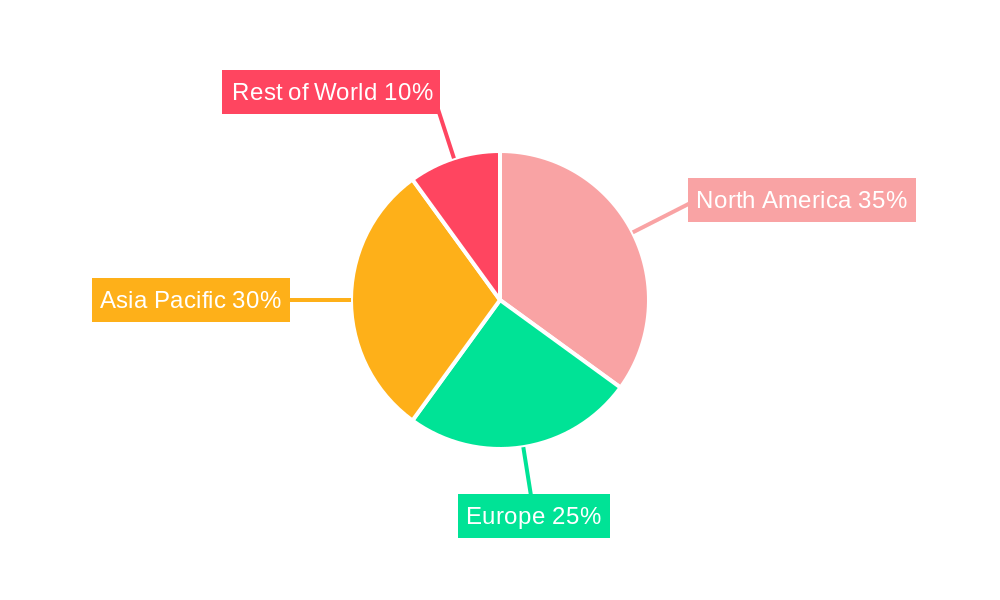
The market segmentation highlights the diversity of MRAM applications. While Stand-alone MRAM solutions are established, the rapid growth is primarily witnessed in Embedded MRAM, reflecting the integration trend. Consumer electronics, driven by the need for fast, persistent data storage in smartphones and wearables, remains a significant application segment. However, burgeoning adoption in high-growth sectors such as automotive (for advanced driver-assistance systems and in-vehicle infotainment) and data centers (for improved storage performance and reduced power consumption) is rapidly gaining traction. The aerospace and defense sectors present promising but comparatively smaller niches due to stringent reliability and security requirements. Geographical distribution shows a strong presence in North America and Asia Pacific, with China and the United States being key players. However, Europe and other regions are also experiencing significant growth, fueled by increasing demand across diverse industries. Competition is intense, with established players like Infineon, Samsung, and Intel competing with emerging specialized MRAM companies, leading to innovation and further market expansion.
MRAM Industry Company Market Share
MRAM Industry Market Report: 2019-2033
Dive deep into the burgeoning MRAM market with this comprehensive report, offering invaluable insights for stakeholders and investors. This detailed analysis covers the period from 2019 to 2033, with a focus on the estimated year 2025 and a forecast spanning 2025-2033. Benefit from a thorough examination of market dynamics, leading players, technological advancements, and emerging opportunities within the Magnetoresistive Random Access Memory (MRAM) sector. Expect concrete data, actionable intelligence, and a strategic outlook to guide your decisions in this rapidly evolving landscape. The global MRAM market is projected to reach xx Million by 2033.
MRAM Industry Market Dynamics & Concentration
The MRAM industry is experiencing significant growth driven by increasing demand for high-performance, non-volatile memory solutions across diverse applications. Market concentration is currently moderate, with several key players holding substantial market share, but a fragmented landscape exists amongst smaller niche players. Innovation in MRAM technology, such as the development of Spin-Transfer Torque (STT)-MRAM and Spin-Orbit Torque (SOT)-MRAM, is a major growth driver. Regulatory frameworks, while not overly restrictive, are evolving to address data security and environmental concerns related to semiconductor manufacturing. Product substitutes, like NAND flash and SRAM, still pose competition, but MRAM's advantages in speed and endurance are gradually overcoming these challenges. End-user trends show a strong shift towards higher data density and faster processing speeds, fueling the demand for advanced MRAM solutions. M&A activity in the sector has been relatively steady, with xx deals recorded in the past five years, consolidating market share and fostering technological advancements. This activity is anticipated to increase as the market matures.
- Market Share: The top 5 players currently hold an estimated xx% of the global market share.
- M&A Deal Count: Approximately xx M&A deals were recorded between 2019 and 2024.
- Key Innovation Drivers: STT-MRAM, SOT-MRAM advancements, improved integration density.
- Regulatory Landscape: Focus on data security and sustainable manufacturing practices.
MRAM Industry Trends & Analysis
The MRAM market exhibits robust growth, projected at a Compound Annual Growth Rate (CAGR) of xx% during the forecast period (2025-2033). This expansion is fueled by several key trends. The increasing demand for high-speed, low-power memory in applications like consumer electronics, automotive, and enterprise storage is a significant market driver. Technological disruptions, such as the development of SOT-MRAM, are enhancing MRAM's performance and expanding its applications. Consumer preferences are shifting towards devices with longer battery life and improved performance, thereby boosting the demand for MRAM’s energy-efficient features. Competitive dynamics are intense, with major semiconductor companies investing heavily in R&D to improve MRAM technology and expand market share. The market penetration of MRAM is increasing steadily, particularly in specialized applications requiring high performance and reliability, demonstrating the technology’s growing acceptance.
Leading Markets & Segments in MRAM Industry
The North American region currently dominates the MRAM market, driven by strong technological innovation and a high concentration of key players. Within the market segments:
- Type: STT-MRAM currently holds the largest market share due to its maturity and widespread adoption, followed by Toggle MRAM, with SOT-MRAM emerging as a promising technology.
- Offering: The embedded MRAM segment is currently dominant because of its integration within various chips and devices, while the standalone market is growing steadily as a separate product.
- Application: The automotive and enterprise storage sectors are major consumers of MRAM technology due to their need for reliable, high-speed memory solutions. The consumer electronics sector presents substantial growth potential.
Key Drivers:
- North America: Strong R&D investment, presence of major players, well-established semiconductor ecosystem.
- Asia Pacific: Rapid growth in consumer electronics and automotive sectors, increasing government support for technology development.
- Europe: Focus on automotive applications and high-tech manufacturing.
MRAM Industry Product Developments
Recent product innovations in the MRAM space focus on enhancing density, speed, and power efficiency. Companies are aggressively pursuing the development of SOT-MRAM, which offers potential advantages over STT-MRAM in terms of writing speed and power consumption. This trend is driving a shift towards higher integration density, enabling smaller and more energy-efficient devices. The market fit for these advancements is exceptionally strong, given the growing demand for improved performance and power efficiency in various applications, including consumer electronics, automotive, and data centers.
Key Drivers of MRAM Industry Growth
Several factors propel the growth of the MRAM industry. Technological advancements, such as the development of SOT-MRAM and the improvement of STT-MRAM’s performance parameters, are key contributors. The increasing demand for non-volatile memory in high-performance computing, automotive, and industrial applications is another significant driver. Furthermore, government initiatives promoting the development of advanced semiconductor technologies contribute to the sector's expansion. Examples include funding for R&D and tax incentives for semiconductor manufacturers.
Challenges in the MRAM Industry Market
The MRAM industry faces certain challenges. The relatively high cost of MRAM compared to other memory technologies can limit its adoption in cost-sensitive applications. Supply chain disruptions and geopolitical uncertainties can impact the availability of raw materials and manufacturing capacity. Intense competition among established semiconductor manufacturers presents a constant challenge to maintain market share and profitability. These factors collectively influence the industry's growth trajectory and require strategic adaptation by market players.
Emerging Opportunities in MRAM Industry
The MRAM market presents significant long-term growth opportunities. Technological breakthroughs in SOT-MRAM and other emerging MRAM technologies are set to further improve performance and reduce costs. Strategic partnerships between MRAM manufacturers and system integrators can accelerate market adoption and drive innovation. Market expansion into new application areas, such as artificial intelligence and edge computing, offers promising prospects. These factors suggest a positive outlook for the long-term growth of the MRAM industry.
Leading Players in the MRAM Industry Sector
- Avalanche Technology Inc
- Infineon Technologies AG
- Honeywell International Inc
- Everspin Technologies Inc
- NVE Corporation
- Samsung Electronics Co Ltd
- Tower Semiconductor
- Qualcomm Incorporated
- HFC Semiconductor Corporation
- Spin Transfer Technologies
- Crocus Nano Electronics LLC
- Numem
- Intel Corporation
Key Milestones in MRAM Industry Industry
- September 2022: Avalanche Technology and UMC launched high-reliability Persistent SRAM (P-SRAM) memory devices using STT-MRAM technology. This significantly improved density, reliability, endurance, and power efficiency compared to existing non-volatile solutions.
- July 2021: Researchers at IIT Delhi and NUS achieved higher integration density in SOT-MRAMs, demonstrating potential for improved reliability and writing speed compared to STT-MRAM.
Strategic Outlook for MRAM Industry Market
The MRAM market's future potential is substantial. Continued technological innovation, particularly in SOT-MRAM and other emerging technologies, will drive further cost reductions and performance improvements. Strategic partnerships and collaborations will accelerate market adoption across various applications. The expansion into new high-growth markets will further stimulate market growth. This creates considerable strategic opportunities for companies operating in the MRAM sector, leading to a positive and dynamic market landscape in the years to come.
MRAM Industry Segmentation
-
1. Type
- 1.1. Toggle MRAM
- 1.2. Spin-transfer Torque MRAM
-
2. Offering
- 2.1. Stand-alone
- 2.2. Embedded
-
3. Application
- 3.1. Consumer Electronics
- 3.2. Robotics
- 3.3. Enterprise Storage
- 3.4. Automotive
- 3.5. Aerospace and Defense
- 3.6. Other Applications
MRAM Industry Segmentation By Geography
- 1. North America
- 2. Europe
- 3. Asia Pacific
- 4. Latin America
- 5. Middle East and Africa
MRAM Industry Regional Market Share
Geographic Coverage of MRAM Industry
MRAM Industry REPORT HIGHLIGHTS
| Aspects | Details |
|---|---|
| Study Period | 2020-2034 |
| Base Year | 2025 |
| Estimated Year | 2026 |
| Forecast Period | 2026-2034 |
| Historical Period | 2020-2025 |
| Growth Rate | CAGR of 62.12% from 2020-2034 |
| Segmentation |
|
Table of Contents
- 1. Introduction
- 1.1. Research Scope
- 1.2. Market Segmentation
- 1.3. Research Objective
- 1.4. Definitions and Assumptions
- 2. Executive Summary
- 2.1. Market Snapshot
- 3. Market Dynamics
- 3.1. Market Drivers
- 3.2. Market Restrains
- 3.3. Market Trends
- 3.4. Market Opportunities
- 4. Market Factor Analysis
- 4.1. Porters Five Forces
- 4.1.1. Bargaining Power of Suppliers
- 4.1.2. Bargaining Power of Buyers
- 4.1.3. Threat of New Entrants
- 4.1.4. Threat of Substitutes
- 4.1.5. Competitive Rivalry
- 4.2. PESTEL analysis
- 4.3. BCG Analysis
- 4.3.1. Stars (High Growth, High Market Share)
- 4.3.2. Cash Cows (Low Growth, High Market Share)
- 4.3.3. Question Mark (High Growth, Low Market Share)
- 4.3.4. Dogs (Low Growth, Low Market Share)
- 4.4. Ansoff Matrix Analysis
- 4.5. Supply Chain Analysis
- 4.6. Regulatory Landscape
- 4.7. Current Market Potential and Opportunity Assessment (TAM–SAM–SOM Framework)
- 4.8. MDP Analyst Note
- 4.1. Porters Five Forces
- 5. Market Analysis, Insights and Forecast 2021-2033
- 5.1. Market Analysis, Insights and Forecast - by Type
- 5.1.1. Toggle MRAM
- 5.1.2. Spin-transfer Torque MRAM
- 5.2. Market Analysis, Insights and Forecast - by Offering
- 5.2.1. Stand-alone
- 5.2.2. Embedded
- 5.3. Market Analysis, Insights and Forecast - by Application
- 5.3.1. Consumer Electronics
- 5.3.2. Robotics
- 5.3.3. Enterprise Storage
- 5.3.4. Automotive
- 5.3.5. Aerospace and Defense
- 5.3.6. Other Applications
- 5.4. Market Analysis, Insights and Forecast - by Region
- 5.4.1. North America
- 5.4.2. Europe
- 5.4.3. Asia Pacific
- 5.4.4. Latin America
- 5.4.5. Middle East and Africa
- 5.1. Market Analysis, Insights and Forecast - by Type
- 6. Global MRAM Industry Analysis, Insights and Forecast, 2021-2033
- 6.1. Market Analysis, Insights and Forecast - by Type
- 6.1.1. Toggle MRAM
- 6.1.2. Spin-transfer Torque MRAM
- 6.2. Market Analysis, Insights and Forecast - by Offering
- 6.2.1. Stand-alone
- 6.2.2. Embedded
- 6.3. Market Analysis, Insights and Forecast - by Application
- 6.3.1. Consumer Electronics
- 6.3.2. Robotics
- 6.3.3. Enterprise Storage
- 6.3.4. Automotive
- 6.3.5. Aerospace and Defense
- 6.3.6. Other Applications
- 6.1. Market Analysis, Insights and Forecast - by Type
- 7. North America MRAM Industry Analysis, Insights and Forecast, 2020-2032
- 7.1. Market Analysis, Insights and Forecast - by Type
- 7.1.1. Toggle MRAM
- 7.1.2. Spin-transfer Torque MRAM
- 7.2. Market Analysis, Insights and Forecast - by Offering
- 7.2.1. Stand-alone
- 7.2.2. Embedded
- 7.3. Market Analysis, Insights and Forecast - by Application
- 7.3.1. Consumer Electronics
- 7.3.2. Robotics
- 7.3.3. Enterprise Storage
- 7.3.4. Automotive
- 7.3.5. Aerospace and Defense
- 7.3.6. Other Applications
- 7.1. Market Analysis, Insights and Forecast - by Type
- 8. Europe MRAM Industry Analysis, Insights and Forecast, 2020-2032
- 8.1. Market Analysis, Insights and Forecast - by Type
- 8.1.1. Toggle MRAM
- 8.1.2. Spin-transfer Torque MRAM
- 8.2. Market Analysis, Insights and Forecast - by Offering
- 8.2.1. Stand-alone
- 8.2.2. Embedded
- 8.3. Market Analysis, Insights and Forecast - by Application
- 8.3.1. Consumer Electronics
- 8.3.2. Robotics
- 8.3.3. Enterprise Storage
- 8.3.4. Automotive
- 8.3.5. Aerospace and Defense
- 8.3.6. Other Applications
- 8.1. Market Analysis, Insights and Forecast - by Type
- 9. Asia Pacific MRAM Industry Analysis, Insights and Forecast, 2020-2032
- 9.1. Market Analysis, Insights and Forecast - by Type
- 9.1.1. Toggle MRAM
- 9.1.2. Spin-transfer Torque MRAM
- 9.2. Market Analysis, Insights and Forecast - by Offering
- 9.2.1. Stand-alone
- 9.2.2. Embedded
- 9.3. Market Analysis, Insights and Forecast - by Application
- 9.3.1. Consumer Electronics
- 9.3.2. Robotics
- 9.3.3. Enterprise Storage
- 9.3.4. Automotive
- 9.3.5. Aerospace and Defense
- 9.3.6. Other Applications
- 9.1. Market Analysis, Insights and Forecast - by Type
- 10. Latin America MRAM Industry Analysis, Insights and Forecast, 2020-2032
- 10.1. Market Analysis, Insights and Forecast - by Type
- 10.1.1. Toggle MRAM
- 10.1.2. Spin-transfer Torque MRAM
- 10.2. Market Analysis, Insights and Forecast - by Offering
- 10.2.1. Stand-alone
- 10.2.2. Embedded
- 10.3. Market Analysis, Insights and Forecast - by Application
- 10.3.1. Consumer Electronics
- 10.3.2. Robotics
- 10.3.3. Enterprise Storage
- 10.3.4. Automotive
- 10.3.5. Aerospace and Defense
- 10.3.6. Other Applications
- 10.1. Market Analysis, Insights and Forecast - by Type
- 11. Middle East and Africa MRAM Industry Analysis, Insights and Forecast, 2020-2032
- 11.1. Market Analysis, Insights and Forecast - by Type
- 11.1.1. Toggle MRAM
- 11.1.2. Spin-transfer Torque MRAM
- 11.2. Market Analysis, Insights and Forecast - by Offering
- 11.2.1. Stand-alone
- 11.2.2. Embedded
- 11.3. Market Analysis, Insights and Forecast - by Application
- 11.3.1. Consumer Electronics
- 11.3.2. Robotics
- 11.3.3. Enterprise Storage
- 11.3.4. Automotive
- 11.3.5. Aerospace and Defense
- 11.3.6. Other Applications
- 11.1. Market Analysis, Insights and Forecast - by Type
- 12. Competitive Analysis
- 12.1. Company Profiles
- 12.1.1 Avalanche Technology Inc
- 12.1.1.1. Company Overview
- 12.1.1.2. Products
- 12.1.1.3. Company Financials
- 12.1.1.4. SWOT Analysis
- 12.1.2 Infineon Technologies AG
- 12.1.2.1. Company Overview
- 12.1.2.2. Products
- 12.1.2.3. Company Financials
- 12.1.2.4. SWOT Analysis
- 12.1.3 Honeywell International Inc
- 12.1.3.1. Company Overview
- 12.1.3.2. Products
- 12.1.3.3. Company Financials
- 12.1.3.4. SWOT Analysis
- 12.1.4 Everspin Technologies Inc
- 12.1.4.1. Company Overview
- 12.1.4.2. Products
- 12.1.4.3. Company Financials
- 12.1.4.4. SWOT Analysis
- 12.1.5 NVE Corporation
- 12.1.5.1. Company Overview
- 12.1.5.2. Products
- 12.1.5.3. Company Financials
- 12.1.5.4. SWOT Analysis
- 12.1.6 Samsung Electronics Co Ltd
- 12.1.6.1. Company Overview
- 12.1.6.2. Products
- 12.1.6.3. Company Financials
- 12.1.6.4. SWOT Analysis
- 12.1.7 Tower Semiconductor
- 12.1.7.1. Company Overview
- 12.1.7.2. Products
- 12.1.7.3. Company Financials
- 12.1.7.4. SWOT Analysis
- 12.1.8 Qualcomm Incorporated
- 12.1.8.1. Company Overview
- 12.1.8.2. Products
- 12.1.8.3. Company Financials
- 12.1.8.4. SWOT Analysis
- 12.1.9 HFC Semiconductor Corporation
- 12.1.9.1. Company Overview
- 12.1.9.2. Products
- 12.1.9.3. Company Financials
- 12.1.9.4. SWOT Analysis
- 12.1.10 Spin Transfer Technologies
- 12.1.10.1. Company Overview
- 12.1.10.2. Products
- 12.1.10.3. Company Financials
- 12.1.10.4. SWOT Analysis
- 12.1.11 Crocus Nano Electronics LLC
- 12.1.11.1. Company Overview
- 12.1.11.2. Products
- 12.1.11.3. Company Financials
- 12.1.11.4. SWOT Analysis
- 12.1.12 Numem
- 12.1.12.1. Company Overview
- 12.1.12.2. Products
- 12.1.12.3. Company Financials
- 12.1.12.4. SWOT Analysis
- 12.1.13 Intel Corporation
- 12.1.13.1. Company Overview
- 12.1.13.2. Products
- 12.1.13.3. Company Financials
- 12.1.13.4. SWOT Analysis
- 12.1.1 Avalanche Technology Inc
- 12.2. Market Entropy
- 12.2.1 Company's Key Areas Served
- 12.2.2 Recent Developments
- 12.3. Company Market Share Analysis 2025
- 12.3.1 Top 5 Companies Market Share Analysis
- 12.3.2 Top 3 Companies Market Share Analysis
- 12.4. List of Potential Customers
- 13. Research Methodology
List of Figures
- Figure 1: Global MRAM Industry Revenue Breakdown (Million, %) by Region 2025 & 2033
- Figure 2: Global MRAM Industry Volume Breakdown (K Unit, %) by Region 2025 & 2033
- Figure 3: North America MRAM Industry Revenue (Million), by Type 2025 & 2033
- Figure 4: North America MRAM Industry Volume (K Unit), by Type 2025 & 2033
- Figure 5: North America MRAM Industry Revenue Share (%), by Type 2025 & 2033
- Figure 6: North America MRAM Industry Volume Share (%), by Type 2025 & 2033
- Figure 7: North America MRAM Industry Revenue (Million), by Offering 2025 & 2033
- Figure 8: North America MRAM Industry Volume (K Unit), by Offering 2025 & 2033
- Figure 9: North America MRAM Industry Revenue Share (%), by Offering 2025 & 2033
- Figure 10: North America MRAM Industry Volume Share (%), by Offering 2025 & 2033
- Figure 11: North America MRAM Industry Revenue (Million), by Application 2025 & 2033
- Figure 12: North America MRAM Industry Volume (K Unit), by Application 2025 & 2033
- Figure 13: North America MRAM Industry Revenue Share (%), by Application 2025 & 2033
- Figure 14: North America MRAM Industry Volume Share (%), by Application 2025 & 2033
- Figure 15: North America MRAM Industry Revenue (Million), by Country 2025 & 2033
- Figure 16: North America MRAM Industry Volume (K Unit), by Country 2025 & 2033
- Figure 17: North America MRAM Industry Revenue Share (%), by Country 2025 & 2033
- Figure 18: North America MRAM Industry Volume Share (%), by Country 2025 & 2033
- Figure 19: Europe MRAM Industry Revenue (Million), by Type 2025 & 2033
- Figure 20: Europe MRAM Industry Volume (K Unit), by Type 2025 & 2033
- Figure 21: Europe MRAM Industry Revenue Share (%), by Type 2025 & 2033
- Figure 22: Europe MRAM Industry Volume Share (%), by Type 2025 & 2033
- Figure 23: Europe MRAM Industry Revenue (Million), by Offering 2025 & 2033
- Figure 24: Europe MRAM Industry Volume (K Unit), by Offering 2025 & 2033
- Figure 25: Europe MRAM Industry Revenue Share (%), by Offering 2025 & 2033
- Figure 26: Europe MRAM Industry Volume Share (%), by Offering 2025 & 2033
- Figure 27: Europe MRAM Industry Revenue (Million), by Application 2025 & 2033
- Figure 28: Europe MRAM Industry Volume (K Unit), by Application 2025 & 2033
- Figure 29: Europe MRAM Industry Revenue Share (%), by Application 2025 & 2033
- Figure 30: Europe MRAM Industry Volume Share (%), by Application 2025 & 2033
- Figure 31: Europe MRAM Industry Revenue (Million), by Country 2025 & 2033
- Figure 32: Europe MRAM Industry Volume (K Unit), by Country 2025 & 2033
- Figure 33: Europe MRAM Industry Revenue Share (%), by Country 2025 & 2033
- Figure 34: Europe MRAM Industry Volume Share (%), by Country 2025 & 2033
- Figure 35: Asia Pacific MRAM Industry Revenue (Million), by Type 2025 & 2033
- Figure 36: Asia Pacific MRAM Industry Volume (K Unit), by Type 2025 & 2033
- Figure 37: Asia Pacific MRAM Industry Revenue Share (%), by Type 2025 & 2033
- Figure 38: Asia Pacific MRAM Industry Volume Share (%), by Type 2025 & 2033
- Figure 39: Asia Pacific MRAM Industry Revenue (Million), by Offering 2025 & 2033
- Figure 40: Asia Pacific MRAM Industry Volume (K Unit), by Offering 2025 & 2033
- Figure 41: Asia Pacific MRAM Industry Revenue Share (%), by Offering 2025 & 2033
- Figure 42: Asia Pacific MRAM Industry Volume Share (%), by Offering 2025 & 2033
- Figure 43: Asia Pacific MRAM Industry Revenue (Million), by Application 2025 & 2033
- Figure 44: Asia Pacific MRAM Industry Volume (K Unit), by Application 2025 & 2033
- Figure 45: Asia Pacific MRAM Industry Revenue Share (%), by Application 2025 & 2033
- Figure 46: Asia Pacific MRAM Industry Volume Share (%), by Application 2025 & 2033
- Figure 47: Asia Pacific MRAM Industry Revenue (Million), by Country 2025 & 2033
- Figure 48: Asia Pacific MRAM Industry Volume (K Unit), by Country 2025 & 2033
- Figure 49: Asia Pacific MRAM Industry Revenue Share (%), by Country 2025 & 2033
- Figure 50: Asia Pacific MRAM Industry Volume Share (%), by Country 2025 & 2033
- Figure 51: Latin America MRAM Industry Revenue (Million), by Type 2025 & 2033
- Figure 52: Latin America MRAM Industry Volume (K Unit), by Type 2025 & 2033
- Figure 53: Latin America MRAM Industry Revenue Share (%), by Type 2025 & 2033
- Figure 54: Latin America MRAM Industry Volume Share (%), by Type 2025 & 2033
- Figure 55: Latin America MRAM Industry Revenue (Million), by Offering 2025 & 2033
- Figure 56: Latin America MRAM Industry Volume (K Unit), by Offering 2025 & 2033
- Figure 57: Latin America MRAM Industry Revenue Share (%), by Offering 2025 & 2033
- Figure 58: Latin America MRAM Industry Volume Share (%), by Offering 2025 & 2033
- Figure 59: Latin America MRAM Industry Revenue (Million), by Application 2025 & 2033
- Figure 60: Latin America MRAM Industry Volume (K Unit), by Application 2025 & 2033
- Figure 61: Latin America MRAM Industry Revenue Share (%), by Application 2025 & 2033
- Figure 62: Latin America MRAM Industry Volume Share (%), by Application 2025 & 2033
- Figure 63: Latin America MRAM Industry Revenue (Million), by Country 2025 & 2033
- Figure 64: Latin America MRAM Industry Volume (K Unit), by Country 2025 & 2033
- Figure 65: Latin America MRAM Industry Revenue Share (%), by Country 2025 & 2033
- Figure 66: Latin America MRAM Industry Volume Share (%), by Country 2025 & 2033
- Figure 67: Middle East and Africa MRAM Industry Revenue (Million), by Type 2025 & 2033
- Figure 68: Middle East and Africa MRAM Industry Volume (K Unit), by Type 2025 & 2033
- Figure 69: Middle East and Africa MRAM Industry Revenue Share (%), by Type 2025 & 2033
- Figure 70: Middle East and Africa MRAM Industry Volume Share (%), by Type 2025 & 2033
- Figure 71: Middle East and Africa MRAM Industry Revenue (Million), by Offering 2025 & 2033
- Figure 72: Middle East and Africa MRAM Industry Volume (K Unit), by Offering 2025 & 2033
- Figure 73: Middle East and Africa MRAM Industry Revenue Share (%), by Offering 2025 & 2033
- Figure 74: Middle East and Africa MRAM Industry Volume Share (%), by Offering 2025 & 2033
- Figure 75: Middle East and Africa MRAM Industry Revenue (Million), by Application 2025 & 2033
- Figure 76: Middle East and Africa MRAM Industry Volume (K Unit), by Application 2025 & 2033
- Figure 77: Middle East and Africa MRAM Industry Revenue Share (%), by Application 2025 & 2033
- Figure 78: Middle East and Africa MRAM Industry Volume Share (%), by Application 2025 & 2033
- Figure 79: Middle East and Africa MRAM Industry Revenue (Million), by Country 2025 & 2033
- Figure 80: Middle East and Africa MRAM Industry Volume (K Unit), by Country 2025 & 2033
- Figure 81: Middle East and Africa MRAM Industry Revenue Share (%), by Country 2025 & 2033
- Figure 82: Middle East and Africa MRAM Industry Volume Share (%), by Country 2025 & 2033
List of Tables
- Table 1: Global MRAM Industry Revenue Million Forecast, by Type 2020 & 2033
- Table 2: Global MRAM Industry Volume K Unit Forecast, by Type 2020 & 2033
- Table 3: Global MRAM Industry Revenue Million Forecast, by Offering 2020 & 2033
- Table 4: Global MRAM Industry Volume K Unit Forecast, by Offering 2020 & 2033
- Table 5: Global MRAM Industry Revenue Million Forecast, by Application 2020 & 2033
- Table 6: Global MRAM Industry Volume K Unit Forecast, by Application 2020 & 2033
- Table 7: Global MRAM Industry Revenue Million Forecast, by Region 2020 & 2033
- Table 8: Global MRAM Industry Volume K Unit Forecast, by Region 2020 & 2033
- Table 9: Global MRAM Industry Revenue Million Forecast, by Type 2020 & 2033
- Table 10: Global MRAM Industry Volume K Unit Forecast, by Type 2020 & 2033
- Table 11: Global MRAM Industry Revenue Million Forecast, by Offering 2020 & 2033
- Table 12: Global MRAM Industry Volume K Unit Forecast, by Offering 2020 & 2033
- Table 13: Global MRAM Industry Revenue Million Forecast, by Application 2020 & 2033
- Table 14: Global MRAM Industry Volume K Unit Forecast, by Application 2020 & 2033
- Table 15: Global MRAM Industry Revenue Million Forecast, by Country 2020 & 2033
- Table 16: Global MRAM Industry Volume K Unit Forecast, by Country 2020 & 2033
- Table 17: Global MRAM Industry Revenue Million Forecast, by Type 2020 & 2033
- Table 18: Global MRAM Industry Volume K Unit Forecast, by Type 2020 & 2033
- Table 19: Global MRAM Industry Revenue Million Forecast, by Offering 2020 & 2033
- Table 20: Global MRAM Industry Volume K Unit Forecast, by Offering 2020 & 2033
- Table 21: Global MRAM Industry Revenue Million Forecast, by Application 2020 & 2033
- Table 22: Global MRAM Industry Volume K Unit Forecast, by Application 2020 & 2033
- Table 23: Global MRAM Industry Revenue Million Forecast, by Country 2020 & 2033
- Table 24: Global MRAM Industry Volume K Unit Forecast, by Country 2020 & 2033
- Table 25: Global MRAM Industry Revenue Million Forecast, by Type 2020 & 2033
- Table 26: Global MRAM Industry Volume K Unit Forecast, by Type 2020 & 2033
- Table 27: Global MRAM Industry Revenue Million Forecast, by Offering 2020 & 2033
- Table 28: Global MRAM Industry Volume K Unit Forecast, by Offering 2020 & 2033
- Table 29: Global MRAM Industry Revenue Million Forecast, by Application 2020 & 2033
- Table 30: Global MRAM Industry Volume K Unit Forecast, by Application 2020 & 2033
- Table 31: Global MRAM Industry Revenue Million Forecast, by Country 2020 & 2033
- Table 32: Global MRAM Industry Volume K Unit Forecast, by Country 2020 & 2033
- Table 33: Global MRAM Industry Revenue Million Forecast, by Type 2020 & 2033
- Table 34: Global MRAM Industry Volume K Unit Forecast, by Type 2020 & 2033
- Table 35: Global MRAM Industry Revenue Million Forecast, by Offering 2020 & 2033
- Table 36: Global MRAM Industry Volume K Unit Forecast, by Offering 2020 & 2033
- Table 37: Global MRAM Industry Revenue Million Forecast, by Application 2020 & 2033
- Table 38: Global MRAM Industry Volume K Unit Forecast, by Application 2020 & 2033
- Table 39: Global MRAM Industry Revenue Million Forecast, by Country 2020 & 2033
- Table 40: Global MRAM Industry Volume K Unit Forecast, by Country 2020 & 2033
- Table 41: Global MRAM Industry Revenue Million Forecast, by Type 2020 & 2033
- Table 42: Global MRAM Industry Volume K Unit Forecast, by Type 2020 & 2033
- Table 43: Global MRAM Industry Revenue Million Forecast, by Offering 2020 & 2033
- Table 44: Global MRAM Industry Volume K Unit Forecast, by Offering 2020 & 2033
- Table 45: Global MRAM Industry Revenue Million Forecast, by Application 2020 & 2033
- Table 46: Global MRAM Industry Volume K Unit Forecast, by Application 2020 & 2033
- Table 47: Global MRAM Industry Revenue Million Forecast, by Country 2020 & 2033
- Table 48: Global MRAM Industry Volume K Unit Forecast, by Country 2020 & 2033
Frequently Asked Questions
1. What is the projected Compound Annual Growth Rate (CAGR) of the MRAM Industry?
The projected CAGR is approximately 62.12%.
2. Which companies are prominent players in the MRAM Industry?
Key companies in the market include Avalanche Technology Inc, Infineon Technologies AG, Honeywell International Inc, Everspin Technologies Inc, NVE Corporation, Samsung Electronics Co Ltd, Tower Semiconductor, Qualcomm Incorporated, HFC Semiconductor Corporation, Spin Transfer Technologies, Crocus Nano Electronics LLC, Numem, Intel Corporation.
3. What are the main segments of the MRAM Industry?
The market segments include Type, Offering, Application.
4. Can you provide details about the market size?
The market size is estimated to be USD 2.01 Million as of 2022.
5. What are some drivers contributing to market growth?
Increasing Demand for Miniaturization of Electronic Devices; Increased Use of MRAM in RFID Tags.
6. What are the notable trends driving market growth?
Consumer Electronics May Experience Significant Growth.
7. Are there any restraints impacting market growth?
Increasing Preference for Live Person Interaction.
8. Can you provide examples of recent developments in the market?
September 2022 - Avalanche Technology, a next-generation MRAM technology provider, and United Microelectronics Corporation (UMC), a semiconductor foundry, launched their new high-reliability Persistent SRAM (P-SRAM) memory devices through UMC's 22nm process technology. The memory device would be based on Avalanche Technology's latest generation of Spin Transfer Torque Magneto-resistive RAM (STT-MRAM) technology and would offer its customers significant density, reliability, endurance, and power benefits over the existing non-volatile solutions.
9. What pricing options are available for accessing the report?
Pricing options include single-user, multi-user, and enterprise licenses priced at USD 4750, USD 5250, and USD 8750 respectively.
10. Is the market size provided in terms of value or volume?
The market size is provided in terms of value, measured in Million and volume, measured in K Unit.
11. Are there any specific market keywords associated with the report?
Yes, the market keyword associated with the report is "MRAM Industry," which aids in identifying and referencing the specific market segment covered.
12. How do I determine which pricing option suits my needs best?
The pricing options vary based on user requirements and access needs. Individual users may opt for single-user licenses, while businesses requiring broader access may choose multi-user or enterprise licenses for cost-effective access to the report.
13. Are there any additional resources or data provided in the MRAM Industry report?
While the report offers comprehensive insights, it's advisable to review the specific contents or supplementary materials provided to ascertain if additional resources or data are available.
14. How can I stay updated on further developments or reports in the MRAM Industry?
To stay informed about further developments, trends, and reports in the MRAM Industry, consider subscribing to industry newsletters, following relevant companies and organizations, or regularly checking reputable industry news sources and publications.
Methodology
Step 1 - Identification of Relevant Samples Size from Population Database


Step 2 - Approaches for Defining Global Market Size (Value, Volume* & Price*)

Note*: In applicable scenarios
Step 3 - Data Sources
Primary Research
- Web Analytics
- Survey Reports
- Research Institute
- Latest Research Reports
- Opinion Leaders
Secondary Research
- Annual Reports
- White Paper
- Latest Press Release
- Industry Association
- Paid Database
- Investor Presentations

Step 4 - Data Triangulation
Involves using different sources of information in order to increase the validity of a study
These sources are likely to be stakeholders in a program - participants, other researchers, program staff, other community members, and so on.
Then we put all data in single framework & apply various statistical tools to find out the dynamic on the market.
During the analysis stage, feedback from the stakeholder groups would be compared to determine areas of agreement as well as areas of divergence