

Key Insights
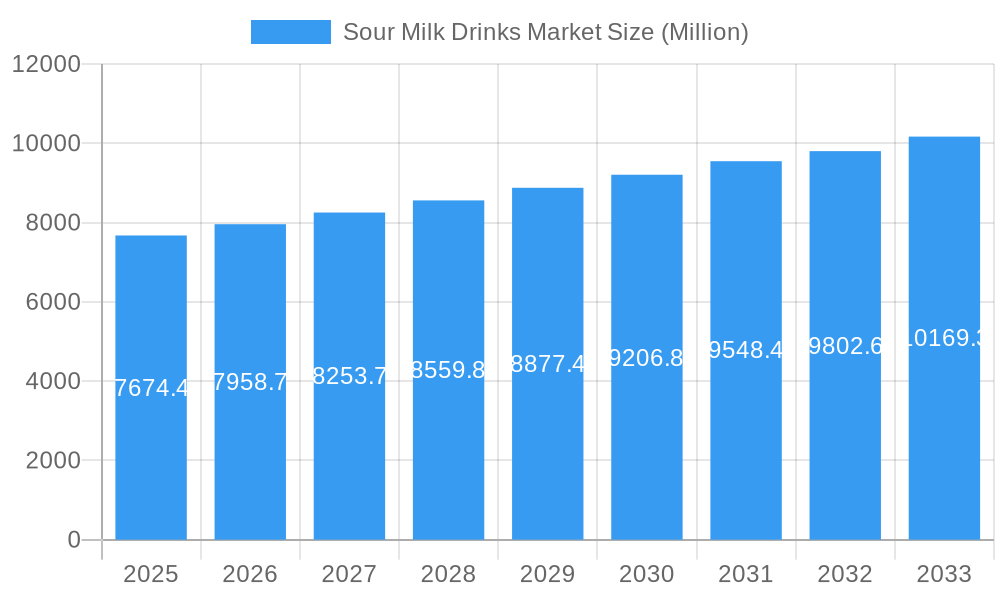
The global sour milk drinks market, projected at $9.03 billion in 2025, is poised for robust expansion. This growth, driven by a 5.19% Compound Annual Growth Rate (CAGR) from 2025 to 2033, is fueled by increasing consumer demand for healthier, functional food and beverage options. Rising health consciousness significantly boosts demand for probiotic-rich products such as yogurt and kefir. The inherent versatility of sour milk drinks in both culinary applications and as standalone beverages further solidifies their market presence across household and foodservice sectors. The off-trade channel, encompassing supermarkets and retail stores, currently leads, with the on-trade segment (restaurants, cafes) showing promising growth as these ingredients are increasingly integrated into menus. Continuous product innovation, including the introduction of diverse flavors and organic variants, enhances market appeal. Key challenges include volatile dairy prices and competition from alternative beverage categories. Geographically, North America and Europe hold substantial market share, while the Asia-Pacific region presents significant growth potential due to rising disposable incomes and evolving dietary habits.
Sour Milk Drinks Market Market Size (In Billion)
Market segmentation highlights yogurt and kefir as leading product types, with yogurt expected to maintain the largest share due to its established consumer base. The household end-use segment is anticipated to remain dominant, driven by daily consumption. Leading market players, including Nestlé SA and Almarai Company, leverage strong brand recognition and extensive distribution networks to maintain significant market positions. The forecast period (2025-2033) predicts sustained growth, underpinned by evolving consumer preferences, heightened health awareness, and ongoing product innovation within the sour milk drinks sector. However, this expansion will be tempered by challenges related to fluctuating raw material costs and competitive pressures from alternative beverage offerings.
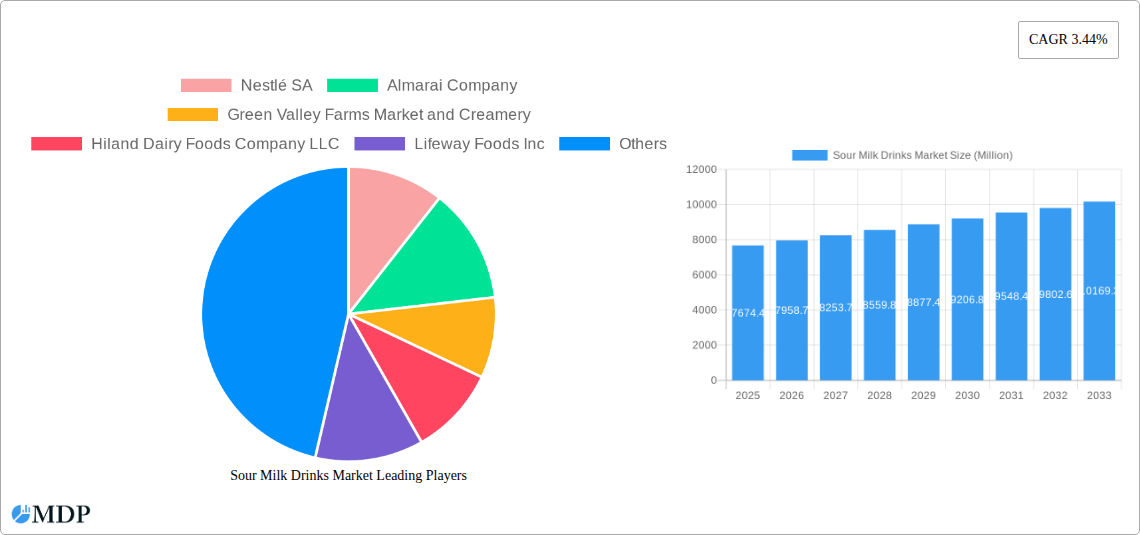
Sour Milk Drinks Market Company Market Share
Sour Milk Drinks Market: A Comprehensive Report (2019-2033)
This comprehensive report provides a detailed analysis of the Sour Milk Drinks Market, offering actionable insights for industry stakeholders, investors, and businesses seeking to understand and capitalize on this dynamic sector. The study period spans from 2019 to 2033, with 2025 serving as the base and estimated year. The report leverages robust data and in-depth analysis to provide a clear picture of market dynamics, trends, and opportunities. With a focus on key players like Nestlé SA, Almarai Company, and Lifeway Foods Inc., this report is an essential resource for navigating the complexities of the sour milk drinks market.
Sour Milk Drinks Market Dynamics & Concentration
The sour milk drinks market exhibits a moderately concentrated landscape, with several key players holding significant market share. Market concentration is influenced by factors including brand recognition, distribution networks, and product innovation. Nestlé SA and Almarai Company are major players, holding approximately xx% and xx% of the market share, respectively (2024 estimates). The market experiences dynamic shifts driven by continuous innovation in product offerings (e.g., flavored yogurts, probiotic drinks), evolving consumer preferences towards healthier options, and stringent regulatory frameworks governing food safety and labeling. Product substitutes, such as plant-based alternatives, pose a competitive threat, while M&A activities influence market consolidation. In the historical period (2019-2024), an estimated xx M&A deals occurred, shaping the competitive landscape. The report analyzes these factors meticulously using various metrics to provide a clear understanding of the market's structure and dynamics.
- Innovation Drivers: Probiotic benefits, functional ingredients, and diverse flavors fuel product innovation.
- Regulatory Frameworks: Food safety standards and labeling regulations significantly influence market dynamics.
- Product Substitutes: Plant-based alternatives and other beverages compete for market share.
- End-User Trends: Health-conscious consumers drive demand for functional and nutritious sour milk drinks.
- M&A Activities: Consolidation through mergers and acquisitions impacts market structure and competition.
Sour Milk Drinks Market Industry Trends & Analysis
The global sour milk drinks market is experiencing robust growth, with a projected CAGR of xx% during the forecast period (2025-2033). This growth is primarily driven by increasing consumer awareness of the health benefits associated with probiotic-rich drinks, rising disposable incomes, particularly in emerging economies, and the expanding availability of diverse product offerings. Technological advancements, such as improved fermentation techniques and packaging innovations, enhance product quality, shelf life, and convenience. Consumer preferences are shifting towards healthier, natural, and functional foods, boosting demand for sour milk drinks. Competitive dynamics are marked by intense rivalry amongst established players and emerging brands seeking to differentiate their offerings through unique flavor profiles, functional ingredients, and marketing strategies. Market penetration in developing nations remains a key growth driver, presenting significant opportunities for expansion.
Leading Markets & Segments in Sour Milk Drinks Market
The North American region currently dominates the sour milk drinks market, followed by Europe and Asia-Pacific. Within product types, yogurt maintains the highest market share, driven by its established consumer base and extensive product variety. Off-trade distribution channels (retail stores, supermarkets) significantly contribute to the market volume. The household end-use segment dominates owing to rising consumption among families.
Key Drivers by Segment:
- By Product Type:
- Yogurt: Wide acceptance, diverse product options, and health benefits drive growth.
- Kefir: Increasing popularity due to its perceived health benefits fuels segment growth.
- By Distribution Channel:
- Off-trade: Convenience and wide availability bolster off-trade channel dominance.
- By End-Use:
- Household: High consumption within households contributes significantly to the market size.
Sour Milk Drinks Market Product Developments
Recent product innovations focus on enhancing taste profiles, incorporating functional ingredients (e.g., prebiotics, vitamins), and exploring novel packaging formats to improve shelf life and convenience. Manufacturers are emphasizing the health benefits of probiotic strains and actively promoting these attributes to health-conscious consumers. These developments align with the growing demand for convenient and nutritious food and beverage options.
Key Drivers of Sour Milk Drinks Market Growth
Several factors contribute to the growth of the sour milk drinks market. Rising consumer awareness of probiotics and gut health is a crucial driver. Technological advancements in fermentation processes lead to better product quality and enhanced shelf life. The increasing prevalence of health-conscious lifestyles among consumers is another key growth catalyst.
Challenges in the Sour Milk Drinks Market Market
The sour milk drinks market faces challenges such as fluctuations in raw material prices, impacting production costs. Stringent food safety regulations and changing consumer preferences require manufacturers to constantly adapt. Intense competition and the emergence of plant-based alternatives put pressure on market share. Maintaining consistent product quality and navigating evolving consumer preferences are ongoing challenges.
Emerging Opportunities in Sour Milk Drinks Market
Expanding into emerging markets with high growth potential presents significant opportunities. The development of innovative product formulations with added functional ingredients holds promise. Strategic partnerships and collaborations with health and wellness brands offer avenues for market expansion.
Leading Players in the Sour Milk Drinks Market Sector
- Nestlé SA
- Almarai Company
- Green Valley Farms Market and Creamery
- Hiland Dairy Foods Company LLC
- Lifeway Foods Inc
- Dairy Farmers of America Inc
- Producers Dairy Foods Inc (Umpqua Dairy)
- Gujarat Co-operative Milk Marketing Federation Ltd
Key Milestones in Sour Milk Drinks Market Industry
- July 2022: Gujarat Co-operative Milk Marketing Federation Ltd. announced a USD 60 Million investment in a new dairy plant, expanding its buttermilk and curd production capacity. This signifies a significant commitment to market expansion within the region.
- August 2021: Lifeway Foods Inc. expanded its kefir distribution into the Irish market through Tesco, broadening its reach within the European Union.
- July 2021: Lifeway Foods Inc. further expanded its distribution of kefir into the French market via Costco France, indicating successful international expansion strategies.
Strategic Outlook for Sour Milk Drinks Market Market
The future of the sour milk drinks market appears bright, driven by continuous product innovation, expanding consumer base, and global market penetration. Strategic alliances, investments in research and development, and targeted marketing campaigns will play crucial roles in shaping future market dynamics. Companies that successfully adapt to changing consumer preferences and effectively manage supply chain challenges are poised for significant growth.
Sour Milk Drinks Market Segmentation
-
1. Distribution Channel
-
1.1. Off-Trade
- 1.1.1. Convenience Stores
- 1.1.2. Online Retail
- 1.1.3. Specialist Retailers
- 1.1.4. Supermarkets and Hypermarkets
- 1.1.5. Others (Warehouse clubs, gas stations, etc.)
- 1.2. On-Trade
-
1.1. Off-Trade
Sour Milk Drinks Market Segmentation By Geography
-
1. North America
- 1.1. United States
- 1.2. Canada
- 1.3. Mexico
-
2. South America
- 2.1. Brazil
- 2.2. Argentina
- 2.3. Rest of South America
-
3. Europe
- 3.1. United Kingdom
- 3.2. Germany
- 3.3. France
- 3.4. Italy
- 3.5. Spain
- 3.6. Russia
- 3.7. Benelux
- 3.8. Nordics
- 3.9. Rest of Europe
-
4. Middle East & Africa
- 4.1. Turkey
- 4.2. Israel
- 4.3. GCC
- 4.4. North Africa
- 4.5. South Africa
- 4.6. Rest of Middle East & Africa
-
5. Asia Pacific
- 5.1. China
- 5.2. India
- 5.3. Japan
- 5.4. South Korea
- 5.5. ASEAN
- 5.6. Oceania
- 5.7. Rest of Asia Pacific
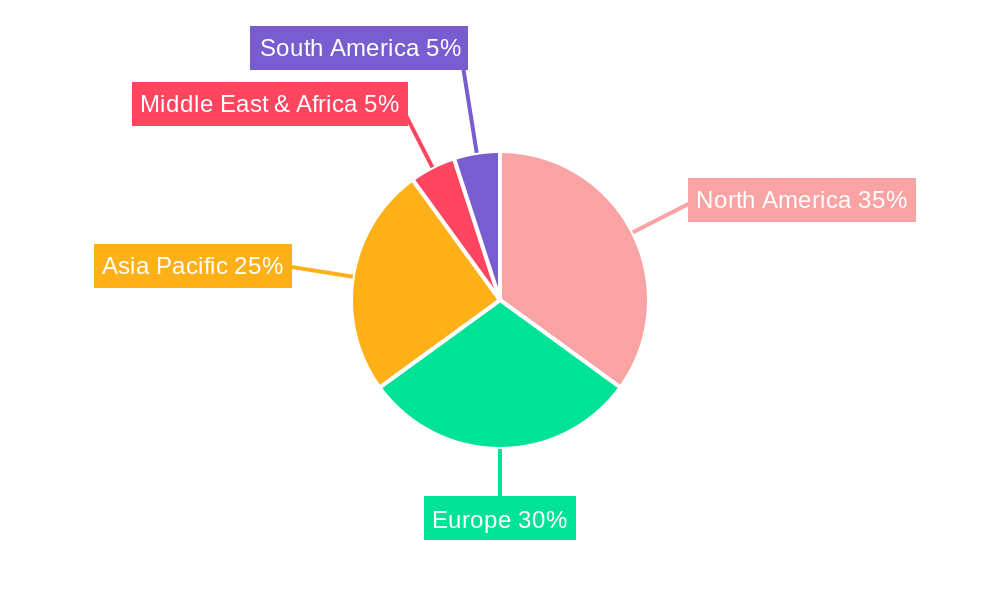
Sour Milk Drinks Market Regional Market Share
Geographic Coverage of Sour Milk Drinks Market
Sour Milk Drinks Market REPORT HIGHLIGHTS
| Aspects | Details |
|---|---|
| Study Period | 2020-2034 |
| Base Year | 2025 |
| Estimated Year | 2026 |
| Forecast Period | 2026-2034 |
| Historical Period | 2020-2025 |
| Growth Rate | CAGR of 5.19% from 2020-2034 |
| Segmentation |
|
Table of Contents
- 1. Introduction
- 1.1. Research Scope
- 1.2. Market Segmentation
- 1.3. Research Methodology
- 1.4. Definitions and Assumptions
- 2. Executive Summary
- 2.1. Introduction
- 3. Market Dynamics
- 3.1. Introduction
- 3.2. Market Drivers
- 3.2.1. Rising Demand for Clean Label Food & Beverage Products; Rising Demand for Dairy Products
- 3.3. Market Restrains
- 3.3.1. Presence of Preservatives in Ready Meals may Hamper the Market Growth
- 3.4. Market Trends
- 3.4.1. OTHER KEY INDUSTRY TRENDS COVERED IN THE REPORT
- 4. Market Factor Analysis
- 4.1. Porters Five Forces
- 4.2. Supply/Value Chain
- 4.3. PESTEL analysis
- 4.4. Market Entropy
- 4.5. Patent/Trademark Analysis
- 5. Global Sour Milk Drinks Market Analysis, Insights and Forecast, 2020-2032
- 5.1. Market Analysis, Insights and Forecast - by Distribution Channel
- 5.1.1. Off-Trade
- 5.1.1.1. Convenience Stores
- 5.1.1.2. Online Retail
- 5.1.1.3. Specialist Retailers
- 5.1.1.4. Supermarkets and Hypermarkets
- 5.1.1.5. Others (Warehouse clubs, gas stations, etc.)
- 5.1.2. On-Trade
- 5.1.1. Off-Trade
- 5.2. Market Analysis, Insights and Forecast - by Region
- 5.2.1. North America
- 5.2.2. South America
- 5.2.3. Europe
- 5.2.4. Middle East & Africa
- 5.2.5. Asia Pacific
- 5.1. Market Analysis, Insights and Forecast - by Distribution Channel
- 6. North America Sour Milk Drinks Market Analysis, Insights and Forecast, 2020-2032
- 6.1. Market Analysis, Insights and Forecast - by Distribution Channel
- 6.1.1. Off-Trade
- 6.1.1.1. Convenience Stores
- 6.1.1.2. Online Retail
- 6.1.1.3. Specialist Retailers
- 6.1.1.4. Supermarkets and Hypermarkets
- 6.1.1.5. Others (Warehouse clubs, gas stations, etc.)
- 6.1.2. On-Trade
- 6.1.1. Off-Trade
- 6.1. Market Analysis, Insights and Forecast - by Distribution Channel
- 7. South America Sour Milk Drinks Market Analysis, Insights and Forecast, 2020-2032
- 7.1. Market Analysis, Insights and Forecast - by Distribution Channel
- 7.1.1. Off-Trade
- 7.1.1.1. Convenience Stores
- 7.1.1.2. Online Retail
- 7.1.1.3. Specialist Retailers
- 7.1.1.4. Supermarkets and Hypermarkets
- 7.1.1.5. Others (Warehouse clubs, gas stations, etc.)
- 7.1.2. On-Trade
- 7.1.1. Off-Trade
- 7.1. Market Analysis, Insights and Forecast - by Distribution Channel
- 8. Europe Sour Milk Drinks Market Analysis, Insights and Forecast, 2020-2032
- 8.1. Market Analysis, Insights and Forecast - by Distribution Channel
- 8.1.1. Off-Trade
- 8.1.1.1. Convenience Stores
- 8.1.1.2. Online Retail
- 8.1.1.3. Specialist Retailers
- 8.1.1.4. Supermarkets and Hypermarkets
- 8.1.1.5. Others (Warehouse clubs, gas stations, etc.)
- 8.1.2. On-Trade
- 8.1.1. Off-Trade
- 8.1. Market Analysis, Insights and Forecast - by Distribution Channel
- 9. Middle East & Africa Sour Milk Drinks Market Analysis, Insights and Forecast, 2020-2032
- 9.1. Market Analysis, Insights and Forecast - by Distribution Channel
- 9.1.1. Off-Trade
- 9.1.1.1. Convenience Stores
- 9.1.1.2. Online Retail
- 9.1.1.3. Specialist Retailers
- 9.1.1.4. Supermarkets and Hypermarkets
- 9.1.1.5. Others (Warehouse clubs, gas stations, etc.)
- 9.1.2. On-Trade
- 9.1.1. Off-Trade
- 9.1. Market Analysis, Insights and Forecast - by Distribution Channel
- 10. Asia Pacific Sour Milk Drinks Market Analysis, Insights and Forecast, 2020-2032
- 10.1. Market Analysis, Insights and Forecast - by Distribution Channel
- 10.1.1. Off-Trade
- 10.1.1.1. Convenience Stores
- 10.1.1.2. Online Retail
- 10.1.1.3. Specialist Retailers
- 10.1.1.4. Supermarkets and Hypermarkets
- 10.1.1.5. Others (Warehouse clubs, gas stations, etc.)
- 10.1.2. On-Trade
- 10.1.1. Off-Trade
- 10.1. Market Analysis, Insights and Forecast - by Distribution Channel
- 11. Competitive Analysis
- 11.1. Global Market Share Analysis 2025
- 11.2. Company Profiles
- 11.2.1 Nestlé SA
- 11.2.1.1. Overview
- 11.2.1.2. Products
- 11.2.1.3. SWOT Analysis
- 11.2.1.4. Recent Developments
- 11.2.1.5. Financials (Based on Availability)
- 11.2.2 Almarai Company
- 11.2.2.1. Overview
- 11.2.2.2. Products
- 11.2.2.3. SWOT Analysis
- 11.2.2.4. Recent Developments
- 11.2.2.5. Financials (Based on Availability)
- 11.2.3 Green Valley Farms Market and Creamery
- 11.2.3.1. Overview
- 11.2.3.2. Products
- 11.2.3.3. SWOT Analysis
- 11.2.3.4. Recent Developments
- 11.2.3.5. Financials (Based on Availability)
- 11.2.4 Hiland Dairy Foods Company LLC
- 11.2.4.1. Overview
- 11.2.4.2. Products
- 11.2.4.3. SWOT Analysis
- 11.2.4.4. Recent Developments
- 11.2.4.5. Financials (Based on Availability)
- 11.2.5 Lifeway Foods Inc
- 11.2.5.1. Overview
- 11.2.5.2. Products
- 11.2.5.3. SWOT Analysis
- 11.2.5.4. Recent Developments
- 11.2.5.5. Financials (Based on Availability)
- 11.2.6 Dairy Farmers of America Inc
- 11.2.6.1. Overview
- 11.2.6.2. Products
- 11.2.6.3. SWOT Analysis
- 11.2.6.4. Recent Developments
- 11.2.6.5. Financials (Based on Availability)
- 11.2.7 Producers Dairy Foods Inc (Umpqua Dairy
- 11.2.7.1. Overview
- 11.2.7.2. Products
- 11.2.7.3. SWOT Analysis
- 11.2.7.4. Recent Developments
- 11.2.7.5. Financials (Based on Availability)
- 11.2.8 Gujarat Co-operative Milk Marketing Federation Ltd
- 11.2.8.1. Overview
- 11.2.8.2. Products
- 11.2.8.3. SWOT Analysis
- 11.2.8.4. Recent Developments
- 11.2.8.5. Financials (Based on Availability)
- 11.2.1 Nestlé SA
List of Figures
- Figure 1: Global Sour Milk Drinks Market Revenue Breakdown (billion, %) by Region 2025 & 2033
- Figure 2: Global Sour Milk Drinks Market Volume Breakdown (Liters, %) by Region 2025 & 2033
- Figure 3: North America Sour Milk Drinks Market Revenue (billion), by Distribution Channel 2025 & 2033
- Figure 4: North America Sour Milk Drinks Market Volume (Liters), by Distribution Channel 2025 & 2033
- Figure 5: North America Sour Milk Drinks Market Revenue Share (%), by Distribution Channel 2025 & 2033
- Figure 6: North America Sour Milk Drinks Market Volume Share (%), by Distribution Channel 2025 & 2033
- Figure 7: North America Sour Milk Drinks Market Revenue (billion), by Country 2025 & 2033
- Figure 8: North America Sour Milk Drinks Market Volume (Liters), by Country 2025 & 2033
- Figure 9: North America Sour Milk Drinks Market Revenue Share (%), by Country 2025 & 2033
- Figure 10: North America Sour Milk Drinks Market Volume Share (%), by Country 2025 & 2033
- Figure 11: South America Sour Milk Drinks Market Revenue (billion), by Distribution Channel 2025 & 2033
- Figure 12: South America Sour Milk Drinks Market Volume (Liters), by Distribution Channel 2025 & 2033
- Figure 13: South America Sour Milk Drinks Market Revenue Share (%), by Distribution Channel 2025 & 2033
- Figure 14: South America Sour Milk Drinks Market Volume Share (%), by Distribution Channel 2025 & 2033
- Figure 15: South America Sour Milk Drinks Market Revenue (billion), by Country 2025 & 2033
- Figure 16: South America Sour Milk Drinks Market Volume (Liters), by Country 2025 & 2033
- Figure 17: South America Sour Milk Drinks Market Revenue Share (%), by Country 2025 & 2033
- Figure 18: South America Sour Milk Drinks Market Volume Share (%), by Country 2025 & 2033
- Figure 19: Europe Sour Milk Drinks Market Revenue (billion), by Distribution Channel 2025 & 2033
- Figure 20: Europe Sour Milk Drinks Market Volume (Liters), by Distribution Channel 2025 & 2033
- Figure 21: Europe Sour Milk Drinks Market Revenue Share (%), by Distribution Channel 2025 & 2033
- Figure 22: Europe Sour Milk Drinks Market Volume Share (%), by Distribution Channel 2025 & 2033
- Figure 23: Europe Sour Milk Drinks Market Revenue (billion), by Country 2025 & 2033
- Figure 24: Europe Sour Milk Drinks Market Volume (Liters), by Country 2025 & 2033
- Figure 25: Europe Sour Milk Drinks Market Revenue Share (%), by Country 2025 & 2033
- Figure 26: Europe Sour Milk Drinks Market Volume Share (%), by Country 2025 & 2033
- Figure 27: Middle East & Africa Sour Milk Drinks Market Revenue (billion), by Distribution Channel 2025 & 2033
- Figure 28: Middle East & Africa Sour Milk Drinks Market Volume (Liters), by Distribution Channel 2025 & 2033
- Figure 29: Middle East & Africa Sour Milk Drinks Market Revenue Share (%), by Distribution Channel 2025 & 2033
- Figure 30: Middle East & Africa Sour Milk Drinks Market Volume Share (%), by Distribution Channel 2025 & 2033
- Figure 31: Middle East & Africa Sour Milk Drinks Market Revenue (billion), by Country 2025 & 2033
- Figure 32: Middle East & Africa Sour Milk Drinks Market Volume (Liters), by Country 2025 & 2033
- Figure 33: Middle East & Africa Sour Milk Drinks Market Revenue Share (%), by Country 2025 & 2033
- Figure 34: Middle East & Africa Sour Milk Drinks Market Volume Share (%), by Country 2025 & 2033
- Figure 35: Asia Pacific Sour Milk Drinks Market Revenue (billion), by Distribution Channel 2025 & 2033
- Figure 36: Asia Pacific Sour Milk Drinks Market Volume (Liters), by Distribution Channel 2025 & 2033
- Figure 37: Asia Pacific Sour Milk Drinks Market Revenue Share (%), by Distribution Channel 2025 & 2033
- Figure 38: Asia Pacific Sour Milk Drinks Market Volume Share (%), by Distribution Channel 2025 & 2033
- Figure 39: Asia Pacific Sour Milk Drinks Market Revenue (billion), by Country 2025 & 2033
- Figure 40: Asia Pacific Sour Milk Drinks Market Volume (Liters), by Country 2025 & 2033
- Figure 41: Asia Pacific Sour Milk Drinks Market Revenue Share (%), by Country 2025 & 2033
- Figure 42: Asia Pacific Sour Milk Drinks Market Volume Share (%), by Country 2025 & 2033
List of Tables
- Table 1: Global Sour Milk Drinks Market Revenue billion Forecast, by Distribution Channel 2020 & 2033
- Table 2: Global Sour Milk Drinks Market Volume Liters Forecast, by Distribution Channel 2020 & 2033
- Table 3: Global Sour Milk Drinks Market Revenue billion Forecast, by Region 2020 & 2033
- Table 4: Global Sour Milk Drinks Market Volume Liters Forecast, by Region 2020 & 2033
- Table 5: Global Sour Milk Drinks Market Revenue billion Forecast, by Distribution Channel 2020 & 2033
- Table 6: Global Sour Milk Drinks Market Volume Liters Forecast, by Distribution Channel 2020 & 2033
- Table 7: Global Sour Milk Drinks Market Revenue billion Forecast, by Country 2020 & 2033
- Table 8: Global Sour Milk Drinks Market Volume Liters Forecast, by Country 2020 & 2033
- Table 9: United States Sour Milk Drinks Market Revenue (billion) Forecast, by Application 2020 & 2033
- Table 10: United States Sour Milk Drinks Market Volume (Liters) Forecast, by Application 2020 & 2033
- Table 11: Canada Sour Milk Drinks Market Revenue (billion) Forecast, by Application 2020 & 2033
- Table 12: Canada Sour Milk Drinks Market Volume (Liters) Forecast, by Application 2020 & 2033
- Table 13: Mexico Sour Milk Drinks Market Revenue (billion) Forecast, by Application 2020 & 2033
- Table 14: Mexico Sour Milk Drinks Market Volume (Liters) Forecast, by Application 2020 & 2033
- Table 15: Global Sour Milk Drinks Market Revenue billion Forecast, by Distribution Channel 2020 & 2033
- Table 16: Global Sour Milk Drinks Market Volume Liters Forecast, by Distribution Channel 2020 & 2033
- Table 17: Global Sour Milk Drinks Market Revenue billion Forecast, by Country 2020 & 2033
- Table 18: Global Sour Milk Drinks Market Volume Liters Forecast, by Country 2020 & 2033
- Table 19: Brazil Sour Milk Drinks Market Revenue (billion) Forecast, by Application 2020 & 2033
- Table 20: Brazil Sour Milk Drinks Market Volume (Liters) Forecast, by Application 2020 & 2033
- Table 21: Argentina Sour Milk Drinks Market Revenue (billion) Forecast, by Application 2020 & 2033
- Table 22: Argentina Sour Milk Drinks Market Volume (Liters) Forecast, by Application 2020 & 2033
- Table 23: Rest of South America Sour Milk Drinks Market Revenue (billion) Forecast, by Application 2020 & 2033
- Table 24: Rest of South America Sour Milk Drinks Market Volume (Liters) Forecast, by Application 2020 & 2033
- Table 25: Global Sour Milk Drinks Market Revenue billion Forecast, by Distribution Channel 2020 & 2033
- Table 26: Global Sour Milk Drinks Market Volume Liters Forecast, by Distribution Channel 2020 & 2033
- Table 27: Global Sour Milk Drinks Market Revenue billion Forecast, by Country 2020 & 2033
- Table 28: Global Sour Milk Drinks Market Volume Liters Forecast, by Country 2020 & 2033
- Table 29: United Kingdom Sour Milk Drinks Market Revenue (billion) Forecast, by Application 2020 & 2033
- Table 30: United Kingdom Sour Milk Drinks Market Volume (Liters) Forecast, by Application 2020 & 2033
- Table 31: Germany Sour Milk Drinks Market Revenue (billion) Forecast, by Application 2020 & 2033
- Table 32: Germany Sour Milk Drinks Market Volume (Liters) Forecast, by Application 2020 & 2033
- Table 33: France Sour Milk Drinks Market Revenue (billion) Forecast, by Application 2020 & 2033
- Table 34: France Sour Milk Drinks Market Volume (Liters) Forecast, by Application 2020 & 2033
- Table 35: Italy Sour Milk Drinks Market Revenue (billion) Forecast, by Application 2020 & 2033
- Table 36: Italy Sour Milk Drinks Market Volume (Liters) Forecast, by Application 2020 & 2033
- Table 37: Spain Sour Milk Drinks Market Revenue (billion) Forecast, by Application 2020 & 2033
- Table 38: Spain Sour Milk Drinks Market Volume (Liters) Forecast, by Application 2020 & 2033
- Table 39: Russia Sour Milk Drinks Market Revenue (billion) Forecast, by Application 2020 & 2033
- Table 40: Russia Sour Milk Drinks Market Volume (Liters) Forecast, by Application 2020 & 2033
- Table 41: Benelux Sour Milk Drinks Market Revenue (billion) Forecast, by Application 2020 & 2033
- Table 42: Benelux Sour Milk Drinks Market Volume (Liters) Forecast, by Application 2020 & 2033
- Table 43: Nordics Sour Milk Drinks Market Revenue (billion) Forecast, by Application 2020 & 2033
- Table 44: Nordics Sour Milk Drinks Market Volume (Liters) Forecast, by Application 2020 & 2033
- Table 45: Rest of Europe Sour Milk Drinks Market Revenue (billion) Forecast, by Application 2020 & 2033
- Table 46: Rest of Europe Sour Milk Drinks Market Volume (Liters) Forecast, by Application 2020 & 2033
- Table 47: Global Sour Milk Drinks Market Revenue billion Forecast, by Distribution Channel 2020 & 2033
- Table 48: Global Sour Milk Drinks Market Volume Liters Forecast, by Distribution Channel 2020 & 2033
- Table 49: Global Sour Milk Drinks Market Revenue billion Forecast, by Country 2020 & 2033
- Table 50: Global Sour Milk Drinks Market Volume Liters Forecast, by Country 2020 & 2033
- Table 51: Turkey Sour Milk Drinks Market Revenue (billion) Forecast, by Application 2020 & 2033
- Table 52: Turkey Sour Milk Drinks Market Volume (Liters) Forecast, by Application 2020 & 2033
- Table 53: Israel Sour Milk Drinks Market Revenue (billion) Forecast, by Application 2020 & 2033
- Table 54: Israel Sour Milk Drinks Market Volume (Liters) Forecast, by Application 2020 & 2033
- Table 55: GCC Sour Milk Drinks Market Revenue (billion) Forecast, by Application 2020 & 2033
- Table 56: GCC Sour Milk Drinks Market Volume (Liters) Forecast, by Application 2020 & 2033
- Table 57: North Africa Sour Milk Drinks Market Revenue (billion) Forecast, by Application 2020 & 2033
- Table 58: North Africa Sour Milk Drinks Market Volume (Liters) Forecast, by Application 2020 & 2033
- Table 59: South Africa Sour Milk Drinks Market Revenue (billion) Forecast, by Application 2020 & 2033
- Table 60: South Africa Sour Milk Drinks Market Volume (Liters) Forecast, by Application 2020 & 2033
- Table 61: Rest of Middle East & Africa Sour Milk Drinks Market Revenue (billion) Forecast, by Application 2020 & 2033
- Table 62: Rest of Middle East & Africa Sour Milk Drinks Market Volume (Liters) Forecast, by Application 2020 & 2033
- Table 63: Global Sour Milk Drinks Market Revenue billion Forecast, by Distribution Channel 2020 & 2033
- Table 64: Global Sour Milk Drinks Market Volume Liters Forecast, by Distribution Channel 2020 & 2033
- Table 65: Global Sour Milk Drinks Market Revenue billion Forecast, by Country 2020 & 2033
- Table 66: Global Sour Milk Drinks Market Volume Liters Forecast, by Country 2020 & 2033
- Table 67: China Sour Milk Drinks Market Revenue (billion) Forecast, by Application 2020 & 2033
- Table 68: China Sour Milk Drinks Market Volume (Liters) Forecast, by Application 2020 & 2033
- Table 69: India Sour Milk Drinks Market Revenue (billion) Forecast, by Application 2020 & 2033
- Table 70: India Sour Milk Drinks Market Volume (Liters) Forecast, by Application 2020 & 2033
- Table 71: Japan Sour Milk Drinks Market Revenue (billion) Forecast, by Application 2020 & 2033
- Table 72: Japan Sour Milk Drinks Market Volume (Liters) Forecast, by Application 2020 & 2033
- Table 73: South Korea Sour Milk Drinks Market Revenue (billion) Forecast, by Application 2020 & 2033
- Table 74: South Korea Sour Milk Drinks Market Volume (Liters) Forecast, by Application 2020 & 2033
- Table 75: ASEAN Sour Milk Drinks Market Revenue (billion) Forecast, by Application 2020 & 2033
- Table 76: ASEAN Sour Milk Drinks Market Volume (Liters) Forecast, by Application 2020 & 2033
- Table 77: Oceania Sour Milk Drinks Market Revenue (billion) Forecast, by Application 2020 & 2033
- Table 78: Oceania Sour Milk Drinks Market Volume (Liters) Forecast, by Application 2020 & 2033
- Table 79: Rest of Asia Pacific Sour Milk Drinks Market Revenue (billion) Forecast, by Application 2020 & 2033
- Table 80: Rest of Asia Pacific Sour Milk Drinks Market Volume (Liters) Forecast, by Application 2020 & 2033
Frequently Asked Questions
1. What is the projected Compound Annual Growth Rate (CAGR) of the Sour Milk Drinks Market?
The projected CAGR is approximately 5.19%.
2. Which companies are prominent players in the Sour Milk Drinks Market?
Key companies in the market include Nestlé SA, Almarai Company, Green Valley Farms Market and Creamery, Hiland Dairy Foods Company LLC, Lifeway Foods Inc, Dairy Farmers of America Inc, Producers Dairy Foods Inc (Umpqua Dairy, Gujarat Co-operative Milk Marketing Federation Ltd.
3. What are the main segments of the Sour Milk Drinks Market?
The market segments include Distribution Channel.
4. Can you provide details about the market size?
The market size is estimated to be USD 9.03 billion as of 2022.
5. What are some drivers contributing to market growth?
Rising Demand for Clean Label Food & Beverage Products; Rising Demand for Dairy Products.
6. What are the notable trends driving market growth?
OTHER KEY INDUSTRY TRENDS COVERED IN THE REPORT.
7. Are there any restraints impacting market growth?
Presence of Preservatives in Ready Meals may Hamper the Market Growth.
8. Can you provide examples of recent developments in the market?
July 2022: Gujarat Co-operative Milk Marketing Federation Ltd. announced an investment of USD 60 Million for a new dairy plant in Rajkot to expand the milk, curd, and buttermilk products segment.August 2021: Lifeway Foods Inc., a manufacturer of kefir and fermented probiotic products, expanded its kefir distribution in the Irish market with a listing at Tesco.July 2021: Lifeway Foods Inc. expanded its distribution of kefir into the French market through the retailer Costco France.
9. What pricing options are available for accessing the report?
Pricing options include single-user, multi-user, and enterprise licenses priced at USD 3800, USD 4500, and USD 5800 respectively.
10. Is the market size provided in terms of value or volume?
The market size is provided in terms of value, measured in billion and volume, measured in Liters.
11. Are there any specific market keywords associated with the report?
Yes, the market keyword associated with the report is "Sour Milk Drinks Market," which aids in identifying and referencing the specific market segment covered.
12. How do I determine which pricing option suits my needs best?
The pricing options vary based on user requirements and access needs. Individual users may opt for single-user licenses, while businesses requiring broader access may choose multi-user or enterprise licenses for cost-effective access to the report.
13. Are there any additional resources or data provided in the Sour Milk Drinks Market report?
While the report offers comprehensive insights, it's advisable to review the specific contents or supplementary materials provided to ascertain if additional resources or data are available.
14. How can I stay updated on further developments or reports in the Sour Milk Drinks Market?
To stay informed about further developments, trends, and reports in the Sour Milk Drinks Market, consider subscribing to industry newsletters, following relevant companies and organizations, or regularly checking reputable industry news sources and publications.
Methodology
Step 1 - Identification of Relevant Samples Size from Population Database


Step 2 - Approaches for Defining Global Market Size (Value, Volume* & Price*)

Note*: In applicable scenarios
Step 3 - Data Sources
Primary Research
- Web Analytics
- Survey Reports
- Research Institute
- Latest Research Reports
- Opinion Leaders
Secondary Research
- Annual Reports
- White Paper
- Latest Press Release
- Industry Association
- Paid Database
- Investor Presentations

Step 4 - Data Triangulation
Involves using different sources of information in order to increase the validity of a study
These sources are likely to be stakeholders in a program - participants, other researchers, program staff, other community members, and so on.
Then we put all data in single framework & apply various statistical tools to find out the dynamic on the market.
During the analysis stage, feedback from the stakeholder groups would be compared to determine areas of agreement as well as areas of divergence