

Key Insights
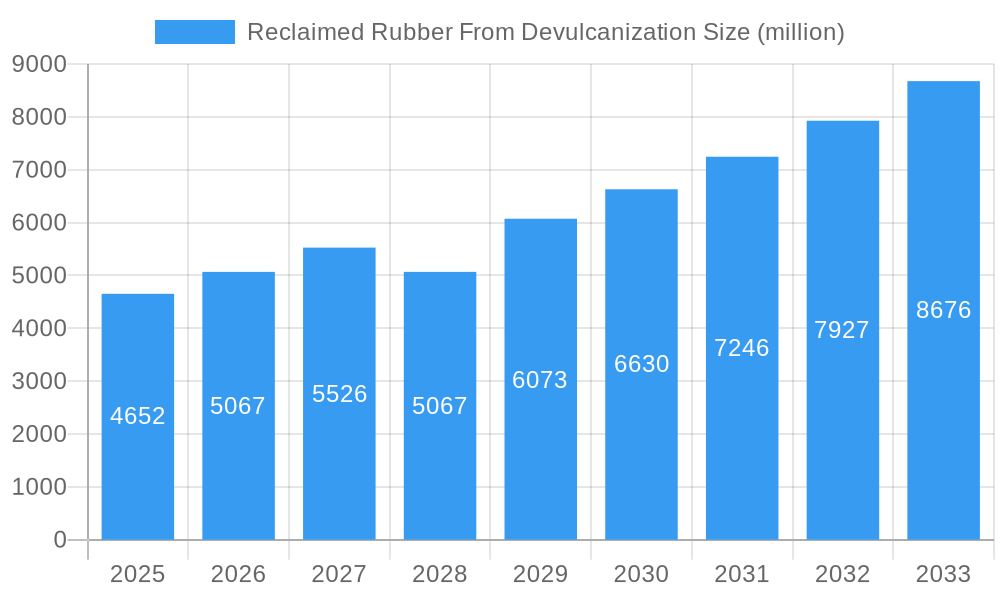
The reclaimed rubber from devulcanization market, currently valued at $4652 million in 2025, is projected to experience robust growth, driven by increasing environmental concerns and the rising demand for sustainable materials in various industries. The 8.9% CAGR from 2025 to 2033 signifies a significant expansion, fueled by the automotive, tire, and construction sectors' growing adoption of reclaimed rubber as a cost-effective and environmentally friendly alternative to virgin rubber. Key trends include advancements in devulcanization technologies leading to improved quality and performance of reclaimed rubber, coupled with stricter regulations regarding waste tire management and increasing government initiatives promoting circular economy principles. While challenges such as inconsistent quality of reclaimed rubber and the need for further technological advancements to optimize the devulcanization process exist, the market's inherent advantages in terms of cost savings and environmental benefits are expected to outweigh these limitations. The market segmentation reveals a strong presence across various applications, with tires and rubber products leading the demand, followed by construction and automobiles. Synthetic rubber currently holds a larger market share compared to natural rubber, although the latter is expected to witness growth due to its biodegradability and sustainability features. Geographically, North America and Asia Pacific are anticipated to be key growth regions, driven by strong industrial presence and supportive government policies.

Reclaimed Rubber From Devulcanization Market Size (In Billion)
The competitive landscape is characterized by a mix of established players and emerging companies, each focusing on specific segments and technologies. The presence of both large multinational corporations and smaller specialized firms indicates a dynamic market with opportunities for innovation and consolidation. Future growth will hinge on the development of more efficient and cost-effective devulcanization technologies, along with wider adoption across diverse sectors. Furthermore, collaborations between industry players and research institutions to improve the quality and consistency of reclaimed rubber will play a vital role in accelerating market expansion. The focus on creating a truly circular economy, where waste rubber is effectively recycled and reused, will be a major factor driving the growth of the reclaimed rubber from devulcanization market in the coming years.
Reclaimed Rubber From Devulcanization Company Market Share
Reclaimed Rubber From Devulcanization Market Report: 2019-2033
A Comprehensive Analysis of the $XX Million Market
This comprehensive report provides an in-depth analysis of the global reclaimed rubber from devulcanization market, offering invaluable insights for stakeholders across the value chain. With a study period spanning 2019-2033, a base year of 2025, and a forecast period of 2025-2033, this report leverages historical data (2019-2024) to project future market trends. Discover detailed segmentation by application (Tires, Rubber Products, Construction, Automobiles, Other) and type (Synthetic Rubber, Natural Rubber), along with key company profiles, including Rubberlink, Tyromer, Austin Rubber, Arduro Regen RBR, Polylema, Dolphin Rubber, Circular Rubber Technologies, Toyoda Gosei, and Rubber Conversion. This report is essential for businesses seeking to capitalize on the growing demand for sustainable and recycled rubber materials. The market is projected to reach $XX million by 2033, presenting significant opportunities for investment and growth.
Reclaimed Rubber From Devulcanization Market Dynamics & Concentration
The reclaimed rubber from devulcanization market exhibits a moderately concentrated landscape, with key players vying for market share. Innovation in devulcanization technologies, particularly those focused on improving the quality and consistency of reclaimed rubber, is a major growth driver. Stringent environmental regulations promoting sustainable material usage are further bolstering market expansion. Product substitutes, such as virgin rubber, face increasing pressure due to rising costs and environmental concerns. End-user trends towards eco-friendly materials are creating significant demand. M&A activity in the sector is expected to remain steady, with a projected xx number of deals between 2025 and 2033, consolidating market share and driving innovation. Major players like Rubberlink hold approximately xx% market share, showcasing the existing concentration.
Reclaimed Rubber From Devulcanization Industry Trends & Analysis
The global reclaimed rubber from devulcanization market is experiencing robust growth, with a projected CAGR of xx% during the forecast period (2025-2033). This growth is fueled by several factors, including the increasing demand for sustainable materials in various end-use sectors, particularly the automotive and construction industries. Technological advancements in devulcanization processes are leading to higher-quality reclaimed rubber with improved performance characteristics, expanding its application possibilities. Consumer preference for environmentally friendly products and increased awareness of the environmental impact of waste tire disposal further contribute to the market's expansion. The competitive landscape is dynamic, with companies focusing on strategic partnerships, product innovation, and geographic expansion to gain market share. Market penetration in emerging economies is expected to increase significantly, driven by infrastructure development and industrial growth.
Leading Markets & Segments in Reclaimed Rubber From Devulcanization
The tire segment dominates the reclaimed rubber from devulcanization market, accounting for approximately xx% of global demand in 2025. This is driven by the increasing volume of end-of-life tires and the cost-effectiveness of using reclaimed rubber in tire manufacturing. The automotive industry is the largest end-user, followed by the construction sector. Geographically, [Dominant Region, e.g., North America] is the leading market, driven by stringent environmental regulations, a robust automotive industry, and well-established recycling infrastructure.
Key Drivers:
- Stringent environmental regulations aimed at reducing waste tire disposal.
- Growing demand for sustainable and eco-friendly materials.
- Significant infrastructure development projects in emerging economies.
- Cost-effectiveness of reclaimed rubber compared to virgin rubber.
Reclaimed Rubber From Devulcanization Product Developments
Recent product innovations have focused on enhancing the properties of reclaimed rubber, including improvements in tensile strength, durability, and resistance to aging. New devulcanization technologies are enabling the production of reclaimed rubber with properties comparable to virgin rubber, opening up new application opportunities. This aligns with market trends toward high-performance, sustainable materials. The focus on improving the quality and consistency of reclaimed rubber is crucial for expanding its use beyond traditional applications.
Key Drivers of Reclaimed Rubber From Devulcanization Growth
Several factors are driving the growth of the reclaimed rubber from devulcanization market. Firstly, increasing environmental concerns and regulations are pushing for sustainable waste management solutions, making reclaimed rubber an attractive alternative to virgin materials. Secondly, the economic benefits of using reclaimed rubber, including lower costs compared to virgin rubber, are a major incentive. Finally, advancements in devulcanization technologies are continuously improving the quality and performance of reclaimed rubber, expanding its applications in various industries.
Challenges in the Reclaimed Rubber From Devulcanization Market
The market faces challenges, including inconsistent quality of reclaimed rubber from different sources, impacting its reliability and applications. Supply chain complexities and geographical variations in waste tire collection pose logistic hurdles. The competitive landscape with established players and the need for continuous investment in advanced devulcanization technology pose further challenges. These factors can influence the overall cost and availability, potentially impacting market growth by xx% in the short term.
Emerging Opportunities in Reclaimed Rubber From Devulcanization
Significant opportunities exist for growth through technological advancements in devulcanization techniques, leading to higher-quality, more versatile reclaimed rubber. Strategic partnerships between waste management companies, tire manufacturers, and reclaimed rubber processors will improve supply chains and promote efficient resource utilization. Expanding into new applications, such as in construction materials and engineered products, will further enhance market expansion and sustainability initiatives.
Leading Players in the Reclaimed Rubber From Devulcanization Sector
- Rubberlink
- Tyromer
- Austin Rubber
- Arduro Regen RBR
- Polylema
- Dolphin Rubber
- Circular Rubber Technologies
- Toyoda Gosei
- Rubber Conversion
Key Milestones in Reclaimed Rubber From Devulcanization Industry
- 2020: Introduction of a new devulcanization technology by [Company Name], significantly improving reclaimed rubber quality.
- 2022: [Company A] and [Company B] announce a strategic partnership to enhance reclaimed rubber supply chains.
- 2023: Launch of a new high-performance reclaimed rubber product by [Company Name] for use in automotive applications.
Strategic Outlook for Reclaimed Rubber From Devulcanization Market
The reclaimed rubber from devulcanization market presents significant long-term growth potential, driven by increasing environmental awareness, technological advancements, and cost advantages. Strategic investments in research and development, along with expansion into new applications and markets, will be crucial for success. Companies focusing on sustainability and innovation will be best positioned to capitalize on the growing demand for this eco-friendly material.
Reclaimed Rubber From Devulcanization Segmentation
-
1. Application
- 1.1. Tires
- 1.2. Rubber Products
- 1.3. Construction
- 1.4. Automobiles
- 1.5. Other
-
2. Type
- 2.1. Synthetic Rubber
- 2.2. Natural Rubber
Reclaimed Rubber From Devulcanization Segmentation By Geography
-
1. North America
- 1.1. United States
- 1.2. Canada
- 1.3. Mexico
-
2. South America
- 2.1. Brazil
- 2.2. Argentina
- 2.3. Rest of South America
-
3. Europe
- 3.1. United Kingdom
- 3.2. Germany
- 3.3. France
- 3.4. Italy
- 3.5. Spain
- 3.6. Russia
- 3.7. Benelux
- 3.8. Nordics
- 3.9. Rest of Europe
-
4. Middle East & Africa
- 4.1. Turkey
- 4.2. Israel
- 4.3. GCC
- 4.4. North Africa
- 4.5. South Africa
- 4.6. Rest of Middle East & Africa
-
5. Asia Pacific
- 5.1. China
- 5.2. India
- 5.3. Japan
- 5.4. South Korea
- 5.5. ASEAN
- 5.6. Oceania
- 5.7. Rest of Asia Pacific

Reclaimed Rubber From Devulcanization Regional Market Share
Geographic Coverage of Reclaimed Rubber From Devulcanization
Reclaimed Rubber From Devulcanization REPORT HIGHLIGHTS
| Aspects | Details |
|---|---|
| Study Period | 2020-2034 |
| Base Year | 2025 |
| Estimated Year | 2026 |
| Forecast Period | 2026-2034 |
| Historical Period | 2020-2025 |
| Growth Rate | CAGR of 8.9% from 2020-2034 |
| Segmentation |
|
Table of Contents
- 1. Introduction
- 1.1. Research Scope
- 1.2. Market Segmentation
- 1.3. Research Methodology
- 1.4. Definitions and Assumptions
- 2. Executive Summary
- 2.1. Introduction
- 3. Market Dynamics
- 3.1. Introduction
- 3.2. Market Drivers
- 3.3. Market Restrains
- 3.4. Market Trends
- 4. Market Factor Analysis
- 4.1. Porters Five Forces
- 4.2. Supply/Value Chain
- 4.3. PESTEL analysis
- 4.4. Market Entropy
- 4.5. Patent/Trademark Analysis
- 5. Global Reclaimed Rubber From Devulcanization Analysis, Insights and Forecast, 2020-2032
- 5.1. Market Analysis, Insights and Forecast - by Application
- 5.1.1. Tires
- 5.1.2. Rubber Products
- 5.1.3. Construction
- 5.1.4. Automobiles
- 5.1.5. Other
- 5.2. Market Analysis, Insights and Forecast - by Type
- 5.2.1. Synthetic Rubber
- 5.2.2. Natural Rubber
- 5.3. Market Analysis, Insights and Forecast - by Region
- 5.3.1. North America
- 5.3.2. South America
- 5.3.3. Europe
- 5.3.4. Middle East & Africa
- 5.3.5. Asia Pacific
- 5.1. Market Analysis, Insights and Forecast - by Application
- 6. North America Reclaimed Rubber From Devulcanization Analysis, Insights and Forecast, 2020-2032
- 6.1. Market Analysis, Insights and Forecast - by Application
- 6.1.1. Tires
- 6.1.2. Rubber Products
- 6.1.3. Construction
- 6.1.4. Automobiles
- 6.1.5. Other
- 6.2. Market Analysis, Insights and Forecast - by Type
- 6.2.1. Synthetic Rubber
- 6.2.2. Natural Rubber
- 6.1. Market Analysis, Insights and Forecast - by Application
- 7. South America Reclaimed Rubber From Devulcanization Analysis, Insights and Forecast, 2020-2032
- 7.1. Market Analysis, Insights and Forecast - by Application
- 7.1.1. Tires
- 7.1.2. Rubber Products
- 7.1.3. Construction
- 7.1.4. Automobiles
- 7.1.5. Other
- 7.2. Market Analysis, Insights and Forecast - by Type
- 7.2.1. Synthetic Rubber
- 7.2.2. Natural Rubber
- 7.1. Market Analysis, Insights and Forecast - by Application
- 8. Europe Reclaimed Rubber From Devulcanization Analysis, Insights and Forecast, 2020-2032
- 8.1. Market Analysis, Insights and Forecast - by Application
- 8.1.1. Tires
- 8.1.2. Rubber Products
- 8.1.3. Construction
- 8.1.4. Automobiles
- 8.1.5. Other
- 8.2. Market Analysis, Insights and Forecast - by Type
- 8.2.1. Synthetic Rubber
- 8.2.2. Natural Rubber
- 8.1. Market Analysis, Insights and Forecast - by Application
- 9. Middle East & Africa Reclaimed Rubber From Devulcanization Analysis, Insights and Forecast, 2020-2032
- 9.1. Market Analysis, Insights and Forecast - by Application
- 9.1.1. Tires
- 9.1.2. Rubber Products
- 9.1.3. Construction
- 9.1.4. Automobiles
- 9.1.5. Other
- 9.2. Market Analysis, Insights and Forecast - by Type
- 9.2.1. Synthetic Rubber
- 9.2.2. Natural Rubber
- 9.1. Market Analysis, Insights and Forecast - by Application
- 10. Asia Pacific Reclaimed Rubber From Devulcanization Analysis, Insights and Forecast, 2020-2032
- 10.1. Market Analysis, Insights and Forecast - by Application
- 10.1.1. Tires
- 10.1.2. Rubber Products
- 10.1.3. Construction
- 10.1.4. Automobiles
- 10.1.5. Other
- 10.2. Market Analysis, Insights and Forecast - by Type
- 10.2.1. Synthetic Rubber
- 10.2.2. Natural Rubber
- 10.1. Market Analysis, Insights and Forecast - by Application
- 11. Competitive Analysis
- 11.1. Global Market Share Analysis 2025
- 11.2. Company Profiles
- 11.2.1 Rubberlink
- 11.2.1.1. Overview
- 11.2.1.2. Products
- 11.2.1.3. SWOT Analysis
- 11.2.1.4. Recent Developments
- 11.2.1.5. Financials (Based on Availability)
- 11.2.2 Tyromer
- 11.2.2.1. Overview
- 11.2.2.2. Products
- 11.2.2.3. SWOT Analysis
- 11.2.2.4. Recent Developments
- 11.2.2.5. Financials (Based on Availability)
- 11.2.3 Austin Rubber
- 11.2.3.1. Overview
- 11.2.3.2. Products
- 11.2.3.3. SWOT Analysis
- 11.2.3.4. Recent Developments
- 11.2.3.5. Financials (Based on Availability)
- 11.2.4 Arduro Regen RBR
- 11.2.4.1. Overview
- 11.2.4.2. Products
- 11.2.4.3. SWOT Analysis
- 11.2.4.4. Recent Developments
- 11.2.4.5. Financials (Based on Availability)
- 11.2.5 Polylema
- 11.2.5.1. Overview
- 11.2.5.2. Products
- 11.2.5.3. SWOT Analysis
- 11.2.5.4. Recent Developments
- 11.2.5.5. Financials (Based on Availability)
- 11.2.6 Dolphin Rubber
- 11.2.6.1. Overview
- 11.2.6.2. Products
- 11.2.6.3. SWOT Analysis
- 11.2.6.4. Recent Developments
- 11.2.6.5. Financials (Based on Availability)
- 11.2.7 Circular Rubber Technologies
- 11.2.7.1. Overview
- 11.2.7.2. Products
- 11.2.7.3. SWOT Analysis
- 11.2.7.4. Recent Developments
- 11.2.7.5. Financials (Based on Availability)
- 11.2.8 Toyoda Gosei
- 11.2.8.1. Overview
- 11.2.8.2. Products
- 11.2.8.3. SWOT Analysis
- 11.2.8.4. Recent Developments
- 11.2.8.5. Financials (Based on Availability)
- 11.2.9 Rubber Conversion
- 11.2.9.1. Overview
- 11.2.9.2. Products
- 11.2.9.3. SWOT Analysis
- 11.2.9.4. Recent Developments
- 11.2.9.5. Financials (Based on Availability)
- 11.2.1 Rubberlink
List of Figures
- Figure 1: Global Reclaimed Rubber From Devulcanization Revenue Breakdown (million, %) by Region 2025 & 2033
- Figure 2: Global Reclaimed Rubber From Devulcanization Volume Breakdown (K, %) by Region 2025 & 2033
- Figure 3: North America Reclaimed Rubber From Devulcanization Revenue (million), by Application 2025 & 2033
- Figure 4: North America Reclaimed Rubber From Devulcanization Volume (K), by Application 2025 & 2033
- Figure 5: North America Reclaimed Rubber From Devulcanization Revenue Share (%), by Application 2025 & 2033
- Figure 6: North America Reclaimed Rubber From Devulcanization Volume Share (%), by Application 2025 & 2033
- Figure 7: North America Reclaimed Rubber From Devulcanization Revenue (million), by Type 2025 & 2033
- Figure 8: North America Reclaimed Rubber From Devulcanization Volume (K), by Type 2025 & 2033
- Figure 9: North America Reclaimed Rubber From Devulcanization Revenue Share (%), by Type 2025 & 2033
- Figure 10: North America Reclaimed Rubber From Devulcanization Volume Share (%), by Type 2025 & 2033
- Figure 11: North America Reclaimed Rubber From Devulcanization Revenue (million), by Country 2025 & 2033
- Figure 12: North America Reclaimed Rubber From Devulcanization Volume (K), by Country 2025 & 2033
- Figure 13: North America Reclaimed Rubber From Devulcanization Revenue Share (%), by Country 2025 & 2033
- Figure 14: North America Reclaimed Rubber From Devulcanization Volume Share (%), by Country 2025 & 2033
- Figure 15: South America Reclaimed Rubber From Devulcanization Revenue (million), by Application 2025 & 2033
- Figure 16: South America Reclaimed Rubber From Devulcanization Volume (K), by Application 2025 & 2033
- Figure 17: South America Reclaimed Rubber From Devulcanization Revenue Share (%), by Application 2025 & 2033
- Figure 18: South America Reclaimed Rubber From Devulcanization Volume Share (%), by Application 2025 & 2033
- Figure 19: South America Reclaimed Rubber From Devulcanization Revenue (million), by Type 2025 & 2033
- Figure 20: South America Reclaimed Rubber From Devulcanization Volume (K), by Type 2025 & 2033
- Figure 21: South America Reclaimed Rubber From Devulcanization Revenue Share (%), by Type 2025 & 2033
- Figure 22: South America Reclaimed Rubber From Devulcanization Volume Share (%), by Type 2025 & 2033
- Figure 23: South America Reclaimed Rubber From Devulcanization Revenue (million), by Country 2025 & 2033
- Figure 24: South America Reclaimed Rubber From Devulcanization Volume (K), by Country 2025 & 2033
- Figure 25: South America Reclaimed Rubber From Devulcanization Revenue Share (%), by Country 2025 & 2033
- Figure 26: South America Reclaimed Rubber From Devulcanization Volume Share (%), by Country 2025 & 2033
- Figure 27: Europe Reclaimed Rubber From Devulcanization Revenue (million), by Application 2025 & 2033
- Figure 28: Europe Reclaimed Rubber From Devulcanization Volume (K), by Application 2025 & 2033
- Figure 29: Europe Reclaimed Rubber From Devulcanization Revenue Share (%), by Application 2025 & 2033
- Figure 30: Europe Reclaimed Rubber From Devulcanization Volume Share (%), by Application 2025 & 2033
- Figure 31: Europe Reclaimed Rubber From Devulcanization Revenue (million), by Type 2025 & 2033
- Figure 32: Europe Reclaimed Rubber From Devulcanization Volume (K), by Type 2025 & 2033
- Figure 33: Europe Reclaimed Rubber From Devulcanization Revenue Share (%), by Type 2025 & 2033
- Figure 34: Europe Reclaimed Rubber From Devulcanization Volume Share (%), by Type 2025 & 2033
- Figure 35: Europe Reclaimed Rubber From Devulcanization Revenue (million), by Country 2025 & 2033
- Figure 36: Europe Reclaimed Rubber From Devulcanization Volume (K), by Country 2025 & 2033
- Figure 37: Europe Reclaimed Rubber From Devulcanization Revenue Share (%), by Country 2025 & 2033
- Figure 38: Europe Reclaimed Rubber From Devulcanization Volume Share (%), by Country 2025 & 2033
- Figure 39: Middle East & Africa Reclaimed Rubber From Devulcanization Revenue (million), by Application 2025 & 2033
- Figure 40: Middle East & Africa Reclaimed Rubber From Devulcanization Volume (K), by Application 2025 & 2033
- Figure 41: Middle East & Africa Reclaimed Rubber From Devulcanization Revenue Share (%), by Application 2025 & 2033
- Figure 42: Middle East & Africa Reclaimed Rubber From Devulcanization Volume Share (%), by Application 2025 & 2033
- Figure 43: Middle East & Africa Reclaimed Rubber From Devulcanization Revenue (million), by Type 2025 & 2033
- Figure 44: Middle East & Africa Reclaimed Rubber From Devulcanization Volume (K), by Type 2025 & 2033
- Figure 45: Middle East & Africa Reclaimed Rubber From Devulcanization Revenue Share (%), by Type 2025 & 2033
- Figure 46: Middle East & Africa Reclaimed Rubber From Devulcanization Volume Share (%), by Type 2025 & 2033
- Figure 47: Middle East & Africa Reclaimed Rubber From Devulcanization Revenue (million), by Country 2025 & 2033
- Figure 48: Middle East & Africa Reclaimed Rubber From Devulcanization Volume (K), by Country 2025 & 2033
- Figure 49: Middle East & Africa Reclaimed Rubber From Devulcanization Revenue Share (%), by Country 2025 & 2033
- Figure 50: Middle East & Africa Reclaimed Rubber From Devulcanization Volume Share (%), by Country 2025 & 2033
- Figure 51: Asia Pacific Reclaimed Rubber From Devulcanization Revenue (million), by Application 2025 & 2033
- Figure 52: Asia Pacific Reclaimed Rubber From Devulcanization Volume (K), by Application 2025 & 2033
- Figure 53: Asia Pacific Reclaimed Rubber From Devulcanization Revenue Share (%), by Application 2025 & 2033
- Figure 54: Asia Pacific Reclaimed Rubber From Devulcanization Volume Share (%), by Application 2025 & 2033
- Figure 55: Asia Pacific Reclaimed Rubber From Devulcanization Revenue (million), by Type 2025 & 2033
- Figure 56: Asia Pacific Reclaimed Rubber From Devulcanization Volume (K), by Type 2025 & 2033
- Figure 57: Asia Pacific Reclaimed Rubber From Devulcanization Revenue Share (%), by Type 2025 & 2033
- Figure 58: Asia Pacific Reclaimed Rubber From Devulcanization Volume Share (%), by Type 2025 & 2033
- Figure 59: Asia Pacific Reclaimed Rubber From Devulcanization Revenue (million), by Country 2025 & 2033
- Figure 60: Asia Pacific Reclaimed Rubber From Devulcanization Volume (K), by Country 2025 & 2033
- Figure 61: Asia Pacific Reclaimed Rubber From Devulcanization Revenue Share (%), by Country 2025 & 2033
- Figure 62: Asia Pacific Reclaimed Rubber From Devulcanization Volume Share (%), by Country 2025 & 2033
List of Tables
- Table 1: Global Reclaimed Rubber From Devulcanization Revenue million Forecast, by Application 2020 & 2033
- Table 2: Global Reclaimed Rubber From Devulcanization Volume K Forecast, by Application 2020 & 2033
- Table 3: Global Reclaimed Rubber From Devulcanization Revenue million Forecast, by Type 2020 & 2033
- Table 4: Global Reclaimed Rubber From Devulcanization Volume K Forecast, by Type 2020 & 2033
- Table 5: Global Reclaimed Rubber From Devulcanization Revenue million Forecast, by Region 2020 & 2033
- Table 6: Global Reclaimed Rubber From Devulcanization Volume K Forecast, by Region 2020 & 2033
- Table 7: Global Reclaimed Rubber From Devulcanization Revenue million Forecast, by Application 2020 & 2033
- Table 8: Global Reclaimed Rubber From Devulcanization Volume K Forecast, by Application 2020 & 2033
- Table 9: Global Reclaimed Rubber From Devulcanization Revenue million Forecast, by Type 2020 & 2033
- Table 10: Global Reclaimed Rubber From Devulcanization Volume K Forecast, by Type 2020 & 2033
- Table 11: Global Reclaimed Rubber From Devulcanization Revenue million Forecast, by Country 2020 & 2033
- Table 12: Global Reclaimed Rubber From Devulcanization Volume K Forecast, by Country 2020 & 2033
- Table 13: United States Reclaimed Rubber From Devulcanization Revenue (million) Forecast, by Application 2020 & 2033
- Table 14: United States Reclaimed Rubber From Devulcanization Volume (K) Forecast, by Application 2020 & 2033
- Table 15: Canada Reclaimed Rubber From Devulcanization Revenue (million) Forecast, by Application 2020 & 2033
- Table 16: Canada Reclaimed Rubber From Devulcanization Volume (K) Forecast, by Application 2020 & 2033
- Table 17: Mexico Reclaimed Rubber From Devulcanization Revenue (million) Forecast, by Application 2020 & 2033
- Table 18: Mexico Reclaimed Rubber From Devulcanization Volume (K) Forecast, by Application 2020 & 2033
- Table 19: Global Reclaimed Rubber From Devulcanization Revenue million Forecast, by Application 2020 & 2033
- Table 20: Global Reclaimed Rubber From Devulcanization Volume K Forecast, by Application 2020 & 2033
- Table 21: Global Reclaimed Rubber From Devulcanization Revenue million Forecast, by Type 2020 & 2033
- Table 22: Global Reclaimed Rubber From Devulcanization Volume K Forecast, by Type 2020 & 2033
- Table 23: Global Reclaimed Rubber From Devulcanization Revenue million Forecast, by Country 2020 & 2033
- Table 24: Global Reclaimed Rubber From Devulcanization Volume K Forecast, by Country 2020 & 2033
- Table 25: Brazil Reclaimed Rubber From Devulcanization Revenue (million) Forecast, by Application 2020 & 2033
- Table 26: Brazil Reclaimed Rubber From Devulcanization Volume (K) Forecast, by Application 2020 & 2033
- Table 27: Argentina Reclaimed Rubber From Devulcanization Revenue (million) Forecast, by Application 2020 & 2033
- Table 28: Argentina Reclaimed Rubber From Devulcanization Volume (K) Forecast, by Application 2020 & 2033
- Table 29: Rest of South America Reclaimed Rubber From Devulcanization Revenue (million) Forecast, by Application 2020 & 2033
- Table 30: Rest of South America Reclaimed Rubber From Devulcanization Volume (K) Forecast, by Application 2020 & 2033
- Table 31: Global Reclaimed Rubber From Devulcanization Revenue million Forecast, by Application 2020 & 2033
- Table 32: Global Reclaimed Rubber From Devulcanization Volume K Forecast, by Application 2020 & 2033
- Table 33: Global Reclaimed Rubber From Devulcanization Revenue million Forecast, by Type 2020 & 2033
- Table 34: Global Reclaimed Rubber From Devulcanization Volume K Forecast, by Type 2020 & 2033
- Table 35: Global Reclaimed Rubber From Devulcanization Revenue million Forecast, by Country 2020 & 2033
- Table 36: Global Reclaimed Rubber From Devulcanization Volume K Forecast, by Country 2020 & 2033
- Table 37: United Kingdom Reclaimed Rubber From Devulcanization Revenue (million) Forecast, by Application 2020 & 2033
- Table 38: United Kingdom Reclaimed Rubber From Devulcanization Volume (K) Forecast, by Application 2020 & 2033
- Table 39: Germany Reclaimed Rubber From Devulcanization Revenue (million) Forecast, by Application 2020 & 2033
- Table 40: Germany Reclaimed Rubber From Devulcanization Volume (K) Forecast, by Application 2020 & 2033
- Table 41: France Reclaimed Rubber From Devulcanization Revenue (million) Forecast, by Application 2020 & 2033
- Table 42: France Reclaimed Rubber From Devulcanization Volume (K) Forecast, by Application 2020 & 2033
- Table 43: Italy Reclaimed Rubber From Devulcanization Revenue (million) Forecast, by Application 2020 & 2033
- Table 44: Italy Reclaimed Rubber From Devulcanization Volume (K) Forecast, by Application 2020 & 2033
- Table 45: Spain Reclaimed Rubber From Devulcanization Revenue (million) Forecast, by Application 2020 & 2033
- Table 46: Spain Reclaimed Rubber From Devulcanization Volume (K) Forecast, by Application 2020 & 2033
- Table 47: Russia Reclaimed Rubber From Devulcanization Revenue (million) Forecast, by Application 2020 & 2033
- Table 48: Russia Reclaimed Rubber From Devulcanization Volume (K) Forecast, by Application 2020 & 2033
- Table 49: Benelux Reclaimed Rubber From Devulcanization Revenue (million) Forecast, by Application 2020 & 2033
- Table 50: Benelux Reclaimed Rubber From Devulcanization Volume (K) Forecast, by Application 2020 & 2033
- Table 51: Nordics Reclaimed Rubber From Devulcanization Revenue (million) Forecast, by Application 2020 & 2033
- Table 52: Nordics Reclaimed Rubber From Devulcanization Volume (K) Forecast, by Application 2020 & 2033
- Table 53: Rest of Europe Reclaimed Rubber From Devulcanization Revenue (million) Forecast, by Application 2020 & 2033
- Table 54: Rest of Europe Reclaimed Rubber From Devulcanization Volume (K) Forecast, by Application 2020 & 2033
- Table 55: Global Reclaimed Rubber From Devulcanization Revenue million Forecast, by Application 2020 & 2033
- Table 56: Global Reclaimed Rubber From Devulcanization Volume K Forecast, by Application 2020 & 2033
- Table 57: Global Reclaimed Rubber From Devulcanization Revenue million Forecast, by Type 2020 & 2033
- Table 58: Global Reclaimed Rubber From Devulcanization Volume K Forecast, by Type 2020 & 2033
- Table 59: Global Reclaimed Rubber From Devulcanization Revenue million Forecast, by Country 2020 & 2033
- Table 60: Global Reclaimed Rubber From Devulcanization Volume K Forecast, by Country 2020 & 2033
- Table 61: Turkey Reclaimed Rubber From Devulcanization Revenue (million) Forecast, by Application 2020 & 2033
- Table 62: Turkey Reclaimed Rubber From Devulcanization Volume (K) Forecast, by Application 2020 & 2033
- Table 63: Israel Reclaimed Rubber From Devulcanization Revenue (million) Forecast, by Application 2020 & 2033
- Table 64: Israel Reclaimed Rubber From Devulcanization Volume (K) Forecast, by Application 2020 & 2033
- Table 65: GCC Reclaimed Rubber From Devulcanization Revenue (million) Forecast, by Application 2020 & 2033
- Table 66: GCC Reclaimed Rubber From Devulcanization Volume (K) Forecast, by Application 2020 & 2033
- Table 67: North Africa Reclaimed Rubber From Devulcanization Revenue (million) Forecast, by Application 2020 & 2033
- Table 68: North Africa Reclaimed Rubber From Devulcanization Volume (K) Forecast, by Application 2020 & 2033
- Table 69: South Africa Reclaimed Rubber From Devulcanization Revenue (million) Forecast, by Application 2020 & 2033
- Table 70: South Africa Reclaimed Rubber From Devulcanization Volume (K) Forecast, by Application 2020 & 2033
- Table 71: Rest of Middle East & Africa Reclaimed Rubber From Devulcanization Revenue (million) Forecast, by Application 2020 & 2033
- Table 72: Rest of Middle East & Africa Reclaimed Rubber From Devulcanization Volume (K) Forecast, by Application 2020 & 2033
- Table 73: Global Reclaimed Rubber From Devulcanization Revenue million Forecast, by Application 2020 & 2033
- Table 74: Global Reclaimed Rubber From Devulcanization Volume K Forecast, by Application 2020 & 2033
- Table 75: Global Reclaimed Rubber From Devulcanization Revenue million Forecast, by Type 2020 & 2033
- Table 76: Global Reclaimed Rubber From Devulcanization Volume K Forecast, by Type 2020 & 2033
- Table 77: Global Reclaimed Rubber From Devulcanization Revenue million Forecast, by Country 2020 & 2033
- Table 78: Global Reclaimed Rubber From Devulcanization Volume K Forecast, by Country 2020 & 2033
- Table 79: China Reclaimed Rubber From Devulcanization Revenue (million) Forecast, by Application 2020 & 2033
- Table 80: China Reclaimed Rubber From Devulcanization Volume (K) Forecast, by Application 2020 & 2033
- Table 81: India Reclaimed Rubber From Devulcanization Revenue (million) Forecast, by Application 2020 & 2033
- Table 82: India Reclaimed Rubber From Devulcanization Volume (K) Forecast, by Application 2020 & 2033
- Table 83: Japan Reclaimed Rubber From Devulcanization Revenue (million) Forecast, by Application 2020 & 2033
- Table 84: Japan Reclaimed Rubber From Devulcanization Volume (K) Forecast, by Application 2020 & 2033
- Table 85: South Korea Reclaimed Rubber From Devulcanization Revenue (million) Forecast, by Application 2020 & 2033
- Table 86: South Korea Reclaimed Rubber From Devulcanization Volume (K) Forecast, by Application 2020 & 2033
- Table 87: ASEAN Reclaimed Rubber From Devulcanization Revenue (million) Forecast, by Application 2020 & 2033
- Table 88: ASEAN Reclaimed Rubber From Devulcanization Volume (K) Forecast, by Application 2020 & 2033
- Table 89: Oceania Reclaimed Rubber From Devulcanization Revenue (million) Forecast, by Application 2020 & 2033
- Table 90: Oceania Reclaimed Rubber From Devulcanization Volume (K) Forecast, by Application 2020 & 2033
- Table 91: Rest of Asia Pacific Reclaimed Rubber From Devulcanization Revenue (million) Forecast, by Application 2020 & 2033
- Table 92: Rest of Asia Pacific Reclaimed Rubber From Devulcanization Volume (K) Forecast, by Application 2020 & 2033
Frequently Asked Questions
1. What is the projected Compound Annual Growth Rate (CAGR) of the Reclaimed Rubber From Devulcanization?
The projected CAGR is approximately 8.9%.
2. Which companies are prominent players in the Reclaimed Rubber From Devulcanization?
Key companies in the market include Rubberlink, Tyromer, Austin Rubber, Arduro Regen RBR, Polylema, Dolphin Rubber, Circular Rubber Technologies, Toyoda Gosei, Rubber Conversion.
3. What are the main segments of the Reclaimed Rubber From Devulcanization?
The market segments include Application, Type.
4. Can you provide details about the market size?
The market size is estimated to be USD 4652 million as of 2022.
5. What are some drivers contributing to market growth?
N/A
6. What are the notable trends driving market growth?
N/A
7. Are there any restraints impacting market growth?
N/A
8. Can you provide examples of recent developments in the market?
N/A
9. What pricing options are available for accessing the report?
Pricing options include single-user, multi-user, and enterprise licenses priced at USD 3950.00, USD 5925.00, and USD 7900.00 respectively.
10. Is the market size provided in terms of value or volume?
The market size is provided in terms of value, measured in million and volume, measured in K.
11. Are there any specific market keywords associated with the report?
Yes, the market keyword associated with the report is "Reclaimed Rubber From Devulcanization," which aids in identifying and referencing the specific market segment covered.
12. How do I determine which pricing option suits my needs best?
The pricing options vary based on user requirements and access needs. Individual users may opt for single-user licenses, while businesses requiring broader access may choose multi-user or enterprise licenses for cost-effective access to the report.
13. Are there any additional resources or data provided in the Reclaimed Rubber From Devulcanization report?
While the report offers comprehensive insights, it's advisable to review the specific contents or supplementary materials provided to ascertain if additional resources or data are available.
14. How can I stay updated on further developments or reports in the Reclaimed Rubber From Devulcanization?
To stay informed about further developments, trends, and reports in the Reclaimed Rubber From Devulcanization, consider subscribing to industry newsletters, following relevant companies and organizations, or regularly checking reputable industry news sources and publications.
Methodology
Step 1 - Identification of Relevant Samples Size from Population Database


Step 2 - Approaches for Defining Global Market Size (Value, Volume* & Price*)

Note*: In applicable scenarios
Step 3 - Data Sources
Primary Research
- Web Analytics
- Survey Reports
- Research Institute
- Latest Research Reports
- Opinion Leaders
Secondary Research
- Annual Reports
- White Paper
- Latest Press Release
- Industry Association
- Paid Database
- Investor Presentations

Step 4 - Data Triangulation
Involves using different sources of information in order to increase the validity of a study
These sources are likely to be stakeholders in a program - participants, other researchers, program staff, other community members, and so on.
Then we put all data in single framework & apply various statistical tools to find out the dynamic on the market.
During the analysis stage, feedback from the stakeholder groups would be compared to determine areas of agreement as well as areas of divergence