

Key Insights
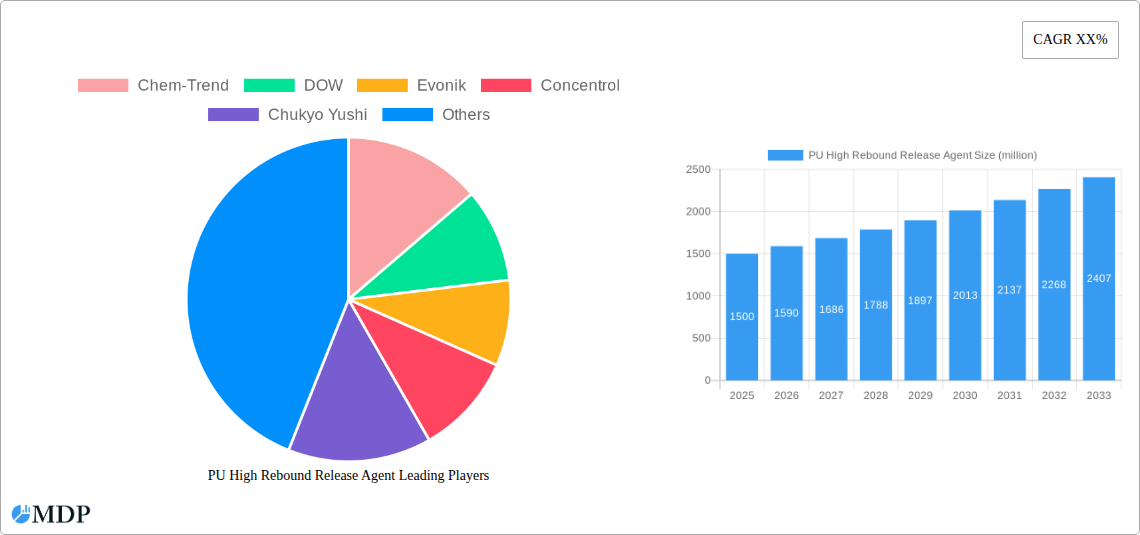
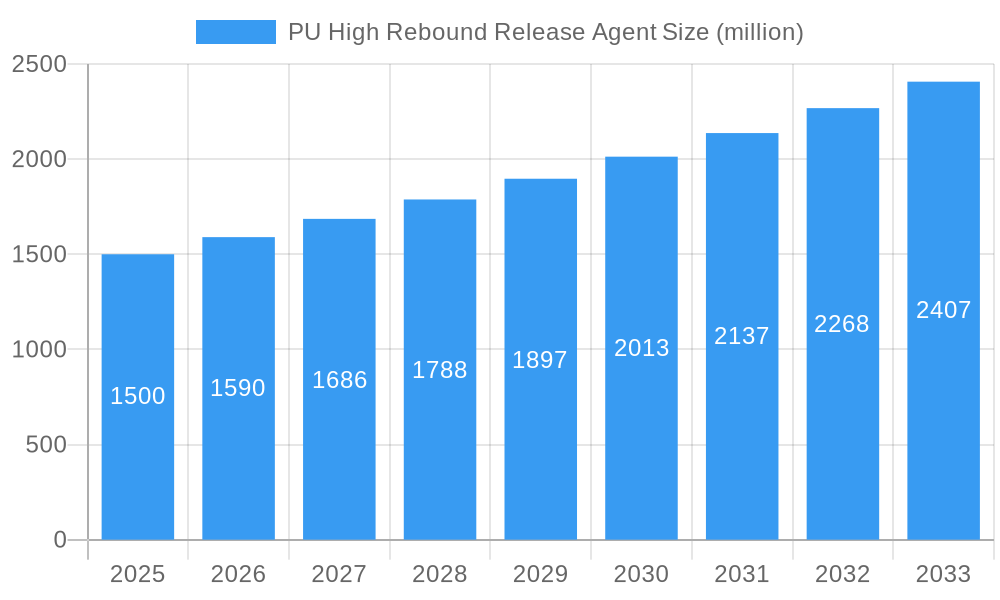
The global PU High Rebound Release Agent market is experiencing robust growth, driven by the expanding automotive, furniture, and footwear industries. The market's increasing demand stems from the superior properties of PU high rebound materials, including excellent elasticity, durability, and resilience. Water-based release agents are gaining traction due to stricter environmental regulations and growing awareness of sustainability concerns, although oil-based agents continue to hold a significant market share due to their established performance characteristics. The market is segmented by application (furniture, construction, automotive, footwear, packaging, and others) and type (water-based and oil-based), with the automotive segment currently leading in consumption. Major players, including Chem-Trend, DOW, and Evonik, are focusing on innovation and strategic partnerships to enhance their market presence and expand their product portfolios. Geographic expansion into rapidly developing economies in Asia-Pacific and South America presents significant growth opportunities. However, fluctuating raw material prices and potential supply chain disruptions pose challenges to market expansion. We estimate the market size in 2025 to be approximately $1.5 billion, with a projected CAGR of 6% from 2025 to 2033. This growth is fuelled by increasing production of high-performance polyurethane foams across diverse sectors.
PU High Rebound Release Agent Market Size (In Billion)
While the North American and European regions currently dominate the market, emerging economies are witnessing significant growth in demand for PU high-rebound release agents. This growth is driven by expanding manufacturing activities in these regions, increasing disposable incomes, and rising demand for durable and high-quality goods. Furthermore, advancements in release agent technology focusing on improved performance, reduced environmental impact, and enhanced process efficiency will further fuel market expansion. The competitive landscape is characterized by both established global players and regional manufacturers. Companies are actively engaging in mergers and acquisitions, as well as research and development initiatives, to maintain their competitive edge in the market. Future growth will be shaped by the adoption of advanced manufacturing techniques, increasing government regulations on VOC emissions, and fluctuating global economic conditions.
PU High Rebound Release Agent Company Market Share
Dive Deep into the Thriving PU High Rebound Release Agent Market: A Comprehensive Report (2019-2033)
This in-depth report provides a comprehensive analysis of the global PU High Rebound Release Agent market, offering invaluable insights for stakeholders across the value chain. With a study period spanning 2019-2033, a base year of 2025, and a forecast period of 2025-2033, this report meticulously examines market dynamics, trends, and future projections, empowering businesses to make informed strategic decisions. The market size is projected to reach xx million by 2033, presenting significant growth opportunities.
This report covers key aspects of the PU High Rebound Release Agent market, including market size, segmentation, leading players, and future growth prospects. The report leverages data from the historical period (2019-2024) and the estimated year (2025) to forecast market trends until 2033. Key segments covered include furniture, construction, automotive, footwear, and packaging applications, along with water-based and oil-based types.
PU High Rebound Release Agent Market Dynamics & Concentration
The global PU High Rebound Release Agent market exhibits a moderately concentrated landscape, with key players such as Chem-Trend, DOW, Evonik, and Concentrol holding significant market share. The market share of the top 5 players is estimated at xx%. Innovation in release agent formulations, driven by the demand for eco-friendly and high-performance products, is a major driver. Stringent environmental regulations regarding VOC emissions are shaping product development, pushing manufacturers towards water-based and bio-based alternatives. Product substitution, primarily from silicone-based release agents, presents a competitive challenge. However, PU High Rebound Release agents maintain an edge due to their superior release properties and cost-effectiveness in certain applications. End-user trends favor high-performance, easy-to-use release agents that minimize downtime and improve overall productivity. M&A activities in the industry have been moderate, with xx major deals recorded during the historical period, primarily focused on expanding product portfolios and geographical reach.
- Market Concentration: Top 5 players hold xx% market share (estimated).
- Innovation Drivers: Demand for eco-friendly and high-performance products.
- Regulatory Framework: Stringent environmental regulations on VOC emissions.
- Product Substitutes: Silicone-based release agents.
- End-User Trends: Preference for high-performance, easy-to-use products.
- M&A Activities: xx major deals during the historical period (2019-2024).
PU High Rebound Release Agent Industry Trends & Analysis
The PU High Rebound Release Agent market is experiencing robust growth, driven by the expanding automotive and construction sectors globally. The increasing demand for polyurethane foams in furniture, footwear, and packaging further fuels market expansion. Technological advancements, including the development of nanotechnology-enhanced release agents, are enhancing performance and efficiency. Consumer preferences are shifting towards sustainable and environmentally friendly options, prompting manufacturers to develop bio-based and low-VOC release agents. The competitive landscape is characterized by both price competition and differentiation based on performance and sustainability attributes. The market is projected to witness a Compound Annual Growth Rate (CAGR) of xx% during the forecast period (2025-2033), with significant market penetration expected in developing economies.
Leading Markets & Segments in PU High Rebound Release Agent
The automotive segment dominates the PU High Rebound Release Agent market, accounting for approximately xx million in 2025, driven by the surging demand for lightweight and fuel-efficient vehicles. Asia Pacific is the leading regional market due to rapid industrialization and automotive production in countries like China and India. Within the types segment, water-based release agents are gaining traction due to their environmental friendliness.
- Key Drivers in Automotive Segment: Growth in automotive production, increasing demand for lightweight vehicles.
- Key Drivers in Asia Pacific Region: Rapid industrialization, automotive production growth in China and India.
- Water-Based Release Agent Growth: Driven by environmental regulations and consumer preference for sustainable products.
- Dominance Analysis: The automotive segment's dominance stems from high volume consumption and stringent quality requirements.
PU High Rebound Release Agent Product Developments
Recent product innovations focus on improving release efficiency, reducing VOC emissions, and enhancing durability. Nanotechnology-enhanced release agents are gaining popularity for their superior performance. New applications are emerging in high-precision molding processes. These advancements provide significant competitive advantages, particularly in terms of reducing manufacturing costs and improving product quality.
Key Drivers of PU High Rebound Release Agent Growth
The PU High Rebound Release Agent market's growth is fueled by several factors, including the rising demand from the automotive and construction sectors. Technological advancements, specifically in nanotechnology and bio-based materials, lead to superior product performance. Favorable government policies supporting sustainable manufacturing practices further contribute to the market's expansion.
Challenges in the PU High Rebound Release Agent Market
The market faces challenges such as volatile raw material prices and stringent environmental regulations. Supply chain disruptions can impact production and pricing. Intense competition from alternative release agents also poses a threat. These factors can collectively constrain market growth by xx% in unfavorable scenarios.
Emerging Opportunities in PU High Rebound Release Agent
Emerging opportunities lie in the development of eco-friendly, high-performance release agents tailored to specific applications. Strategic partnerships and collaborations between manufacturers and end-users will drive innovation and market expansion. Exploring new applications in emerging industries offers significant growth potential.
Leading Players in the PU High Rebound Release Agent Sector
- Chem-Trend
- DOW
- Evonik
- Concentrol
- Chukyo Yushi
- ACMOS CHEMIE
- AKOCHEM
- Maverix Solutions
- McLube
- W. N. SHAW
- Miller-Stephenson Chemical Company
- TAG Chemicals
- AITANA CHEMICALS
- BKY Chemical Solutions
- Xiangyang JieChong Chemical New Material
- HUAGE
Key Milestones in PU High Rebound Release Agent Industry
- 2020: Introduction of a new bio-based release agent by Evonik.
- 2021: Chem-Trend acquires a smaller release agent manufacturer, expanding its market share.
- 2022: Several key players announce investments in R&D for sustainable release agent formulations.
- 2023: New regulations regarding VOC emissions are implemented in several regions.
Strategic Outlook for PU High Rebound Release Agent Market
The PU High Rebound Release Agent market is poised for sustained growth, driven by innovation, expanding applications, and increasing demand from key end-use sectors. Strategic partnerships, focusing on sustainability and product differentiation, will be key to success. Companies that invest in R&D and adapt to evolving environmental regulations will capture significant market share.
PU High Rebound Release Agent Segmentation
-
1. Application
- 1.1. Furniture
- 1.2. Construction
- 1.3. Automotive
- 1.4. Footwear
- 1.5. Packaging
- 1.6. Others
-
2. Types
- 2.1. Water Based
- 2.2. Oil Based
PU High Rebound Release Agent Segmentation By Geography
-
1. North America
- 1.1. United States
- 1.2. Canada
- 1.3. Mexico
-
2. South America
- 2.1. Brazil
- 2.2. Argentina
- 2.3. Rest of South America
-
3. Europe
- 3.1. United Kingdom
- 3.2. Germany
- 3.3. France
- 3.4. Italy
- 3.5. Spain
- 3.6. Russia
- 3.7. Benelux
- 3.8. Nordics
- 3.9. Rest of Europe
-
4. Middle East & Africa
- 4.1. Turkey
- 4.2. Israel
- 4.3. GCC
- 4.4. North Africa
- 4.5. South Africa
- 4.6. Rest of Middle East & Africa
-
5. Asia Pacific
- 5.1. China
- 5.2. India
- 5.3. Japan
- 5.4. South Korea
- 5.5. ASEAN
- 5.6. Oceania
- 5.7. Rest of Asia Pacific

PU High Rebound Release Agent Regional Market Share
Geographic Coverage of PU High Rebound Release Agent
PU High Rebound Release Agent REPORT HIGHLIGHTS
| Aspects | Details |
|---|---|
| Study Period | 2020-2034 |
| Base Year | 2025 |
| Estimated Year | 2026 |
| Forecast Period | 2026-2034 |
| Historical Period | 2020-2025 |
| Growth Rate | CAGR of 7.2% from 2020-2034 |
| Segmentation |
|
Table of Contents
- 1. Introduction
- 1.1. Research Scope
- 1.2. Market Segmentation
- 1.3. Research Methodology
- 1.4. Definitions and Assumptions
- 2. Executive Summary
- 2.1. Introduction
- 3. Market Dynamics
- 3.1. Introduction
- 3.2. Market Drivers
- 3.3. Market Restrains
- 3.4. Market Trends
- 4. Market Factor Analysis
- 4.1. Porters Five Forces
- 4.2. Supply/Value Chain
- 4.3. PESTEL analysis
- 4.4. Market Entropy
- 4.5. Patent/Trademark Analysis
- 5. Global PU High Rebound Release Agent Analysis, Insights and Forecast, 2020-2032
- 5.1. Market Analysis, Insights and Forecast - by Application
- 5.1.1. Furniture
- 5.1.2. Construction
- 5.1.3. Automotive
- 5.1.4. Footwear
- 5.1.5. Packaging
- 5.1.6. Others
- 5.2. Market Analysis, Insights and Forecast - by Types
- 5.2.1. Water Based
- 5.2.2. Oil Based
- 5.3. Market Analysis, Insights and Forecast - by Region
- 5.3.1. North America
- 5.3.2. South America
- 5.3.3. Europe
- 5.3.4. Middle East & Africa
- 5.3.5. Asia Pacific
- 5.1. Market Analysis, Insights and Forecast - by Application
- 6. North America PU High Rebound Release Agent Analysis, Insights and Forecast, 2020-2032
- 6.1. Market Analysis, Insights and Forecast - by Application
- 6.1.1. Furniture
- 6.1.2. Construction
- 6.1.3. Automotive
- 6.1.4. Footwear
- 6.1.5. Packaging
- 6.1.6. Others
- 6.2. Market Analysis, Insights and Forecast - by Types
- 6.2.1. Water Based
- 6.2.2. Oil Based
- 6.1. Market Analysis, Insights and Forecast - by Application
- 7. South America PU High Rebound Release Agent Analysis, Insights and Forecast, 2020-2032
- 7.1. Market Analysis, Insights and Forecast - by Application
- 7.1.1. Furniture
- 7.1.2. Construction
- 7.1.3. Automotive
- 7.1.4. Footwear
- 7.1.5. Packaging
- 7.1.6. Others
- 7.2. Market Analysis, Insights and Forecast - by Types
- 7.2.1. Water Based
- 7.2.2. Oil Based
- 7.1. Market Analysis, Insights and Forecast - by Application
- 8. Europe PU High Rebound Release Agent Analysis, Insights and Forecast, 2020-2032
- 8.1. Market Analysis, Insights and Forecast - by Application
- 8.1.1. Furniture
- 8.1.2. Construction
- 8.1.3. Automotive
- 8.1.4. Footwear
- 8.1.5. Packaging
- 8.1.6. Others
- 8.2. Market Analysis, Insights and Forecast - by Types
- 8.2.1. Water Based
- 8.2.2. Oil Based
- 8.1. Market Analysis, Insights and Forecast - by Application
- 9. Middle East & Africa PU High Rebound Release Agent Analysis, Insights and Forecast, 2020-2032
- 9.1. Market Analysis, Insights and Forecast - by Application
- 9.1.1. Furniture
- 9.1.2. Construction
- 9.1.3. Automotive
- 9.1.4. Footwear
- 9.1.5. Packaging
- 9.1.6. Others
- 9.2. Market Analysis, Insights and Forecast - by Types
- 9.2.1. Water Based
- 9.2.2. Oil Based
- 9.1. Market Analysis, Insights and Forecast - by Application
- 10. Asia Pacific PU High Rebound Release Agent Analysis, Insights and Forecast, 2020-2032
- 10.1. Market Analysis, Insights and Forecast - by Application
- 10.1.1. Furniture
- 10.1.2. Construction
- 10.1.3. Automotive
- 10.1.4. Footwear
- 10.1.5. Packaging
- 10.1.6. Others
- 10.2. Market Analysis, Insights and Forecast - by Types
- 10.2.1. Water Based
- 10.2.2. Oil Based
- 10.1. Market Analysis, Insights and Forecast - by Application
- 11. Competitive Analysis
- 11.1. Global Market Share Analysis 2025
- 11.2. Company Profiles
- 11.2.1 Chem-Trend
- 11.2.1.1. Overview
- 11.2.1.2. Products
- 11.2.1.3. SWOT Analysis
- 11.2.1.4. Recent Developments
- 11.2.1.5. Financials (Based on Availability)
- 11.2.2 DOW
- 11.2.2.1. Overview
- 11.2.2.2. Products
- 11.2.2.3. SWOT Analysis
- 11.2.2.4. Recent Developments
- 11.2.2.5. Financials (Based on Availability)
- 11.2.3 Evonik
- 11.2.3.1. Overview
- 11.2.3.2. Products
- 11.2.3.3. SWOT Analysis
- 11.2.3.4. Recent Developments
- 11.2.3.5. Financials (Based on Availability)
- 11.2.4 Concentrol
- 11.2.4.1. Overview
- 11.2.4.2. Products
- 11.2.4.3. SWOT Analysis
- 11.2.4.4. Recent Developments
- 11.2.4.5. Financials (Based on Availability)
- 11.2.5 Chukyo Yushi
- 11.2.5.1. Overview
- 11.2.5.2. Products
- 11.2.5.3. SWOT Analysis
- 11.2.5.4. Recent Developments
- 11.2.5.5. Financials (Based on Availability)
- 11.2.6 ACMOS CHEMIE
- 11.2.6.1. Overview
- 11.2.6.2. Products
- 11.2.6.3. SWOT Analysis
- 11.2.6.4. Recent Developments
- 11.2.6.5. Financials (Based on Availability)
- 11.2.7 AKOCHEM
- 11.2.7.1. Overview
- 11.2.7.2. Products
- 11.2.7.3. SWOT Analysis
- 11.2.7.4. Recent Developments
- 11.2.7.5. Financials (Based on Availability)
- 11.2.8 Maverix Solutions
- 11.2.8.1. Overview
- 11.2.8.2. Products
- 11.2.8.3. SWOT Analysis
- 11.2.8.4. Recent Developments
- 11.2.8.5. Financials (Based on Availability)
- 11.2.9 McLube
- 11.2.9.1. Overview
- 11.2.9.2. Products
- 11.2.9.3. SWOT Analysis
- 11.2.9.4. Recent Developments
- 11.2.9.5. Financials (Based on Availability)
- 11.2.10 W. N. SHAW
- 11.2.10.1. Overview
- 11.2.10.2. Products
- 11.2.10.3. SWOT Analysis
- 11.2.10.4. Recent Developments
- 11.2.10.5. Financials (Based on Availability)
- 11.2.11 Miller-Stephenson Chemical Company
- 11.2.11.1. Overview
- 11.2.11.2. Products
- 11.2.11.3. SWOT Analysis
- 11.2.11.4. Recent Developments
- 11.2.11.5. Financials (Based on Availability)
- 11.2.12 TAG Chemicals
- 11.2.12.1. Overview
- 11.2.12.2. Products
- 11.2.12.3. SWOT Analysis
- 11.2.12.4. Recent Developments
- 11.2.12.5. Financials (Based on Availability)
- 11.2.13 AITANA CHEMICALS
- 11.2.13.1. Overview
- 11.2.13.2. Products
- 11.2.13.3. SWOT Analysis
- 11.2.13.4. Recent Developments
- 11.2.13.5. Financials (Based on Availability)
- 11.2.14 BKY Chemical Solutions
- 11.2.14.1. Overview
- 11.2.14.2. Products
- 11.2.14.3. SWOT Analysis
- 11.2.14.4. Recent Developments
- 11.2.14.5. Financials (Based on Availability)
- 11.2.15 Xiangyang JieChong Chemical New Material
- 11.2.15.1. Overview
- 11.2.15.2. Products
- 11.2.15.3. SWOT Analysis
- 11.2.15.4. Recent Developments
- 11.2.15.5. Financials (Based on Availability)
- 11.2.16 HUAGE
- 11.2.16.1. Overview
- 11.2.16.2. Products
- 11.2.16.3. SWOT Analysis
- 11.2.16.4. Recent Developments
- 11.2.16.5. Financials (Based on Availability)
- 11.2.1 Chem-Trend
List of Figures
- Figure 1: Global PU High Rebound Release Agent Revenue Breakdown (undefined, %) by Region 2025 & 2033
- Figure 2: North America PU High Rebound Release Agent Revenue (undefined), by Application 2025 & 2033
- Figure 3: North America PU High Rebound Release Agent Revenue Share (%), by Application 2025 & 2033
- Figure 4: North America PU High Rebound Release Agent Revenue (undefined), by Types 2025 & 2033
- Figure 5: North America PU High Rebound Release Agent Revenue Share (%), by Types 2025 & 2033
- Figure 6: North America PU High Rebound Release Agent Revenue (undefined), by Country 2025 & 2033
- Figure 7: North America PU High Rebound Release Agent Revenue Share (%), by Country 2025 & 2033
- Figure 8: South America PU High Rebound Release Agent Revenue (undefined), by Application 2025 & 2033
- Figure 9: South America PU High Rebound Release Agent Revenue Share (%), by Application 2025 & 2033
- Figure 10: South America PU High Rebound Release Agent Revenue (undefined), by Types 2025 & 2033
- Figure 11: South America PU High Rebound Release Agent Revenue Share (%), by Types 2025 & 2033
- Figure 12: South America PU High Rebound Release Agent Revenue (undefined), by Country 2025 & 2033
- Figure 13: South America PU High Rebound Release Agent Revenue Share (%), by Country 2025 & 2033
- Figure 14: Europe PU High Rebound Release Agent Revenue (undefined), by Application 2025 & 2033
- Figure 15: Europe PU High Rebound Release Agent Revenue Share (%), by Application 2025 & 2033
- Figure 16: Europe PU High Rebound Release Agent Revenue (undefined), by Types 2025 & 2033
- Figure 17: Europe PU High Rebound Release Agent Revenue Share (%), by Types 2025 & 2033
- Figure 18: Europe PU High Rebound Release Agent Revenue (undefined), by Country 2025 & 2033
- Figure 19: Europe PU High Rebound Release Agent Revenue Share (%), by Country 2025 & 2033
- Figure 20: Middle East & Africa PU High Rebound Release Agent Revenue (undefined), by Application 2025 & 2033
- Figure 21: Middle East & Africa PU High Rebound Release Agent Revenue Share (%), by Application 2025 & 2033
- Figure 22: Middle East & Africa PU High Rebound Release Agent Revenue (undefined), by Types 2025 & 2033
- Figure 23: Middle East & Africa PU High Rebound Release Agent Revenue Share (%), by Types 2025 & 2033
- Figure 24: Middle East & Africa PU High Rebound Release Agent Revenue (undefined), by Country 2025 & 2033
- Figure 25: Middle East & Africa PU High Rebound Release Agent Revenue Share (%), by Country 2025 & 2033
- Figure 26: Asia Pacific PU High Rebound Release Agent Revenue (undefined), by Application 2025 & 2033
- Figure 27: Asia Pacific PU High Rebound Release Agent Revenue Share (%), by Application 2025 & 2033
- Figure 28: Asia Pacific PU High Rebound Release Agent Revenue (undefined), by Types 2025 & 2033
- Figure 29: Asia Pacific PU High Rebound Release Agent Revenue Share (%), by Types 2025 & 2033
- Figure 30: Asia Pacific PU High Rebound Release Agent Revenue (undefined), by Country 2025 & 2033
- Figure 31: Asia Pacific PU High Rebound Release Agent Revenue Share (%), by Country 2025 & 2033
List of Tables
- Table 1: Global PU High Rebound Release Agent Revenue undefined Forecast, by Application 2020 & 2033
- Table 2: Global PU High Rebound Release Agent Revenue undefined Forecast, by Types 2020 & 2033
- Table 3: Global PU High Rebound Release Agent Revenue undefined Forecast, by Region 2020 & 2033
- Table 4: Global PU High Rebound Release Agent Revenue undefined Forecast, by Application 2020 & 2033
- Table 5: Global PU High Rebound Release Agent Revenue undefined Forecast, by Types 2020 & 2033
- Table 6: Global PU High Rebound Release Agent Revenue undefined Forecast, by Country 2020 & 2033
- Table 7: United States PU High Rebound Release Agent Revenue (undefined) Forecast, by Application 2020 & 2033
- Table 8: Canada PU High Rebound Release Agent Revenue (undefined) Forecast, by Application 2020 & 2033
- Table 9: Mexico PU High Rebound Release Agent Revenue (undefined) Forecast, by Application 2020 & 2033
- Table 10: Global PU High Rebound Release Agent Revenue undefined Forecast, by Application 2020 & 2033
- Table 11: Global PU High Rebound Release Agent Revenue undefined Forecast, by Types 2020 & 2033
- Table 12: Global PU High Rebound Release Agent Revenue undefined Forecast, by Country 2020 & 2033
- Table 13: Brazil PU High Rebound Release Agent Revenue (undefined) Forecast, by Application 2020 & 2033
- Table 14: Argentina PU High Rebound Release Agent Revenue (undefined) Forecast, by Application 2020 & 2033
- Table 15: Rest of South America PU High Rebound Release Agent Revenue (undefined) Forecast, by Application 2020 & 2033
- Table 16: Global PU High Rebound Release Agent Revenue undefined Forecast, by Application 2020 & 2033
- Table 17: Global PU High Rebound Release Agent Revenue undefined Forecast, by Types 2020 & 2033
- Table 18: Global PU High Rebound Release Agent Revenue undefined Forecast, by Country 2020 & 2033
- Table 19: United Kingdom PU High Rebound Release Agent Revenue (undefined) Forecast, by Application 2020 & 2033
- Table 20: Germany PU High Rebound Release Agent Revenue (undefined) Forecast, by Application 2020 & 2033
- Table 21: France PU High Rebound Release Agent Revenue (undefined) Forecast, by Application 2020 & 2033
- Table 22: Italy PU High Rebound Release Agent Revenue (undefined) Forecast, by Application 2020 & 2033
- Table 23: Spain PU High Rebound Release Agent Revenue (undefined) Forecast, by Application 2020 & 2033
- Table 24: Russia PU High Rebound Release Agent Revenue (undefined) Forecast, by Application 2020 & 2033
- Table 25: Benelux PU High Rebound Release Agent Revenue (undefined) Forecast, by Application 2020 & 2033
- Table 26: Nordics PU High Rebound Release Agent Revenue (undefined) Forecast, by Application 2020 & 2033
- Table 27: Rest of Europe PU High Rebound Release Agent Revenue (undefined) Forecast, by Application 2020 & 2033
- Table 28: Global PU High Rebound Release Agent Revenue undefined Forecast, by Application 2020 & 2033
- Table 29: Global PU High Rebound Release Agent Revenue undefined Forecast, by Types 2020 & 2033
- Table 30: Global PU High Rebound Release Agent Revenue undefined Forecast, by Country 2020 & 2033
- Table 31: Turkey PU High Rebound Release Agent Revenue (undefined) Forecast, by Application 2020 & 2033
- Table 32: Israel PU High Rebound Release Agent Revenue (undefined) Forecast, by Application 2020 & 2033
- Table 33: GCC PU High Rebound Release Agent Revenue (undefined) Forecast, by Application 2020 & 2033
- Table 34: North Africa PU High Rebound Release Agent Revenue (undefined) Forecast, by Application 2020 & 2033
- Table 35: South Africa PU High Rebound Release Agent Revenue (undefined) Forecast, by Application 2020 & 2033
- Table 36: Rest of Middle East & Africa PU High Rebound Release Agent Revenue (undefined) Forecast, by Application 2020 & 2033
- Table 37: Global PU High Rebound Release Agent Revenue undefined Forecast, by Application 2020 & 2033
- Table 38: Global PU High Rebound Release Agent Revenue undefined Forecast, by Types 2020 & 2033
- Table 39: Global PU High Rebound Release Agent Revenue undefined Forecast, by Country 2020 & 2033
- Table 40: China PU High Rebound Release Agent Revenue (undefined) Forecast, by Application 2020 & 2033
- Table 41: India PU High Rebound Release Agent Revenue (undefined) Forecast, by Application 2020 & 2033
- Table 42: Japan PU High Rebound Release Agent Revenue (undefined) Forecast, by Application 2020 & 2033
- Table 43: South Korea PU High Rebound Release Agent Revenue (undefined) Forecast, by Application 2020 & 2033
- Table 44: ASEAN PU High Rebound Release Agent Revenue (undefined) Forecast, by Application 2020 & 2033
- Table 45: Oceania PU High Rebound Release Agent Revenue (undefined) Forecast, by Application 2020 & 2033
- Table 46: Rest of Asia Pacific PU High Rebound Release Agent Revenue (undefined) Forecast, by Application 2020 & 2033
Frequently Asked Questions
1. What is the projected Compound Annual Growth Rate (CAGR) of the PU High Rebound Release Agent?
The projected CAGR is approximately 7.2%.
2. Which companies are prominent players in the PU High Rebound Release Agent?
Key companies in the market include Chem-Trend, DOW, Evonik, Concentrol, Chukyo Yushi, ACMOS CHEMIE, AKOCHEM, Maverix Solutions, McLube, W. N. SHAW, Miller-Stephenson Chemical Company, TAG Chemicals, AITANA CHEMICALS, BKY Chemical Solutions, Xiangyang JieChong Chemical New Material, HUAGE.
3. What are the main segments of the PU High Rebound Release Agent?
The market segments include Application, Types.
4. Can you provide details about the market size?
The market size is estimated to be USD XXX N/A as of 2022.
5. What are some drivers contributing to market growth?
N/A
6. What are the notable trends driving market growth?
N/A
7. Are there any restraints impacting market growth?
N/A
8. Can you provide examples of recent developments in the market?
N/A
9. What pricing options are available for accessing the report?
Pricing options include single-user, multi-user, and enterprise licenses priced at USD 4900.00, USD 7350.00, and USD 9800.00 respectively.
10. Is the market size provided in terms of value or volume?
The market size is provided in terms of value, measured in N/A.
11. Are there any specific market keywords associated with the report?
Yes, the market keyword associated with the report is "PU High Rebound Release Agent," which aids in identifying and referencing the specific market segment covered.
12. How do I determine which pricing option suits my needs best?
The pricing options vary based on user requirements and access needs. Individual users may opt for single-user licenses, while businesses requiring broader access may choose multi-user or enterprise licenses for cost-effective access to the report.
13. Are there any additional resources or data provided in the PU High Rebound Release Agent report?
While the report offers comprehensive insights, it's advisable to review the specific contents or supplementary materials provided to ascertain if additional resources or data are available.
14. How can I stay updated on further developments or reports in the PU High Rebound Release Agent?
To stay informed about further developments, trends, and reports in the PU High Rebound Release Agent, consider subscribing to industry newsletters, following relevant companies and organizations, or regularly checking reputable industry news sources and publications.
Methodology
Step 1 - Identification of Relevant Samples Size from Population Database


Step 2 - Approaches for Defining Global Market Size (Value, Volume* & Price*)

Note*: In applicable scenarios
Step 3 - Data Sources
Primary Research
- Web Analytics
- Survey Reports
- Research Institute
- Latest Research Reports
- Opinion Leaders
Secondary Research
- Annual Reports
- White Paper
- Latest Press Release
- Industry Association
- Paid Database
- Investor Presentations

Step 4 - Data Triangulation
Involves using different sources of information in order to increase the validity of a study
These sources are likely to be stakeholders in a program - participants, other researchers, program staff, other community members, and so on.
Then we put all data in single framework & apply various statistical tools to find out the dynamic on the market.
During the analysis stage, feedback from the stakeholder groups would be compared to determine areas of agreement as well as areas of divergence