

Key Insights
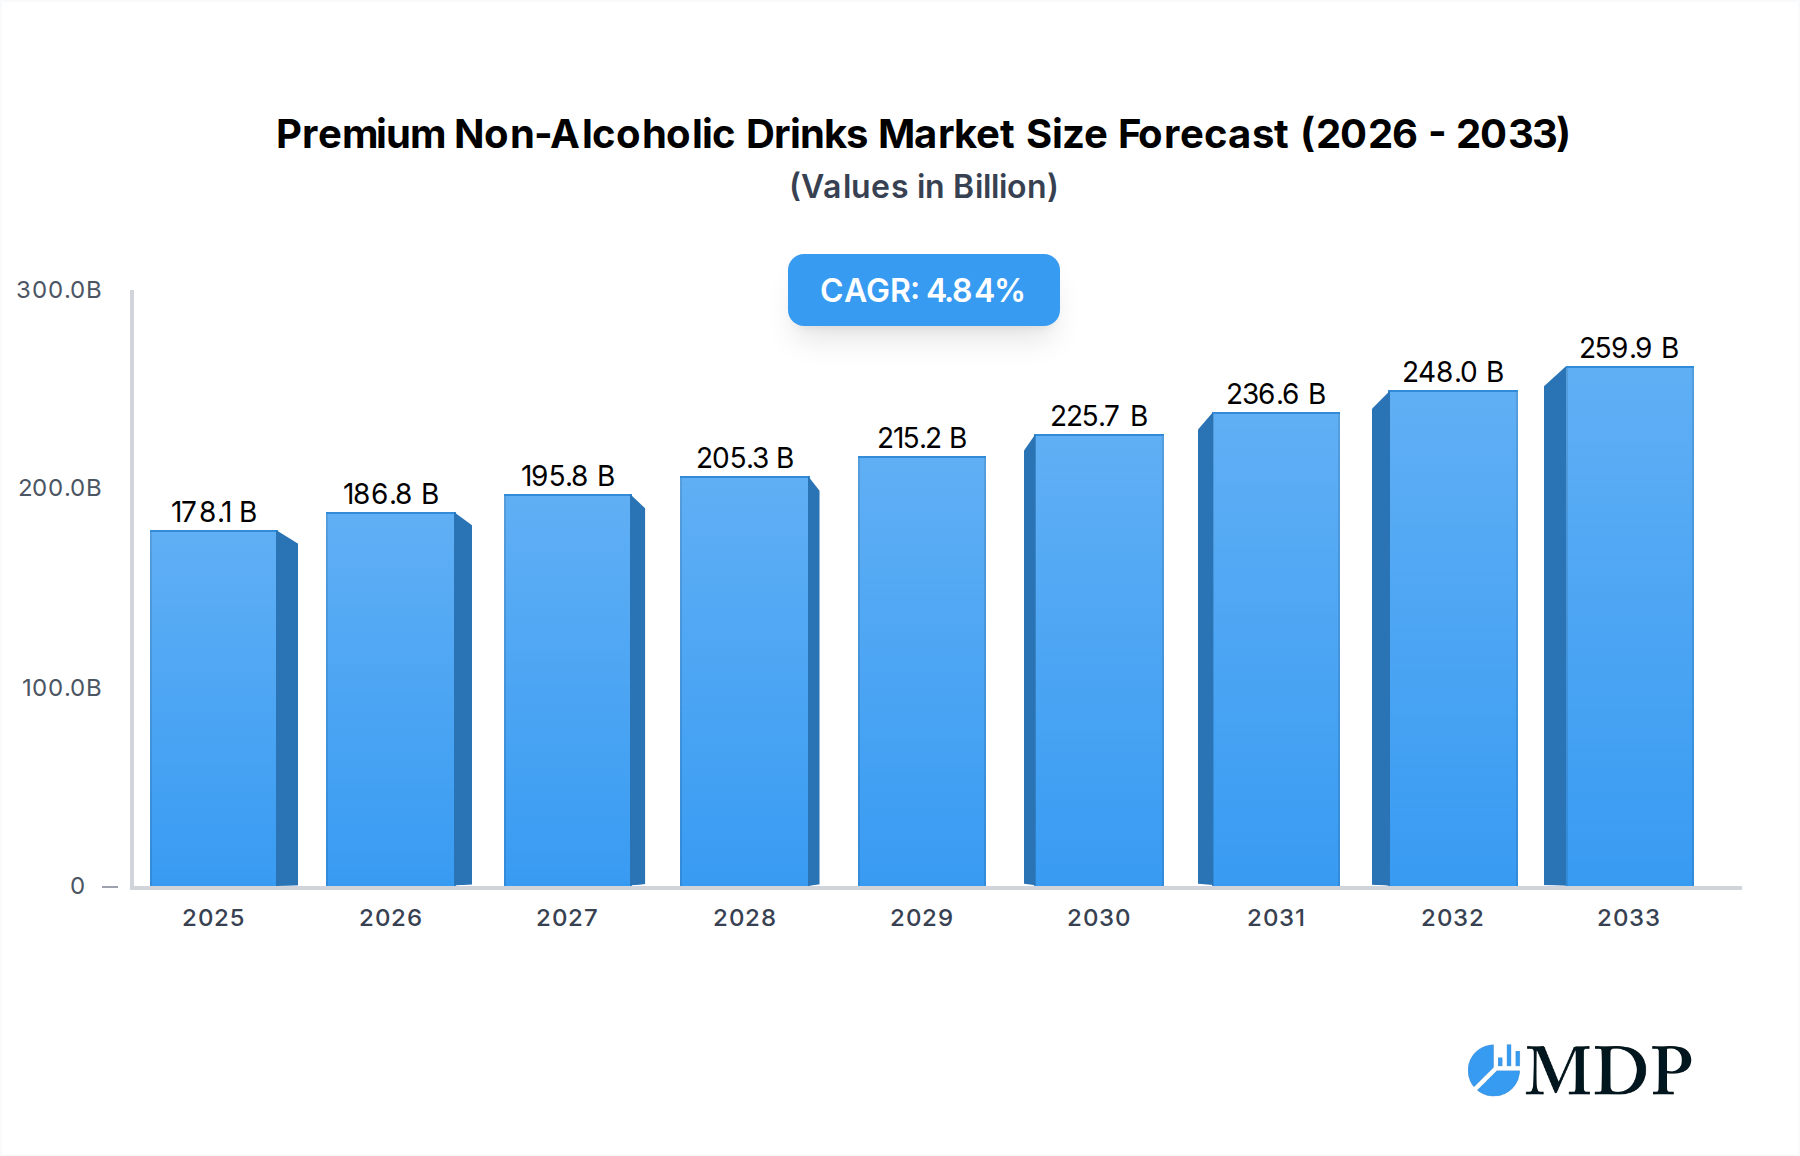
The Premium Non-Alcoholic Drinks market is poised for significant expansion, projected to reach USD 178.1 billion in 2025. This growth is underpinned by a robust Compound Annual Growth Rate (CAGR) of 4.78% from 2019 to 2033, indicating a sustained upward trajectory driven by evolving consumer preferences and lifestyle shifts. The market is characterized by a dynamic interplay of factors, with increasing disposable incomes and a growing health and wellness consciousness acting as primary catalysts. Consumers are increasingly seeking sophisticated beverage options that offer superior taste, natural ingredients, and functional benefits, moving away from traditional mass-market offerings. This trend is particularly evident in urban centers and among younger demographics who prioritize experiences and quality over price. The premiumization of everyday consumption is a key phenomenon, with beverages now seen as an extension of personal brand and lifestyle choices.

Premium Non-Alcoholic Drinks Market Size (In Billion)
The market is segmented into Online and Offline applications, reflecting diverse purchasing behaviors, and further categorized by types including Soft Drinks, Tea & Coffee, Juice, and Others. The "Others" segment, likely encompassing functional beverages, artisanal sodas, and specialty waters, is expected to witness considerable innovation and growth. Key drivers include the rising demand for low-sugar and no-sugar alternatives, the appeal of plant-based ingredients, and the influence of social media trends highlighting unique and aesthetically pleasing beverages. However, challenges such as volatile raw material prices and intense competition from established and emerging players require strategic maneuvering. Nonetheless, with a projected continued demand for healthier, more indulgent, and ethically sourced options, the Premium Non-Alcoholic Drinks market presents substantial opportunities for stakeholders to innovate and capture market share across all regions.
Premium Non-Alcoholic Drinks Company Market Share
Premium Non-Alcoholic Drinks Market Report: Strategic Insights & Growth Projections (2019-2033)
Unlock billion-dollar opportunities in the rapidly expanding premium non-alcoholic drinks market. This comprehensive report offers an in-depth analysis of market dynamics, trends, and growth drivers from 2019 to 2033, with a base year of 2025. Dive into actionable insights and strategic recommendations for industry stakeholders seeking to capitalize on surging consumer demand for sophisticated and healthy beverage options.
Premium Non-Alcoholic Drinks Market Dynamics & Concentration
The premium non-alcoholic drinks market, projected to reach billions in value, exhibits a moderate to high concentration, with key players like The Coca-Cola Company, PepsiCo, and Nestle holding substantial market shares. Innovation is a critical driver, fueled by evolving consumer preferences for healthier, functional, and artisanal beverages. Regulatory frameworks, particularly concerning sugar content and ingredient transparency, are shaping product development and marketing strategies. Product substitutes, ranging from traditional juices to enhanced water beverages, present a dynamic competitive landscape. End-user trends point towards a growing demand for plant-based options, low-sugar formulations, and beverages offering specific health benefits (e.g., gut health, energy). Mergers and acquisitions (M&A) activities are prevalent, with approximately billion worth of deals observed over the historical period, indicating consolidation and strategic expansion. Companies like Dr. Pepper Snapple Group, Asahi, and Suntory Beverage & Food are actively involved in acquiring innovative brands to broaden their portfolios.
- Market Share Dominance: Top 5 players command an estimated XX% of the market.
- M&A Deal Count (Historical): Approximately XX significant M&A transactions.
- Innovation Investment: Companies are allocating billions annually towards R&D for premium non-alcoholic beverages.
Premium Non-Alcoholic Drinks Industry Trends & Analysis
The premium non-alcoholic drinks industry is experiencing robust growth, driven by a confluence of factors including increasing disposable incomes globally, a rising health consciousness among consumers, and a significant shift towards sophisticated and functional beverage choices. The market is projected to witness a Compound Annual Growth Rate (CAGR) of XX% during the forecast period (2025–2033), reaching an estimated market size of billions. Technological disruptions are playing a pivotal role, with advancements in ingredient sourcing, processing, and packaging enabling the creation of novel and appealing products. This includes the development of sophisticated flavor profiles, the incorporation of natural sweeteners, and the utilization of innovative functional ingredients such as adaptogens, probiotics, and plant-based proteins.
Consumer preferences are leaning towards beverages that offer more than just hydration; they are seeking products that contribute to well-being, provide energy boosts, or offer a premium sensory experience. This has led to a surge in demand for artisanal teas and coffees, cold-pressed juices with unique ingredient combinations, and premium soft drinks with natural flavors and reduced sugar content. Market penetration of premium non-alcoholic options is steadily increasing across all demographics, as consumers are willing to pay a premium for perceived quality, health benefits, and ethical sourcing. The competitive dynamics are intensifying, with established beverage giants, innovative startups, and niche artisanal producers vying for market share. This competitive environment fosters continuous product innovation and drives the exploration of new market segments and consumer needs. The rise of e-commerce and direct-to-consumer (DTC) channels further amplifies market reach and allows for more personalized consumer engagement. The global market size for premium non-alcoholic drinks is estimated to be billions in the base year of 2025, with projections indicating a substantial increase by 2033.
Leading Markets & Segments in Premium Non-Alcoholic Drinks
The premium non-alcoholic drinks market exhibits a pronounced dominance in Offline applications, accounting for an estimated XX% of the total market value in the base year of 2025. This segment's strength is underpinned by extensive distribution networks in traditional retail channels, including supermarkets, convenience stores, and specialty beverage outlets, which cater to a broad consumer base seeking immediate purchase options. Economic policies favoring consumer spending and robust retail infrastructure are key drivers of this dominance.
Within the Types segmentation, Soft Drinks currently lead, capturing approximately XX% of the market share. This leadership is driven by established brand recognition, continuous innovation in flavors and functionalities, and their widespread appeal across various age groups. Companies like The Coca-Cola Company and PepsiCo have successfully leveraged their extensive portfolios to maintain a strong presence in the premium soft drinks category. However, the Juice and Tea & Coffee segments are experiencing rapid growth, with projected CAGRs of XX% and XX% respectively, indicating a significant shift in consumer preferences towards healthier and more specialized beverage options. The burgeoning demand for functional beverages and artisanal creations is fueling this upward trajectory.
The Asia-Pacific region is anticipated to emerge as the leading market, driven by a rapidly growing middle class, increasing disposable incomes, and a rising awareness of health and wellness trends. Countries like China and India are expected to be significant contributors to this growth. Strategic partnerships and increased investments in local production and distribution networks by global players will further bolster the market's expansion in this region.
- Dominant Application: Offline channels continue to lead due to widespread accessibility and consumer habits.
- Leading Type Segment: Premium Soft Drinks maintain the largest share, but Juice and Tea & Coffee are exhibiting accelerated growth.
- Key Regional Growth Driver: Asia-Pacific, fueled by demographic and economic factors.
Premium Non-Alcoholic Drinks Product Developments
Product innovation in premium non-alcoholic drinks is rapidly advancing, with a focus on healthier formulations and unique ingredient combinations. Companies are introducing low-sugar and sugar-free options, incorporating natural sweeteners like stevia and monk fruit, and developing beverages fortified with vitamins, minerals, and adaptogens for enhanced health benefits. The rise of plant-based beverages, including oat milk-based drinks and functional fruit smoothies, is a significant trend. Technological advancements in flavor encapsulation and extraction are enabling the creation of more authentic and complex taste profiles. Competitive advantages are being gained through sustainable sourcing practices, artisanal production methods, and appealing packaging that communicates premium quality and wellness attributes.
Key Drivers of Premium Non-Alcoholic Drinks Growth
The premium non-alcoholic drinks market is propelled by several key drivers. Technological advancements in product formulation and ingredient sourcing are enabling the creation of healthier, more functional, and appealing beverages. Economic growth and rising disposable incomes in emerging markets are increasing consumer spending power, leading to a greater willingness to purchase premium products. Evolving consumer preferences for health and wellness, coupled with a desire for sophisticated taste experiences, are significantly boosting demand. Regulatory shifts towards healthier beverage options, such as reduced sugar mandates, are indirectly benefiting the premium segment by encouraging innovation in low-sugar formulations.
Challenges in the Premium Non-Alcoholic Drinks Market
Despite its robust growth, the premium non-alcoholic drinks market faces several challenges. Intensifying competition from both established brands and emerging players necessitates continuous innovation and effective marketing strategies. Supply chain complexities and the sourcing of high-quality, often exotic, ingredients can lead to increased costs and potential disruptions. Stringent regulatory frameworks in certain regions concerning labeling, health claims, and ingredient restrictions can pose hurdles to product development and market entry. The price sensitivity of some consumer segments, even within the premium category, can limit market penetration, especially during economic downturns, impacting an estimated XX% of potential sales.
Emerging Opportunities in Premium Non-Alcoholic Drinks
Emerging opportunities in the premium non-alcoholic drinks market are abundant, driven by continuous innovation and evolving consumer demands. Technological breakthroughs in fermentation and plant-based ingredient development are opening doors for novel product categories. Strategic partnerships between beverage manufacturers and wellness influencers or health food retailers can expand market reach and credibility. Furthermore, market expansion strategies targeting underserved demographics and geographical regions, particularly those with a burgeoning middle class and increasing health consciousness, present significant long-term growth potential, projected to add billions to the global market.
Leading Players in the Premium Non-Alcoholic Drinks Sector
- The Coca-Cola Company
- PepsiCo
- Nestle
- Dr. Pepper Snapple Group
- Suntory Beverage & Food
- Asahi
- Unilever
- Danone
- Kraft Foods
- Jacobs Douwe Egberts
- A.G. Barr
- Dydo Drinco
- Kirin Holdings
- Attitude Drinks
- Calcol
- Suja Life
- Pressed Juicery
- Livewire Energy
- FreshBev
Key Milestones in Premium Non-Alcoholic Drinks Industry
- 2019: Increased consumer focus on functional beverages with launches of adaptogen-infused drinks.
- 2020: Significant rise in e-commerce sales for premium non-alcoholic beverages amid global lockdowns.
- 2021: Growing demand for plant-based milk alternatives and innovative juice blends.
- 2022: Expansion of low-sugar and zero-sugar options across major brands.
- 2023: Acquisitions of innovative craft beverage brands by larger corporations to diversify portfolios.
- 2024 (Estimated): Introduction of personalized nutrition beverages with advanced ingredient traceability.
Strategic Outlook for Premium Non-Alcoholic Drinks Market
The strategic outlook for the premium non-alcoholic drinks market remains highly optimistic, driven by persistent consumer demand for healthier and more sophisticated beverage choices. Growth accelerators will include continued innovation in functional ingredients, sustainable sourcing practices, and the expansion of direct-to-consumer (DTC) channels. Strategic opportunities lie in targeting evolving consumer lifestyles, such as the demand for performance-enhancing beverages and mindful indulgence options, collectively representing a billion-dollar future market potential.
Premium Non-Alcoholic Drinks Segmentation
-
1. Application
- 1.1. Online
- 1.2. Offline
-
2. Types
- 2.1. Soft Drinks
- 2.2. Tea & Coffee
- 2.3. Juice
- 2.4. Others
Premium Non-Alcoholic Drinks Segmentation By Geography
-
1. North America
- 1.1. United States
- 1.2. Canada
- 1.3. Mexico
-
2. South America
- 2.1. Brazil
- 2.2. Argentina
- 2.3. Rest of South America
-
3. Europe
- 3.1. United Kingdom
- 3.2. Germany
- 3.3. France
- 3.4. Italy
- 3.5. Spain
- 3.6. Russia
- 3.7. Benelux
- 3.8. Nordics
- 3.9. Rest of Europe
-
4. Middle East & Africa
- 4.1. Turkey
- 4.2. Israel
- 4.3. GCC
- 4.4. North Africa
- 4.5. South Africa
- 4.6. Rest of Middle East & Africa
-
5. Asia Pacific
- 5.1. China
- 5.2. India
- 5.3. Japan
- 5.4. South Korea
- 5.5. ASEAN
- 5.6. Oceania
- 5.7. Rest of Asia Pacific
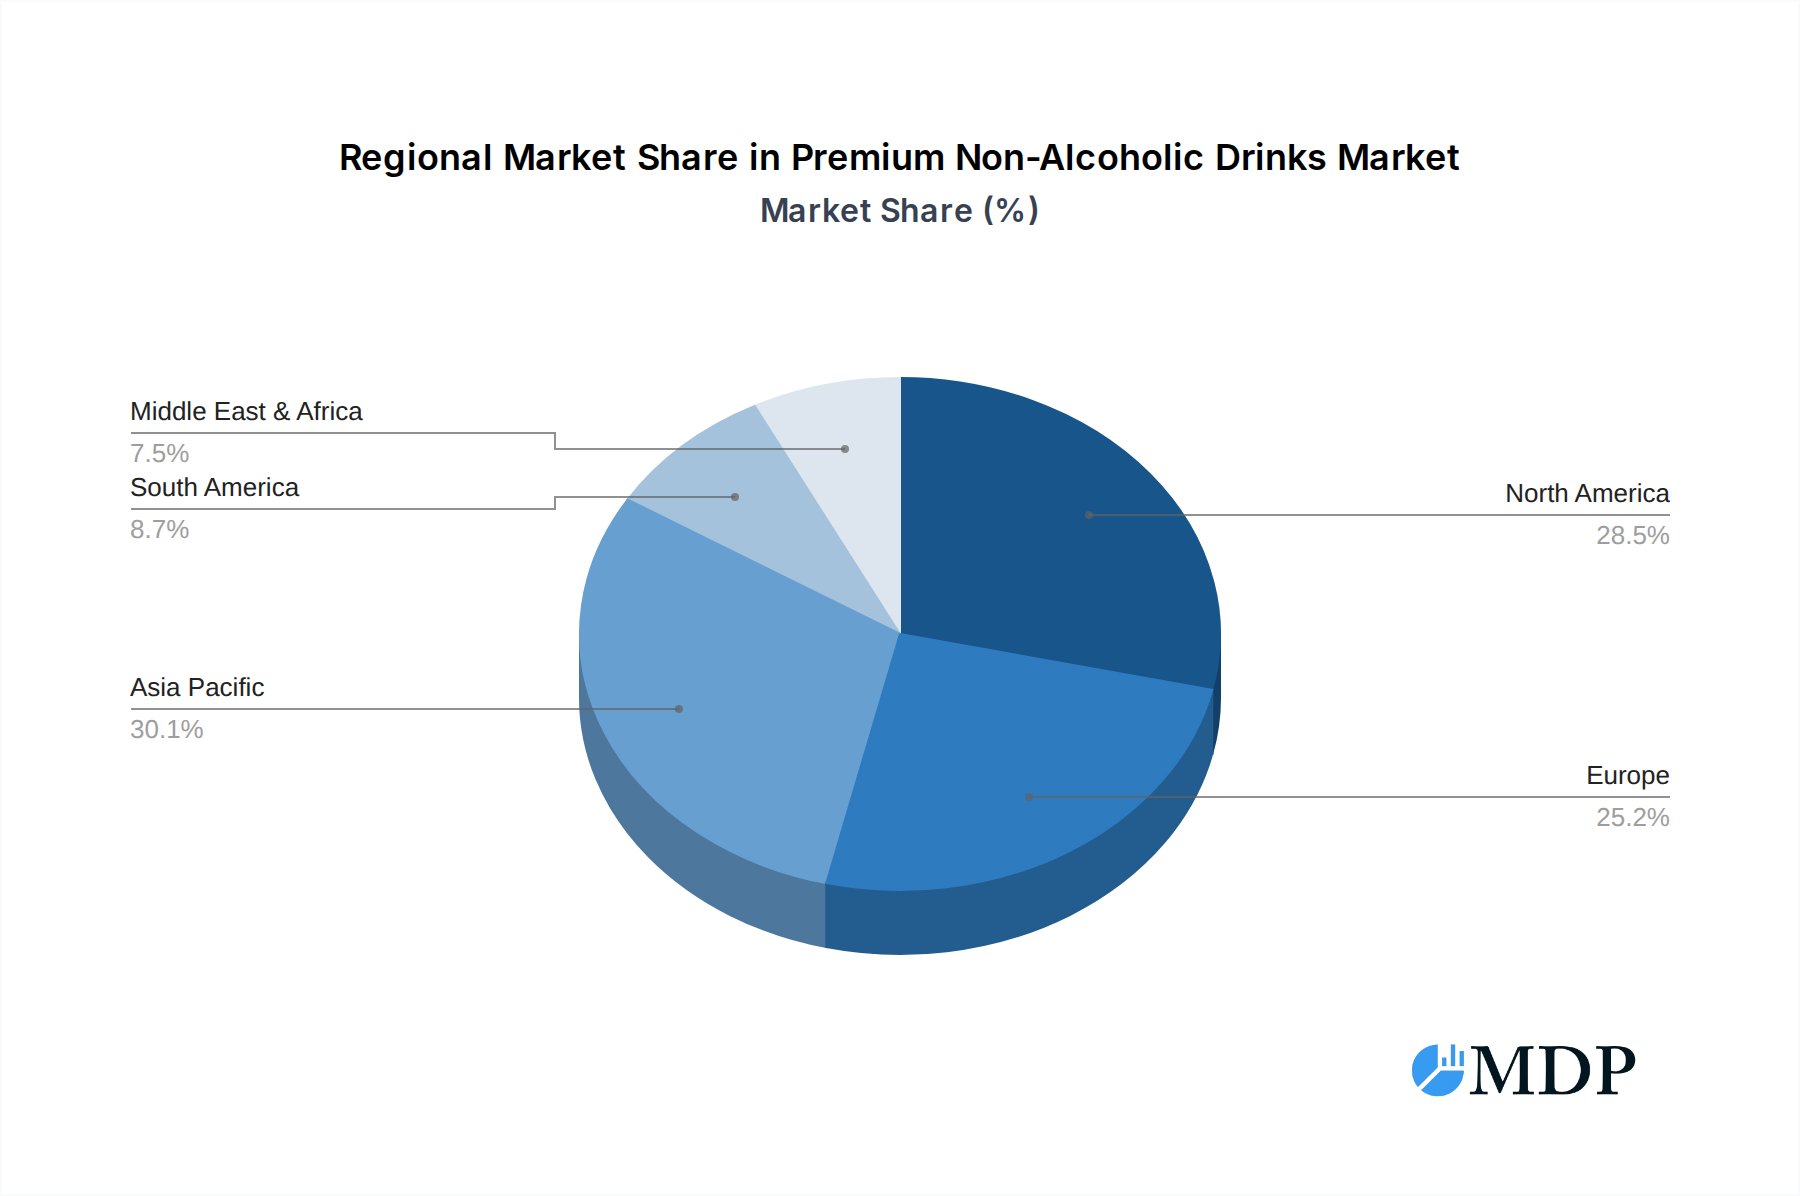
Premium Non-Alcoholic Drinks Regional Market Share
Geographic Coverage of Premium Non-Alcoholic Drinks
Premium Non-Alcoholic Drinks REPORT HIGHLIGHTS
| Aspects | Details |
|---|---|
| Study Period | 2020-2034 |
| Base Year | 2025 |
| Estimated Year | 2026 |
| Forecast Period | 2026-2034 |
| Historical Period | 2020-2025 |
| Growth Rate | CAGR of 4.78% from 2020-2034 |
| Segmentation |
|
Table of Contents
- 1. Introduction
- 1.1. Research Scope
- 1.2. Market Segmentation
- 1.3. Research Methodology
- 1.4. Definitions and Assumptions
- 2. Executive Summary
- 2.1. Introduction
- 3. Market Dynamics
- 3.1. Introduction
- 3.2. Market Drivers
- 3.3. Market Restrains
- 3.4. Market Trends
- 4. Market Factor Analysis
- 4.1. Porters Five Forces
- 4.2. Supply/Value Chain
- 4.3. PESTEL analysis
- 4.4. Market Entropy
- 4.5. Patent/Trademark Analysis
- 5. Global Premium Non-Alcoholic Drinks Analysis, Insights and Forecast, 2020-2032
- 5.1. Market Analysis, Insights and Forecast - by Application
- 5.1.1. Online
- 5.1.2. Offline
- 5.2. Market Analysis, Insights and Forecast - by Types
- 5.2.1. Soft Drinks
- 5.2.2. Tea & Coffee
- 5.2.3. Juice
- 5.2.4. Others
- 5.3. Market Analysis, Insights and Forecast - by Region
- 5.3.1. North America
- 5.3.2. South America
- 5.3.3. Europe
- 5.3.4. Middle East & Africa
- 5.3.5. Asia Pacific
- 5.1. Market Analysis, Insights and Forecast - by Application
- 6. North America Premium Non-Alcoholic Drinks Analysis, Insights and Forecast, 2020-2032
- 6.1. Market Analysis, Insights and Forecast - by Application
- 6.1.1. Online
- 6.1.2. Offline
- 6.2. Market Analysis, Insights and Forecast - by Types
- 6.2.1. Soft Drinks
- 6.2.2. Tea & Coffee
- 6.2.3. Juice
- 6.2.4. Others
- 6.1. Market Analysis, Insights and Forecast - by Application
- 7. South America Premium Non-Alcoholic Drinks Analysis, Insights and Forecast, 2020-2032
- 7.1. Market Analysis, Insights and Forecast - by Application
- 7.1.1. Online
- 7.1.2. Offline
- 7.2. Market Analysis, Insights and Forecast - by Types
- 7.2.1. Soft Drinks
- 7.2.2. Tea & Coffee
- 7.2.3. Juice
- 7.2.4. Others
- 7.1. Market Analysis, Insights and Forecast - by Application
- 8. Europe Premium Non-Alcoholic Drinks Analysis, Insights and Forecast, 2020-2032
- 8.1. Market Analysis, Insights and Forecast - by Application
- 8.1.1. Online
- 8.1.2. Offline
- 8.2. Market Analysis, Insights and Forecast - by Types
- 8.2.1. Soft Drinks
- 8.2.2. Tea & Coffee
- 8.2.3. Juice
- 8.2.4. Others
- 8.1. Market Analysis, Insights and Forecast - by Application
- 9. Middle East & Africa Premium Non-Alcoholic Drinks Analysis, Insights and Forecast, 2020-2032
- 9.1. Market Analysis, Insights and Forecast - by Application
- 9.1.1. Online
- 9.1.2. Offline
- 9.2. Market Analysis, Insights and Forecast - by Types
- 9.2.1. Soft Drinks
- 9.2.2. Tea & Coffee
- 9.2.3. Juice
- 9.2.4. Others
- 9.1. Market Analysis, Insights and Forecast - by Application
- 10. Asia Pacific Premium Non-Alcoholic Drinks Analysis, Insights and Forecast, 2020-2032
- 10.1. Market Analysis, Insights and Forecast - by Application
- 10.1.1. Online
- 10.1.2. Offline
- 10.2. Market Analysis, Insights and Forecast - by Types
- 10.2.1. Soft Drinks
- 10.2.2. Tea & Coffee
- 10.2.3. Juice
- 10.2.4. Others
- 10.1. Market Analysis, Insights and Forecast - by Application
- 11. Competitive Analysis
- 11.1. Global Market Share Analysis 2025
- 11.2. Company Profiles
- 11.2.1 Dr. Pepper Snapple Group
- 11.2.1.1. Overview
- 11.2.1.2. Products
- 11.2.1.3. SWOT Analysis
- 11.2.1.4. Recent Developments
- 11.2.1.5. Financials (Based on Availability)
- 11.2.2 Asahi
- 11.2.2.1. Overview
- 11.2.2.2. Products
- 11.2.2.3. SWOT Analysis
- 11.2.2.4. Recent Developments
- 11.2.2.5. Financials (Based on Availability)
- 11.2.3 Suntory Beverage & Food
- 11.2.3.1. Overview
- 11.2.3.2. Products
- 11.2.3.3. SWOT Analysis
- 11.2.3.4. Recent Developments
- 11.2.3.5. Financials (Based on Availability)
- 11.2.4 Jacobs Douwe Egberts
- 11.2.4.1. Overview
- 11.2.4.2. Products
- 11.2.4.3. SWOT Analysis
- 11.2.4.4. Recent Developments
- 11.2.4.5. Financials (Based on Availability)
- 11.2.5 A.G
- 11.2.5.1. Overview
- 11.2.5.2. Products
- 11.2.5.3. SWOT Analysis
- 11.2.5.4. Recent Developments
- 11.2.5.5. Financials (Based on Availability)
- 11.2.6 Barr
- 11.2.6.1. Overview
- 11.2.6.2. Products
- 11.2.6.3. SWOT Analysis
- 11.2.6.4. Recent Developments
- 11.2.6.5. Financials (Based on Availability)
- 11.2.7 Unilever
- 11.2.7.1. Overview
- 11.2.7.2. Products
- 11.2.7.3. SWOT Analysis
- 11.2.7.4. Recent Developments
- 11.2.7.5. Financials (Based on Availability)
- 11.2.8 FreshBev
- 11.2.8.1. Overview
- 11.2.8.2. Products
- 11.2.8.3. SWOT Analysis
- 11.2.8.4. Recent Developments
- 11.2.8.5. Financials (Based on Availability)
- 11.2.9 Kraft Foods
- 11.2.9.1. Overview
- 11.2.9.2. Products
- 11.2.9.3. SWOT Analysis
- 11.2.9.4. Recent Developments
- 11.2.9.5. Financials (Based on Availability)
- 11.2.10 Livewire Energy
- 11.2.10.1. Overview
- 11.2.10.2. Products
- 11.2.10.3. SWOT Analysis
- 11.2.10.4. Recent Developments
- 11.2.10.5. Financials (Based on Availability)
- 11.2.11 Calcol
- 11.2.11.1. Overview
- 11.2.11.2. Products
- 11.2.11.3. SWOT Analysis
- 11.2.11.4. Recent Developments
- 11.2.11.5. Financials (Based on Availability)
- 11.2.12 Kirin Holdings
- 11.2.12.1. Overview
- 11.2.12.2. Products
- 11.2.12.3. SWOT Analysis
- 11.2.12.4. Recent Developments
- 11.2.12.5. Financials (Based on Availability)
- 11.2.13 Dydo Drinco
- 11.2.13.1. Overview
- 11.2.13.2. Products
- 11.2.13.3. SWOT Analysis
- 11.2.13.4. Recent Developments
- 11.2.13.5. Financials (Based on Availability)
- 11.2.14 Nestle
- 11.2.14.1. Overview
- 11.2.14.2. Products
- 11.2.14.3. SWOT Analysis
- 11.2.14.4. Recent Developments
- 11.2.14.5. Financials (Based on Availability)
- 11.2.15 The Coca-Cola Company
- 11.2.15.1. Overview
- 11.2.15.2. Products
- 11.2.15.3. SWOT Analysis
- 11.2.15.4. Recent Developments
- 11.2.15.5. Financials (Based on Availability)
- 11.2.16 Pressed Juicery
- 11.2.16.1. Overview
- 11.2.16.2. Products
- 11.2.16.3. SWOT Analysis
- 11.2.16.4. Recent Developments
- 11.2.16.5. Financials (Based on Availability)
- 11.2.17 PepsiCo
- 11.2.17.1. Overview
- 11.2.17.2. Products
- 11.2.17.3. SWOT Analysis
- 11.2.17.4. Recent Developments
- 11.2.17.5. Financials (Based on Availability)
- 11.2.18 Attitude Drinks
- 11.2.18.1. Overview
- 11.2.18.2. Products
- 11.2.18.3. SWOT Analysis
- 11.2.18.4. Recent Developments
- 11.2.18.5. Financials (Based on Availability)
- 11.2.19 Suja Life
- 11.2.19.1. Overview
- 11.2.19.2. Products
- 11.2.19.3. SWOT Analysis
- 11.2.19.4. Recent Developments
- 11.2.19.5. Financials (Based on Availability)
- 11.2.20 Danone
- 11.2.20.1. Overview
- 11.2.20.2. Products
- 11.2.20.3. SWOT Analysis
- 11.2.20.4. Recent Developments
- 11.2.20.5. Financials (Based on Availability)
- 11.2.1 Dr. Pepper Snapple Group
List of Figures
- Figure 1: Global Premium Non-Alcoholic Drinks Revenue Breakdown (undefined, %) by Region 2025 & 2033
- Figure 2: North America Premium Non-Alcoholic Drinks Revenue (undefined), by Application 2025 & 2033
- Figure 3: North America Premium Non-Alcoholic Drinks Revenue Share (%), by Application 2025 & 2033
- Figure 4: North America Premium Non-Alcoholic Drinks Revenue (undefined), by Types 2025 & 2033
- Figure 5: North America Premium Non-Alcoholic Drinks Revenue Share (%), by Types 2025 & 2033
- Figure 6: North America Premium Non-Alcoholic Drinks Revenue (undefined), by Country 2025 & 2033
- Figure 7: North America Premium Non-Alcoholic Drinks Revenue Share (%), by Country 2025 & 2033
- Figure 8: South America Premium Non-Alcoholic Drinks Revenue (undefined), by Application 2025 & 2033
- Figure 9: South America Premium Non-Alcoholic Drinks Revenue Share (%), by Application 2025 & 2033
- Figure 10: South America Premium Non-Alcoholic Drinks Revenue (undefined), by Types 2025 & 2033
- Figure 11: South America Premium Non-Alcoholic Drinks Revenue Share (%), by Types 2025 & 2033
- Figure 12: South America Premium Non-Alcoholic Drinks Revenue (undefined), by Country 2025 & 2033
- Figure 13: South America Premium Non-Alcoholic Drinks Revenue Share (%), by Country 2025 & 2033
- Figure 14: Europe Premium Non-Alcoholic Drinks Revenue (undefined), by Application 2025 & 2033
- Figure 15: Europe Premium Non-Alcoholic Drinks Revenue Share (%), by Application 2025 & 2033
- Figure 16: Europe Premium Non-Alcoholic Drinks Revenue (undefined), by Types 2025 & 2033
- Figure 17: Europe Premium Non-Alcoholic Drinks Revenue Share (%), by Types 2025 & 2033
- Figure 18: Europe Premium Non-Alcoholic Drinks Revenue (undefined), by Country 2025 & 2033
- Figure 19: Europe Premium Non-Alcoholic Drinks Revenue Share (%), by Country 2025 & 2033
- Figure 20: Middle East & Africa Premium Non-Alcoholic Drinks Revenue (undefined), by Application 2025 & 2033
- Figure 21: Middle East & Africa Premium Non-Alcoholic Drinks Revenue Share (%), by Application 2025 & 2033
- Figure 22: Middle East & Africa Premium Non-Alcoholic Drinks Revenue (undefined), by Types 2025 & 2033
- Figure 23: Middle East & Africa Premium Non-Alcoholic Drinks Revenue Share (%), by Types 2025 & 2033
- Figure 24: Middle East & Africa Premium Non-Alcoholic Drinks Revenue (undefined), by Country 2025 & 2033
- Figure 25: Middle East & Africa Premium Non-Alcoholic Drinks Revenue Share (%), by Country 2025 & 2033
- Figure 26: Asia Pacific Premium Non-Alcoholic Drinks Revenue (undefined), by Application 2025 & 2033
- Figure 27: Asia Pacific Premium Non-Alcoholic Drinks Revenue Share (%), by Application 2025 & 2033
- Figure 28: Asia Pacific Premium Non-Alcoholic Drinks Revenue (undefined), by Types 2025 & 2033
- Figure 29: Asia Pacific Premium Non-Alcoholic Drinks Revenue Share (%), by Types 2025 & 2033
- Figure 30: Asia Pacific Premium Non-Alcoholic Drinks Revenue (undefined), by Country 2025 & 2033
- Figure 31: Asia Pacific Premium Non-Alcoholic Drinks Revenue Share (%), by Country 2025 & 2033
List of Tables
- Table 1: Global Premium Non-Alcoholic Drinks Revenue undefined Forecast, by Application 2020 & 2033
- Table 2: Global Premium Non-Alcoholic Drinks Revenue undefined Forecast, by Types 2020 & 2033
- Table 3: Global Premium Non-Alcoholic Drinks Revenue undefined Forecast, by Region 2020 & 2033
- Table 4: Global Premium Non-Alcoholic Drinks Revenue undefined Forecast, by Application 2020 & 2033
- Table 5: Global Premium Non-Alcoholic Drinks Revenue undefined Forecast, by Types 2020 & 2033
- Table 6: Global Premium Non-Alcoholic Drinks Revenue undefined Forecast, by Country 2020 & 2033
- Table 7: United States Premium Non-Alcoholic Drinks Revenue (undefined) Forecast, by Application 2020 & 2033
- Table 8: Canada Premium Non-Alcoholic Drinks Revenue (undefined) Forecast, by Application 2020 & 2033
- Table 9: Mexico Premium Non-Alcoholic Drinks Revenue (undefined) Forecast, by Application 2020 & 2033
- Table 10: Global Premium Non-Alcoholic Drinks Revenue undefined Forecast, by Application 2020 & 2033
- Table 11: Global Premium Non-Alcoholic Drinks Revenue undefined Forecast, by Types 2020 & 2033
- Table 12: Global Premium Non-Alcoholic Drinks Revenue undefined Forecast, by Country 2020 & 2033
- Table 13: Brazil Premium Non-Alcoholic Drinks Revenue (undefined) Forecast, by Application 2020 & 2033
- Table 14: Argentina Premium Non-Alcoholic Drinks Revenue (undefined) Forecast, by Application 2020 & 2033
- Table 15: Rest of South America Premium Non-Alcoholic Drinks Revenue (undefined) Forecast, by Application 2020 & 2033
- Table 16: Global Premium Non-Alcoholic Drinks Revenue undefined Forecast, by Application 2020 & 2033
- Table 17: Global Premium Non-Alcoholic Drinks Revenue undefined Forecast, by Types 2020 & 2033
- Table 18: Global Premium Non-Alcoholic Drinks Revenue undefined Forecast, by Country 2020 & 2033
- Table 19: United Kingdom Premium Non-Alcoholic Drinks Revenue (undefined) Forecast, by Application 2020 & 2033
- Table 20: Germany Premium Non-Alcoholic Drinks Revenue (undefined) Forecast, by Application 2020 & 2033
- Table 21: France Premium Non-Alcoholic Drinks Revenue (undefined) Forecast, by Application 2020 & 2033
- Table 22: Italy Premium Non-Alcoholic Drinks Revenue (undefined) Forecast, by Application 2020 & 2033
- Table 23: Spain Premium Non-Alcoholic Drinks Revenue (undefined) Forecast, by Application 2020 & 2033
- Table 24: Russia Premium Non-Alcoholic Drinks Revenue (undefined) Forecast, by Application 2020 & 2033
- Table 25: Benelux Premium Non-Alcoholic Drinks Revenue (undefined) Forecast, by Application 2020 & 2033
- Table 26: Nordics Premium Non-Alcoholic Drinks Revenue (undefined) Forecast, by Application 2020 & 2033
- Table 27: Rest of Europe Premium Non-Alcoholic Drinks Revenue (undefined) Forecast, by Application 2020 & 2033
- Table 28: Global Premium Non-Alcoholic Drinks Revenue undefined Forecast, by Application 2020 & 2033
- Table 29: Global Premium Non-Alcoholic Drinks Revenue undefined Forecast, by Types 2020 & 2033
- Table 30: Global Premium Non-Alcoholic Drinks Revenue undefined Forecast, by Country 2020 & 2033
- Table 31: Turkey Premium Non-Alcoholic Drinks Revenue (undefined) Forecast, by Application 2020 & 2033
- Table 32: Israel Premium Non-Alcoholic Drinks Revenue (undefined) Forecast, by Application 2020 & 2033
- Table 33: GCC Premium Non-Alcoholic Drinks Revenue (undefined) Forecast, by Application 2020 & 2033
- Table 34: North Africa Premium Non-Alcoholic Drinks Revenue (undefined) Forecast, by Application 2020 & 2033
- Table 35: South Africa Premium Non-Alcoholic Drinks Revenue (undefined) Forecast, by Application 2020 & 2033
- Table 36: Rest of Middle East & Africa Premium Non-Alcoholic Drinks Revenue (undefined) Forecast, by Application 2020 & 2033
- Table 37: Global Premium Non-Alcoholic Drinks Revenue undefined Forecast, by Application 2020 & 2033
- Table 38: Global Premium Non-Alcoholic Drinks Revenue undefined Forecast, by Types 2020 & 2033
- Table 39: Global Premium Non-Alcoholic Drinks Revenue undefined Forecast, by Country 2020 & 2033
- Table 40: China Premium Non-Alcoholic Drinks Revenue (undefined) Forecast, by Application 2020 & 2033
- Table 41: India Premium Non-Alcoholic Drinks Revenue (undefined) Forecast, by Application 2020 & 2033
- Table 42: Japan Premium Non-Alcoholic Drinks Revenue (undefined) Forecast, by Application 2020 & 2033
- Table 43: South Korea Premium Non-Alcoholic Drinks Revenue (undefined) Forecast, by Application 2020 & 2033
- Table 44: ASEAN Premium Non-Alcoholic Drinks Revenue (undefined) Forecast, by Application 2020 & 2033
- Table 45: Oceania Premium Non-Alcoholic Drinks Revenue (undefined) Forecast, by Application 2020 & 2033
- Table 46: Rest of Asia Pacific Premium Non-Alcoholic Drinks Revenue (undefined) Forecast, by Application 2020 & 2033
Frequently Asked Questions
1. What is the projected Compound Annual Growth Rate (CAGR) of the Premium Non-Alcoholic Drinks?
The projected CAGR is approximately 4.78%.
2. Which companies are prominent players in the Premium Non-Alcoholic Drinks?
Key companies in the market include Dr. Pepper Snapple Group, Asahi, Suntory Beverage & Food, Jacobs Douwe Egberts, A.G, Barr, Unilever, FreshBev, Kraft Foods, Livewire Energy, Calcol, Kirin Holdings, Dydo Drinco, Nestle, The Coca-Cola Company, Pressed Juicery, PepsiCo, Attitude Drinks, Suja Life, Danone.
3. What are the main segments of the Premium Non-Alcoholic Drinks?
The market segments include Application, Types.
4. Can you provide details about the market size?
The market size is estimated to be USD XXX N/A as of 2022.
5. What are some drivers contributing to market growth?
N/A
6. What are the notable trends driving market growth?
N/A
7. Are there any restraints impacting market growth?
N/A
8. Can you provide examples of recent developments in the market?
N/A
9. What pricing options are available for accessing the report?
Pricing options include single-user, multi-user, and enterprise licenses priced at USD 5600.00, USD 8400.00, and USD 11200.00 respectively.
10. Is the market size provided in terms of value or volume?
The market size is provided in terms of value, measured in N/A.
11. Are there any specific market keywords associated with the report?
Yes, the market keyword associated with the report is "Premium Non-Alcoholic Drinks," which aids in identifying and referencing the specific market segment covered.
12. How do I determine which pricing option suits my needs best?
The pricing options vary based on user requirements and access needs. Individual users may opt for single-user licenses, while businesses requiring broader access may choose multi-user or enterprise licenses for cost-effective access to the report.
13. Are there any additional resources or data provided in the Premium Non-Alcoholic Drinks report?
While the report offers comprehensive insights, it's advisable to review the specific contents or supplementary materials provided to ascertain if additional resources or data are available.
14. How can I stay updated on further developments or reports in the Premium Non-Alcoholic Drinks?
To stay informed about further developments, trends, and reports in the Premium Non-Alcoholic Drinks, consider subscribing to industry newsletters, following relevant companies and organizations, or regularly checking reputable industry news sources and publications.
Methodology
Step 1 - Identification of Relevant Samples Size from Population Database


Step 2 - Approaches for Defining Global Market Size (Value, Volume* & Price*)

Note*: In applicable scenarios
Step 3 - Data Sources
Primary Research
- Web Analytics
- Survey Reports
- Research Institute
- Latest Research Reports
- Opinion Leaders
Secondary Research
- Annual Reports
- White Paper
- Latest Press Release
- Industry Association
- Paid Database
- Investor Presentations

Step 4 - Data Triangulation
Involves using different sources of information in order to increase the validity of a study
These sources are likely to be stakeholders in a program - participants, other researchers, program staff, other community members, and so on.
Then we put all data in single framework & apply various statistical tools to find out the dynamic on the market.
During the analysis stage, feedback from the stakeholder groups would be compared to determine areas of agreement as well as areas of divergence