

Key Insights
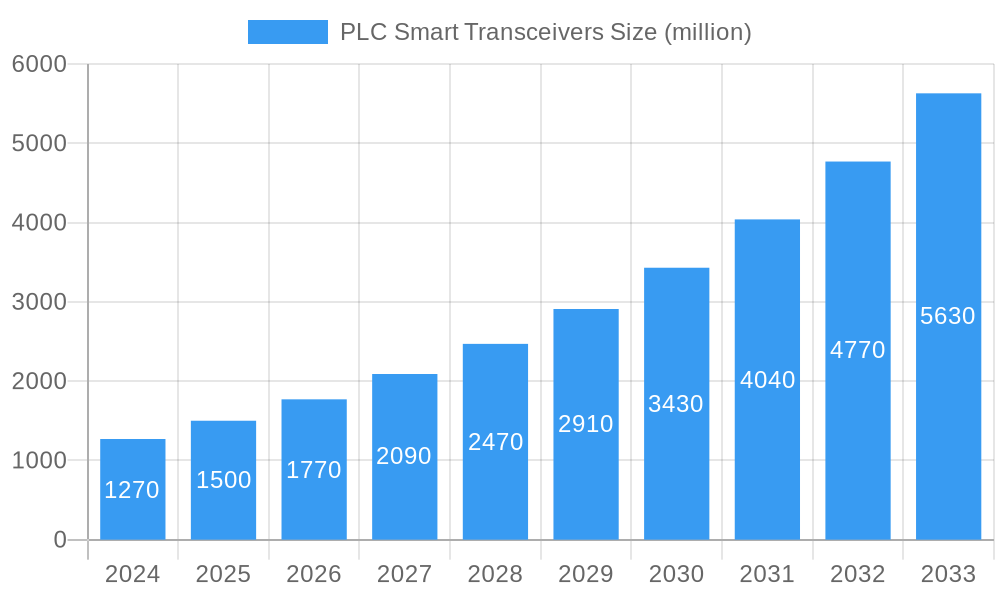
The Global PLC Smart Transceivers Market is projected for substantial expansion, anticipated to reach $14 billion by 2025, with a robust Compound Annual Growth Rate (CAGR) of 10.87% through 2033. This significant growth is primarily attributed to the increasing adoption of smart grid technologies, driven by the global demand for enhanced energy efficiency and grid modernization. The telecommunications sector is a key driver, utilizing PLC smart transceivers for advanced data transmission in Broadband over Power Lines (BPL) and in-building networking. The automotive industry's growing integration of connected vehicle features and Advanced Driver-Assistance Systems (ADAS) also fuels demand, enabling reliable in-vehicle and vehicle-to-infrastructure communication. Furthermore, the healthcare sector's increasing reliance on connected medical devices for remote patient monitoring and diagnostics presents a considerable growth opportunity.
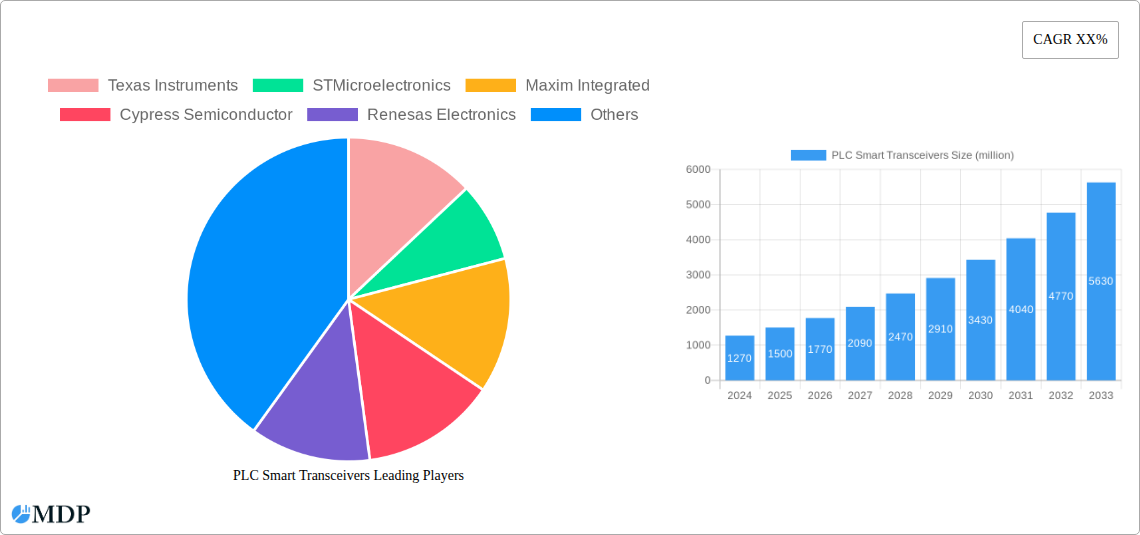
PLC Smart Transceivers Market Size (In Billion)
Market growth is further propelled by continuous technological advancements, resulting in the development of both low-power and high-power transceivers to meet diverse application requirements. Low-power variants are vital for energy-efficient smart home devices and Internet of Things (IoT) applications, while high-power solutions are essential for robust smart grid communication and industrial automation. Leading industry players, including Texas Instruments, STMicroelectronics, Maxim Integrated, and ON Semiconductor, are spearheading innovation with advanced solutions offering improved data rates, reliability, and security. While potential challenges such as power line interference and the need for regional standardization exist, the overarching trend towards smarter, interconnected infrastructure across all sectors indicates a strong positive outlook for the PLC Smart Transceivers Market.
PLC Smart Transceivers Company Market Share
Unlock the Future of Connected Infrastructure: PLC Smart Transceiver Market Report
This comprehensive report delivers an in-depth analysis of the global PLC smart transceivers market, a critical component for intelligent networking across diverse industries. Covering the study period of 2019–2033, with a base year of 2025 and a forecast period of 2025–2033, this report provides unparalleled insights into market dynamics, growth drivers, competitive landscapes, and emerging opportunities. Discover how advancements in telecommunications, automotive, medical, and smart grid systems are propelling the adoption of both low-power and high-power PLC smart transceivers. With detailed segmentation and regional analysis, this report is an essential resource for stakeholders seeking to capitalize on the burgeoning power line communication (PLC) technology.
PLC Smart Transceivers Market Dynamics & Concentration
The global PLC smart transceivers market exhibits a dynamic and evolving landscape characterized by intense innovation and strategic consolidation. Market concentration is moderate, with a few leading players holding significant market share, while a robust ecosystem of smaller innovators continues to emerge. Key innovation drivers include the increasing demand for reliable and efficient data transmission over existing power lines, particularly for the expansion of smart grid systems, the automotive sector’s need for robust in-vehicle communication, and advancements in telecommunications infrastructure. Regulatory frameworks are becoming increasingly favorable, with standards like IEEE P1901 and G3-PLC shaping interoperability and driving widespread adoption. Product substitutes, such as Wi-Fi and Ethernet, exist but often require new cabling infrastructure, making PLC solutions attractive for retrofitting and cost-effectiveness. End-user trends point towards a growing preference for seamless, high-bandwidth connectivity in industrial automation, smart homes, and connected vehicles. Merger and acquisition (M&A) activities are expected to increase as larger companies seek to integrate advanced PLC technologies and expand their market reach. For instance, anticipated M&A deal counts are projected to reach xx by 2028, reflecting a strategic imperative for growth and market leadership. Key market players are actively investing in R&D to enhance data rates, reduce power consumption, and improve noise immunity in PLC smart transceivers.
PLC Smart Transceivers Industry Trends & Analysis
The PLC smart transceivers industry is poised for substantial growth, driven by an insatiable demand for ubiquitous and robust connectivity solutions. Market growth is projected to be fueled by the accelerating deployment of smart grid infrastructure worldwide, where PLC technology offers a cost-effective and efficient method for two-way communication between the utility and end consumers. The automotive industry is another significant growth catalyst, with PLC gaining traction for in-vehicle networking, enabling communication between various electronic control units (ECUs) and facilitating advanced driver-assistance systems (ADAS). Technological disruptions, such as advancements in modulation techniques and signal processing, are continuously enhancing the performance of PLC smart transceivers, leading to higher data transfer rates and improved reliability. Consumer preferences are increasingly shifting towards integrated and seamless smart home solutions, where PLC offers a compelling alternative to traditional wireless networking, especially in environments with poor Wi-Fi coverage. Competitive dynamics are characterized by a blend of established semiconductor giants and agile emerging players. Companies are focusing on developing highly integrated, low-power PLC chipsets that cater to the stringent requirements of battery-operated devices and energy-efficient applications. The market penetration of PLC smart transceivers in the smart grid segment is estimated to reach xx% by 2028, a testament to the technology’s proven efficacy and cost advantages. The compound annual growth rate (CAGR) for the global PLC smart transceivers market is projected to be xx% during the forecast period (2025-2033), indicating a strong upward trajectory. This growth is underpinned by substantial investments in digitalization and automation across various sectors, further solidifying PLC's role as a foundational technology for the Internet of Things (IoT).
Leading Markets & Segments in PLC Smart Transceivers
The global PLC smart transceivers market is witnessing significant dominance from specific regions and application segments, driven by distinct economic policies and infrastructure development initiatives. Smart Grid Systems stands out as the leading application segment, propelled by governments worldwide investing heavily in modernizing their electrical grids. This investment translates to a substantial demand for smart meters, grid monitoring equipment, and intelligent substation automation systems, all of which rely on robust PLC communication. The penetration of PLC in smart grids is driven by economic policies aimed at energy efficiency, demand-side management, and the integration of renewable energy sources, requiring reliable communication networks.
Within the telecommunications sector, PLC is increasingly being explored for last-mile connectivity and in-building networking, offering a cost-effective alternative to deploying new fiber optic or Ethernet cables. The demand for higher bandwidth and lower latency in these applications is a key driver, with advancements in PLC technology enabling higher data rates.
The automotive segment is another key area of growth. The increasing complexity of vehicle electronics, coupled with the proliferation of connected car features and ADAS, necessitates efficient and reliable in-vehicle networking. PLC offers a robust solution for reducing wiring harnesses, saving weight and cost, and improving data integrity in the harsh automotive environment. The economic advantage of reduced wiring complexity and enhanced vehicle functionality are major stimulants here.
In terms of geographical dominance, Asia Pacific is expected to lead the market, largely due to rapid urbanization, massive investments in smart city initiatives, and the proactive adoption of smart grid technologies in countries like China and India. Favorable government policies promoting digital infrastructure and energy efficiency are crucial economic policies in this region. North America and Europe follow closely, driven by ongoing smart grid deployments and stringent regulatory mandates for energy management and smart home technologies.
Regarding types, Low-Power PLC smart transceivers are experiencing robust demand, particularly in battery-operated IoT devices and smart home applications where energy efficiency is paramount. However, the growth of High-Power PLC solutions is closely tied to the smart grid and industrial automation sectors, where robust communication over longer distances and through challenging environments is essential. Key drivers for the high-power segment include the need for reliable grid control, automated industrial processes, and secure data transmission in demanding conditions.
PLC Smart Transceivers Product Developments
Recent product developments in PLC smart transceivers focus on enhancing data rates, improving power efficiency, and increasing integration capabilities. Manufacturers are introducing highly integrated System-on-Chips (SoCs) that combine PLC modems with microcontrollers, thereby reducing component count and system cost. Innovations in advanced modulation schemes and error correction techniques are enabling higher throughput and greater reliability, crucial for demanding applications like automotive networking and smart grid communications. Competitive advantages are being gained through the development of interoperable solutions that adhere to global standards, fostering wider ecosystem adoption. Furthermore, advancements in low-power consumption technologies are making PLC suitable for an expanded range of battery-powered IoT devices, driving market penetration into new application areas.
Key Drivers of PLC Smart Transceivers Growth
The growth of the PLC smart transceivers market is primarily driven by several key factors. The accelerating deployment of smart grid systems worldwide, aimed at improving grid efficiency, reliability, and enabling smart metering, is a major catalyst. The increasing adoption of the Internet of Things (IoT) and the need for robust, wired connectivity in smart homes, industrial automation, and connected vehicles also contribute significantly. Technological advancements in PLC technology, leading to higher data rates and improved noise immunity, are expanding its applicability. Furthermore, supportive government initiatives and regulatory frameworks promoting energy efficiency and smart infrastructure development are creating a favorable market environment. The cost-effectiveness of utilizing existing power line infrastructure for communication also presents a significant advantage over deploying new cabling.
Challenges in the PLC Smart Transceivers Market
Despite its strong growth potential, the PLC smart transceivers market faces several challenges. Regulatory hurdles and the need for standardization across different regions can slow down adoption. Interference from electrical noise on power lines, particularly in older or poorly maintained electrical infrastructures, can degrade performance and necessitate advanced filtering and signal processing techniques. Supply chain issues for critical components and limited bandwidth compared to advanced fiber optic or Wi-Fi technologies in certain high-demand applications can also pose restraints. Moreover, competition from alternative communication technologies like wireless mesh networks and cellular IoT requires continuous innovation and cost optimization to maintain a competitive edge. The projected impact of these challenges could lead to a xx% slower market penetration in certain niche segments if not adequately addressed.
Emerging Opportunities in PLC Smart Transceivers
Emerging opportunities in the PLC smart transceivers market are abundant, driven by technological breakthroughs and strategic market expansion. The increasing demand for robust and secure communication in the automotive sector for in-vehicle networking and vehicle-to-infrastructure (V2I) communication presents a significant growth avenue. The expansion of smart city initiatives globally, requiring extensive sensor networks and data management, will necessitate reliable communication solutions like PLC for applications such as street lighting control, environmental monitoring, and public safety systems. Strategic partnerships between semiconductor manufacturers and application developers are crucial for unlocking new use cases and creating integrated solutions. Furthermore, the development of advanced PLC technologies that offer higher data rates and lower latency will enable its adoption in more bandwidth-intensive applications, further broadening the market scope. The market is also observing a growing interest in hybrid communication systems that leverage PLC alongside wireless technologies to create more resilient and comprehensive connectivity solutions.
Leading Players in the PLC Smart Transceivers Sector
- Texas Instruments
- STMicroelectronics
- Maxim Integrated
- Cypress Semiconductor
- Renesas Electronics
- Semtech
- ON Semiconductor
- Analog Devices
- Microchip Technology
- Silicon Labs
- Murata Manufacturing
- NXP Semiconductors
- Marvell Technology Group
- Adesto Technologies
- Broadcom
- Mouser Electronics
- Future Electronics
- Shenzhen Wlink Technology
- Beijing Huanuo
- Shanghai Belling
Key Milestones in PLC Smart Transceivers Industry
- 2019: Launch of G3-PLC certified chipsets enabling wider interoperability in smart grids.
- 2020: Introduction of high-speed PLC modems (over 1 Mbps) for telecommunications backhaul applications.
- 2021: Increased adoption of PLC for in-vehicle communication in new automotive models.
- 2022: Significant growth in smart meter deployments leveraging PLC technology in Europe and Asia.
- 2023: Development of advanced noise immunity techniques for PLC in industrial environments.
- 2024: Emergence of new standards and initiatives for further enhancing PLC performance and security.
- 2025: Expected integration of PLC with emerging IoT platforms for enhanced smart home capabilities.
- 2026: Projected advancements in PLC for 5G infrastructure backhaul and edge computing.
- 2027: Anticipated growth in automotive applications beyond infotainment, including V2X communication.
- 2028: Continued strong growth in smart grid deployments driven by renewable energy integration.
- 2029: Exploration of PLC for mission-critical industrial automation and control systems.
- 2030: Increased focus on energy-efficient, ultra-low-power PLC solutions for wearable devices.
- 2031: Potential for PLC to play a role in future smart city network architectures.
- 2032: Continued innovation in PLC chipsets to meet increasing data demands and diverse application needs.
- 2033: Maturity of PLC technology in core applications with ongoing niche market expansion.
Strategic Outlook for PLC Smart Transceivers Market
The strategic outlook for the PLC smart transceivers market is exceptionally positive, driven by its inherent advantages in cost-effectiveness and utilization of existing infrastructure. Growth accelerators include the expanding global deployments of smart grids, the increasing sophistication of connected vehicles, and the persistent need for reliable in-building networking solutions in the telecommunications sector. Continued investment in R&D to enhance data rates, improve spectral efficiency, and develop highly integrated, low-power chipsets will be crucial for capturing new market opportunities. Strategic partnerships, particularly between semiconductor manufacturers and system integrators, will foster wider adoption and application development. The market is also likely to see further consolidation and specialization as companies aim to cater to the unique requirements of diverse end-user segments. The overall trajectory indicates sustained growth, positioning PLC smart transceivers as a vital technology for the connected future.
PLC Smart Transceivers Segmentation
-
1. Application
- 1.1. Telecommunications
- 1.2. Automotive
- 1.3. Medical
- 1.4. Smart Grid Systems
- 1.5. Others
-
2. Types
- 2.1. Low-Power
- 2.2. High-Power
PLC Smart Transceivers Segmentation By Geography
-
1. North America
- 1.1. United States
- 1.2. Canada
- 1.3. Mexico
-
2. South America
- 2.1. Brazil
- 2.2. Argentina
- 2.3. Rest of South America
-
3. Europe
- 3.1. United Kingdom
- 3.2. Germany
- 3.3. France
- 3.4. Italy
- 3.5. Spain
- 3.6. Russia
- 3.7. Benelux
- 3.8. Nordics
- 3.9. Rest of Europe
-
4. Middle East & Africa
- 4.1. Turkey
- 4.2. Israel
- 4.3. GCC
- 4.4. North Africa
- 4.5. South Africa
- 4.6. Rest of Middle East & Africa
-
5. Asia Pacific
- 5.1. China
- 5.2. India
- 5.3. Japan
- 5.4. South Korea
- 5.5. ASEAN
- 5.6. Oceania
- 5.7. Rest of Asia Pacific

PLC Smart Transceivers Regional Market Share
Geographic Coverage of PLC Smart Transceivers
PLC Smart Transceivers REPORT HIGHLIGHTS
| Aspects | Details |
|---|---|
| Study Period | 2020-2034 |
| Base Year | 2025 |
| Estimated Year | 2026 |
| Forecast Period | 2026-2034 |
| Historical Period | 2020-2025 |
| Growth Rate | CAGR of 10.87% from 2020-2034 |
| Segmentation |
|
Table of Contents
- 1. Introduction
- 1.1. Research Scope
- 1.2. Market Segmentation
- 1.3. Research Methodology
- 1.4. Definitions and Assumptions
- 2. Executive Summary
- 2.1. Introduction
- 3. Market Dynamics
- 3.1. Introduction
- 3.2. Market Drivers
- 3.3. Market Restrains
- 3.4. Market Trends
- 4. Market Factor Analysis
- 4.1. Porters Five Forces
- 4.2. Supply/Value Chain
- 4.3. PESTEL analysis
- 4.4. Market Entropy
- 4.5. Patent/Trademark Analysis
- 5. Global PLC Smart Transceivers Analysis, Insights and Forecast, 2020-2032
- 5.1. Market Analysis, Insights and Forecast - by Application
- 5.1.1. Telecommunications
- 5.1.2. Automotive
- 5.1.3. Medical
- 5.1.4. Smart Grid Systems
- 5.1.5. Others
- 5.2. Market Analysis, Insights and Forecast - by Types
- 5.2.1. Low-Power
- 5.2.2. High-Power
- 5.3. Market Analysis, Insights and Forecast - by Region
- 5.3.1. North America
- 5.3.2. South America
- 5.3.3. Europe
- 5.3.4. Middle East & Africa
- 5.3.5. Asia Pacific
- 5.1. Market Analysis, Insights and Forecast - by Application
- 6. North America PLC Smart Transceivers Analysis, Insights and Forecast, 2020-2032
- 6.1. Market Analysis, Insights and Forecast - by Application
- 6.1.1. Telecommunications
- 6.1.2. Automotive
- 6.1.3. Medical
- 6.1.4. Smart Grid Systems
- 6.1.5. Others
- 6.2. Market Analysis, Insights and Forecast - by Types
- 6.2.1. Low-Power
- 6.2.2. High-Power
- 6.1. Market Analysis, Insights and Forecast - by Application
- 7. South America PLC Smart Transceivers Analysis, Insights and Forecast, 2020-2032
- 7.1. Market Analysis, Insights and Forecast - by Application
- 7.1.1. Telecommunications
- 7.1.2. Automotive
- 7.1.3. Medical
- 7.1.4. Smart Grid Systems
- 7.1.5. Others
- 7.2. Market Analysis, Insights and Forecast - by Types
- 7.2.1. Low-Power
- 7.2.2. High-Power
- 7.1. Market Analysis, Insights and Forecast - by Application
- 8. Europe PLC Smart Transceivers Analysis, Insights and Forecast, 2020-2032
- 8.1. Market Analysis, Insights and Forecast - by Application
- 8.1.1. Telecommunications
- 8.1.2. Automotive
- 8.1.3. Medical
- 8.1.4. Smart Grid Systems
- 8.1.5. Others
- 8.2. Market Analysis, Insights and Forecast - by Types
- 8.2.1. Low-Power
- 8.2.2. High-Power
- 8.1. Market Analysis, Insights and Forecast - by Application
- 9. Middle East & Africa PLC Smart Transceivers Analysis, Insights and Forecast, 2020-2032
- 9.1. Market Analysis, Insights and Forecast - by Application
- 9.1.1. Telecommunications
- 9.1.2. Automotive
- 9.1.3. Medical
- 9.1.4. Smart Grid Systems
- 9.1.5. Others
- 9.2. Market Analysis, Insights and Forecast - by Types
- 9.2.1. Low-Power
- 9.2.2. High-Power
- 9.1. Market Analysis, Insights and Forecast - by Application
- 10. Asia Pacific PLC Smart Transceivers Analysis, Insights and Forecast, 2020-2032
- 10.1. Market Analysis, Insights and Forecast - by Application
- 10.1.1. Telecommunications
- 10.1.2. Automotive
- 10.1.3. Medical
- 10.1.4. Smart Grid Systems
- 10.1.5. Others
- 10.2. Market Analysis, Insights and Forecast - by Types
- 10.2.1. Low-Power
- 10.2.2. High-Power
- 10.1. Market Analysis, Insights and Forecast - by Application
- 11. Competitive Analysis
- 11.1. Global Market Share Analysis 2025
- 11.2. Company Profiles
- 11.2.1 Texas Instruments
- 11.2.1.1. Overview
- 11.2.1.2. Products
- 11.2.1.3. SWOT Analysis
- 11.2.1.4. Recent Developments
- 11.2.1.5. Financials (Based on Availability)
- 11.2.2 STMicroelectronics
- 11.2.2.1. Overview
- 11.2.2.2. Products
- 11.2.2.3. SWOT Analysis
- 11.2.2.4. Recent Developments
- 11.2.2.5. Financials (Based on Availability)
- 11.2.3 Maxim Integrated
- 11.2.3.1. Overview
- 11.2.3.2. Products
- 11.2.3.3. SWOT Analysis
- 11.2.3.4. Recent Developments
- 11.2.3.5. Financials (Based on Availability)
- 11.2.4 Cypress Semiconductor
- 11.2.4.1. Overview
- 11.2.4.2. Products
- 11.2.4.3. SWOT Analysis
- 11.2.4.4. Recent Developments
- 11.2.4.5. Financials (Based on Availability)
- 11.2.5 Renesas Electronics
- 11.2.5.1. Overview
- 11.2.5.2. Products
- 11.2.5.3. SWOT Analysis
- 11.2.5.4. Recent Developments
- 11.2.5.5. Financials (Based on Availability)
- 11.2.6 Semtech
- 11.2.6.1. Overview
- 11.2.6.2. Products
- 11.2.6.3. SWOT Analysis
- 11.2.6.4. Recent Developments
- 11.2.6.5. Financials (Based on Availability)
- 11.2.7 ON Semiconductor
- 11.2.7.1. Overview
- 11.2.7.2. Products
- 11.2.7.3. SWOT Analysis
- 11.2.7.4. Recent Developments
- 11.2.7.5. Financials (Based on Availability)
- 11.2.8 Analog Devices
- 11.2.8.1. Overview
- 11.2.8.2. Products
- 11.2.8.3. SWOT Analysis
- 11.2.8.4. Recent Developments
- 11.2.8.5. Financials (Based on Availability)
- 11.2.9 Microchip Technology
- 11.2.9.1. Overview
- 11.2.9.2. Products
- 11.2.9.3. SWOT Analysis
- 11.2.9.4. Recent Developments
- 11.2.9.5. Financials (Based on Availability)
- 11.2.10 Silicon Labs
- 11.2.10.1. Overview
- 11.2.10.2. Products
- 11.2.10.3. SWOT Analysis
- 11.2.10.4. Recent Developments
- 11.2.10.5. Financials (Based on Availability)
- 11.2.11 Murata Manufacturing
- 11.2.11.1. Overview
- 11.2.11.2. Products
- 11.2.11.3. SWOT Analysis
- 11.2.11.4. Recent Developments
- 11.2.11.5. Financials (Based on Availability)
- 11.2.12 NXP Semiconductors
- 11.2.12.1. Overview
- 11.2.12.2. Products
- 11.2.12.3. SWOT Analysis
- 11.2.12.4. Recent Developments
- 11.2.12.5. Financials (Based on Availability)
- 11.2.13 Marvell Technology Group
- 11.2.13.1. Overview
- 11.2.13.2. Products
- 11.2.13.3. SWOT Analysis
- 11.2.13.4. Recent Developments
- 11.2.13.5. Financials (Based on Availability)
- 11.2.14 Adesto Technologies
- 11.2.14.1. Overview
- 11.2.14.2. Products
- 11.2.14.3. SWOT Analysis
- 11.2.14.4. Recent Developments
- 11.2.14.5. Financials (Based on Availability)
- 11.2.15 Broadcom
- 11.2.15.1. Overview
- 11.2.15.2. Products
- 11.2.15.3. SWOT Analysis
- 11.2.15.4. Recent Developments
- 11.2.15.5. Financials (Based on Availability)
- 11.2.16 Mouser Electronics
- 11.2.16.1. Overview
- 11.2.16.2. Products
- 11.2.16.3. SWOT Analysis
- 11.2.16.4. Recent Developments
- 11.2.16.5. Financials (Based on Availability)
- 11.2.17 Future Electronics
- 11.2.17.1. Overview
- 11.2.17.2. Products
- 11.2.17.3. SWOT Analysis
- 11.2.17.4. Recent Developments
- 11.2.17.5. Financials (Based on Availability)
- 11.2.18 Shenzhen Wlink Technology
- 11.2.18.1. Overview
- 11.2.18.2. Products
- 11.2.18.3. SWOT Analysis
- 11.2.18.4. Recent Developments
- 11.2.18.5. Financials (Based on Availability)
- 11.2.19 Beijing Huanuo
- 11.2.19.1. Overview
- 11.2.19.2. Products
- 11.2.19.3. SWOT Analysis
- 11.2.19.4. Recent Developments
- 11.2.19.5. Financials (Based on Availability)
- 11.2.20 Shanghai Belling
- 11.2.20.1. Overview
- 11.2.20.2. Products
- 11.2.20.3. SWOT Analysis
- 11.2.20.4. Recent Developments
- 11.2.20.5. Financials (Based on Availability)
- 11.2.1 Texas Instruments
List of Figures
- Figure 1: Global PLC Smart Transceivers Revenue Breakdown (billion, %) by Region 2025 & 2033
- Figure 2: Global PLC Smart Transceivers Volume Breakdown (K, %) by Region 2025 & 2033
- Figure 3: North America PLC Smart Transceivers Revenue (billion), by Application 2025 & 2033
- Figure 4: North America PLC Smart Transceivers Volume (K), by Application 2025 & 2033
- Figure 5: North America PLC Smart Transceivers Revenue Share (%), by Application 2025 & 2033
- Figure 6: North America PLC Smart Transceivers Volume Share (%), by Application 2025 & 2033
- Figure 7: North America PLC Smart Transceivers Revenue (billion), by Types 2025 & 2033
- Figure 8: North America PLC Smart Transceivers Volume (K), by Types 2025 & 2033
- Figure 9: North America PLC Smart Transceivers Revenue Share (%), by Types 2025 & 2033
- Figure 10: North America PLC Smart Transceivers Volume Share (%), by Types 2025 & 2033
- Figure 11: North America PLC Smart Transceivers Revenue (billion), by Country 2025 & 2033
- Figure 12: North America PLC Smart Transceivers Volume (K), by Country 2025 & 2033
- Figure 13: North America PLC Smart Transceivers Revenue Share (%), by Country 2025 & 2033
- Figure 14: North America PLC Smart Transceivers Volume Share (%), by Country 2025 & 2033
- Figure 15: South America PLC Smart Transceivers Revenue (billion), by Application 2025 & 2033
- Figure 16: South America PLC Smart Transceivers Volume (K), by Application 2025 & 2033
- Figure 17: South America PLC Smart Transceivers Revenue Share (%), by Application 2025 & 2033
- Figure 18: South America PLC Smart Transceivers Volume Share (%), by Application 2025 & 2033
- Figure 19: South America PLC Smart Transceivers Revenue (billion), by Types 2025 & 2033
- Figure 20: South America PLC Smart Transceivers Volume (K), by Types 2025 & 2033
- Figure 21: South America PLC Smart Transceivers Revenue Share (%), by Types 2025 & 2033
- Figure 22: South America PLC Smart Transceivers Volume Share (%), by Types 2025 & 2033
- Figure 23: South America PLC Smart Transceivers Revenue (billion), by Country 2025 & 2033
- Figure 24: South America PLC Smart Transceivers Volume (K), by Country 2025 & 2033
- Figure 25: South America PLC Smart Transceivers Revenue Share (%), by Country 2025 & 2033
- Figure 26: South America PLC Smart Transceivers Volume Share (%), by Country 2025 & 2033
- Figure 27: Europe PLC Smart Transceivers Revenue (billion), by Application 2025 & 2033
- Figure 28: Europe PLC Smart Transceivers Volume (K), by Application 2025 & 2033
- Figure 29: Europe PLC Smart Transceivers Revenue Share (%), by Application 2025 & 2033
- Figure 30: Europe PLC Smart Transceivers Volume Share (%), by Application 2025 & 2033
- Figure 31: Europe PLC Smart Transceivers Revenue (billion), by Types 2025 & 2033
- Figure 32: Europe PLC Smart Transceivers Volume (K), by Types 2025 & 2033
- Figure 33: Europe PLC Smart Transceivers Revenue Share (%), by Types 2025 & 2033
- Figure 34: Europe PLC Smart Transceivers Volume Share (%), by Types 2025 & 2033
- Figure 35: Europe PLC Smart Transceivers Revenue (billion), by Country 2025 & 2033
- Figure 36: Europe PLC Smart Transceivers Volume (K), by Country 2025 & 2033
- Figure 37: Europe PLC Smart Transceivers Revenue Share (%), by Country 2025 & 2033
- Figure 38: Europe PLC Smart Transceivers Volume Share (%), by Country 2025 & 2033
- Figure 39: Middle East & Africa PLC Smart Transceivers Revenue (billion), by Application 2025 & 2033
- Figure 40: Middle East & Africa PLC Smart Transceivers Volume (K), by Application 2025 & 2033
- Figure 41: Middle East & Africa PLC Smart Transceivers Revenue Share (%), by Application 2025 & 2033
- Figure 42: Middle East & Africa PLC Smart Transceivers Volume Share (%), by Application 2025 & 2033
- Figure 43: Middle East & Africa PLC Smart Transceivers Revenue (billion), by Types 2025 & 2033
- Figure 44: Middle East & Africa PLC Smart Transceivers Volume (K), by Types 2025 & 2033
- Figure 45: Middle East & Africa PLC Smart Transceivers Revenue Share (%), by Types 2025 & 2033
- Figure 46: Middle East & Africa PLC Smart Transceivers Volume Share (%), by Types 2025 & 2033
- Figure 47: Middle East & Africa PLC Smart Transceivers Revenue (billion), by Country 2025 & 2033
- Figure 48: Middle East & Africa PLC Smart Transceivers Volume (K), by Country 2025 & 2033
- Figure 49: Middle East & Africa PLC Smart Transceivers Revenue Share (%), by Country 2025 & 2033
- Figure 50: Middle East & Africa PLC Smart Transceivers Volume Share (%), by Country 2025 & 2033
- Figure 51: Asia Pacific PLC Smart Transceivers Revenue (billion), by Application 2025 & 2033
- Figure 52: Asia Pacific PLC Smart Transceivers Volume (K), by Application 2025 & 2033
- Figure 53: Asia Pacific PLC Smart Transceivers Revenue Share (%), by Application 2025 & 2033
- Figure 54: Asia Pacific PLC Smart Transceivers Volume Share (%), by Application 2025 & 2033
- Figure 55: Asia Pacific PLC Smart Transceivers Revenue (billion), by Types 2025 & 2033
- Figure 56: Asia Pacific PLC Smart Transceivers Volume (K), by Types 2025 & 2033
- Figure 57: Asia Pacific PLC Smart Transceivers Revenue Share (%), by Types 2025 & 2033
- Figure 58: Asia Pacific PLC Smart Transceivers Volume Share (%), by Types 2025 & 2033
- Figure 59: Asia Pacific PLC Smart Transceivers Revenue (billion), by Country 2025 & 2033
- Figure 60: Asia Pacific PLC Smart Transceivers Volume (K), by Country 2025 & 2033
- Figure 61: Asia Pacific PLC Smart Transceivers Revenue Share (%), by Country 2025 & 2033
- Figure 62: Asia Pacific PLC Smart Transceivers Volume Share (%), by Country 2025 & 2033
List of Tables
- Table 1: Global PLC Smart Transceivers Revenue billion Forecast, by Application 2020 & 2033
- Table 2: Global PLC Smart Transceivers Volume K Forecast, by Application 2020 & 2033
- Table 3: Global PLC Smart Transceivers Revenue billion Forecast, by Types 2020 & 2033
- Table 4: Global PLC Smart Transceivers Volume K Forecast, by Types 2020 & 2033
- Table 5: Global PLC Smart Transceivers Revenue billion Forecast, by Region 2020 & 2033
- Table 6: Global PLC Smart Transceivers Volume K Forecast, by Region 2020 & 2033
- Table 7: Global PLC Smart Transceivers Revenue billion Forecast, by Application 2020 & 2033
- Table 8: Global PLC Smart Transceivers Volume K Forecast, by Application 2020 & 2033
- Table 9: Global PLC Smart Transceivers Revenue billion Forecast, by Types 2020 & 2033
- Table 10: Global PLC Smart Transceivers Volume K Forecast, by Types 2020 & 2033
- Table 11: Global PLC Smart Transceivers Revenue billion Forecast, by Country 2020 & 2033
- Table 12: Global PLC Smart Transceivers Volume K Forecast, by Country 2020 & 2033
- Table 13: United States PLC Smart Transceivers Revenue (billion) Forecast, by Application 2020 & 2033
- Table 14: United States PLC Smart Transceivers Volume (K) Forecast, by Application 2020 & 2033
- Table 15: Canada PLC Smart Transceivers Revenue (billion) Forecast, by Application 2020 & 2033
- Table 16: Canada PLC Smart Transceivers Volume (K) Forecast, by Application 2020 & 2033
- Table 17: Mexico PLC Smart Transceivers Revenue (billion) Forecast, by Application 2020 & 2033
- Table 18: Mexico PLC Smart Transceivers Volume (K) Forecast, by Application 2020 & 2033
- Table 19: Global PLC Smart Transceivers Revenue billion Forecast, by Application 2020 & 2033
- Table 20: Global PLC Smart Transceivers Volume K Forecast, by Application 2020 & 2033
- Table 21: Global PLC Smart Transceivers Revenue billion Forecast, by Types 2020 & 2033
- Table 22: Global PLC Smart Transceivers Volume K Forecast, by Types 2020 & 2033
- Table 23: Global PLC Smart Transceivers Revenue billion Forecast, by Country 2020 & 2033
- Table 24: Global PLC Smart Transceivers Volume K Forecast, by Country 2020 & 2033
- Table 25: Brazil PLC Smart Transceivers Revenue (billion) Forecast, by Application 2020 & 2033
- Table 26: Brazil PLC Smart Transceivers Volume (K) Forecast, by Application 2020 & 2033
- Table 27: Argentina PLC Smart Transceivers Revenue (billion) Forecast, by Application 2020 & 2033
- Table 28: Argentina PLC Smart Transceivers Volume (K) Forecast, by Application 2020 & 2033
- Table 29: Rest of South America PLC Smart Transceivers Revenue (billion) Forecast, by Application 2020 & 2033
- Table 30: Rest of South America PLC Smart Transceivers Volume (K) Forecast, by Application 2020 & 2033
- Table 31: Global PLC Smart Transceivers Revenue billion Forecast, by Application 2020 & 2033
- Table 32: Global PLC Smart Transceivers Volume K Forecast, by Application 2020 & 2033
- Table 33: Global PLC Smart Transceivers Revenue billion Forecast, by Types 2020 & 2033
- Table 34: Global PLC Smart Transceivers Volume K Forecast, by Types 2020 & 2033
- Table 35: Global PLC Smart Transceivers Revenue billion Forecast, by Country 2020 & 2033
- Table 36: Global PLC Smart Transceivers Volume K Forecast, by Country 2020 & 2033
- Table 37: United Kingdom PLC Smart Transceivers Revenue (billion) Forecast, by Application 2020 & 2033
- Table 38: United Kingdom PLC Smart Transceivers Volume (K) Forecast, by Application 2020 & 2033
- Table 39: Germany PLC Smart Transceivers Revenue (billion) Forecast, by Application 2020 & 2033
- Table 40: Germany PLC Smart Transceivers Volume (K) Forecast, by Application 2020 & 2033
- Table 41: France PLC Smart Transceivers Revenue (billion) Forecast, by Application 2020 & 2033
- Table 42: France PLC Smart Transceivers Volume (K) Forecast, by Application 2020 & 2033
- Table 43: Italy PLC Smart Transceivers Revenue (billion) Forecast, by Application 2020 & 2033
- Table 44: Italy PLC Smart Transceivers Volume (K) Forecast, by Application 2020 & 2033
- Table 45: Spain PLC Smart Transceivers Revenue (billion) Forecast, by Application 2020 & 2033
- Table 46: Spain PLC Smart Transceivers Volume (K) Forecast, by Application 2020 & 2033
- Table 47: Russia PLC Smart Transceivers Revenue (billion) Forecast, by Application 2020 & 2033
- Table 48: Russia PLC Smart Transceivers Volume (K) Forecast, by Application 2020 & 2033
- Table 49: Benelux PLC Smart Transceivers Revenue (billion) Forecast, by Application 2020 & 2033
- Table 50: Benelux PLC Smart Transceivers Volume (K) Forecast, by Application 2020 & 2033
- Table 51: Nordics PLC Smart Transceivers Revenue (billion) Forecast, by Application 2020 & 2033
- Table 52: Nordics PLC Smart Transceivers Volume (K) Forecast, by Application 2020 & 2033
- Table 53: Rest of Europe PLC Smart Transceivers Revenue (billion) Forecast, by Application 2020 & 2033
- Table 54: Rest of Europe PLC Smart Transceivers Volume (K) Forecast, by Application 2020 & 2033
- Table 55: Global PLC Smart Transceivers Revenue billion Forecast, by Application 2020 & 2033
- Table 56: Global PLC Smart Transceivers Volume K Forecast, by Application 2020 & 2033
- Table 57: Global PLC Smart Transceivers Revenue billion Forecast, by Types 2020 & 2033
- Table 58: Global PLC Smart Transceivers Volume K Forecast, by Types 2020 & 2033
- Table 59: Global PLC Smart Transceivers Revenue billion Forecast, by Country 2020 & 2033
- Table 60: Global PLC Smart Transceivers Volume K Forecast, by Country 2020 & 2033
- Table 61: Turkey PLC Smart Transceivers Revenue (billion) Forecast, by Application 2020 & 2033
- Table 62: Turkey PLC Smart Transceivers Volume (K) Forecast, by Application 2020 & 2033
- Table 63: Israel PLC Smart Transceivers Revenue (billion) Forecast, by Application 2020 & 2033
- Table 64: Israel PLC Smart Transceivers Volume (K) Forecast, by Application 2020 & 2033
- Table 65: GCC PLC Smart Transceivers Revenue (billion) Forecast, by Application 2020 & 2033
- Table 66: GCC PLC Smart Transceivers Volume (K) Forecast, by Application 2020 & 2033
- Table 67: North Africa PLC Smart Transceivers Revenue (billion) Forecast, by Application 2020 & 2033
- Table 68: North Africa PLC Smart Transceivers Volume (K) Forecast, by Application 2020 & 2033
- Table 69: South Africa PLC Smart Transceivers Revenue (billion) Forecast, by Application 2020 & 2033
- Table 70: South Africa PLC Smart Transceivers Volume (K) Forecast, by Application 2020 & 2033
- Table 71: Rest of Middle East & Africa PLC Smart Transceivers Revenue (billion) Forecast, by Application 2020 & 2033
- Table 72: Rest of Middle East & Africa PLC Smart Transceivers Volume (K) Forecast, by Application 2020 & 2033
- Table 73: Global PLC Smart Transceivers Revenue billion Forecast, by Application 2020 & 2033
- Table 74: Global PLC Smart Transceivers Volume K Forecast, by Application 2020 & 2033
- Table 75: Global PLC Smart Transceivers Revenue billion Forecast, by Types 2020 & 2033
- Table 76: Global PLC Smart Transceivers Volume K Forecast, by Types 2020 & 2033
- Table 77: Global PLC Smart Transceivers Revenue billion Forecast, by Country 2020 & 2033
- Table 78: Global PLC Smart Transceivers Volume K Forecast, by Country 2020 & 2033
- Table 79: China PLC Smart Transceivers Revenue (billion) Forecast, by Application 2020 & 2033
- Table 80: China PLC Smart Transceivers Volume (K) Forecast, by Application 2020 & 2033
- Table 81: India PLC Smart Transceivers Revenue (billion) Forecast, by Application 2020 & 2033
- Table 82: India PLC Smart Transceivers Volume (K) Forecast, by Application 2020 & 2033
- Table 83: Japan PLC Smart Transceivers Revenue (billion) Forecast, by Application 2020 & 2033
- Table 84: Japan PLC Smart Transceivers Volume (K) Forecast, by Application 2020 & 2033
- Table 85: South Korea PLC Smart Transceivers Revenue (billion) Forecast, by Application 2020 & 2033
- Table 86: South Korea PLC Smart Transceivers Volume (K) Forecast, by Application 2020 & 2033
- Table 87: ASEAN PLC Smart Transceivers Revenue (billion) Forecast, by Application 2020 & 2033
- Table 88: ASEAN PLC Smart Transceivers Volume (K) Forecast, by Application 2020 & 2033
- Table 89: Oceania PLC Smart Transceivers Revenue (billion) Forecast, by Application 2020 & 2033
- Table 90: Oceania PLC Smart Transceivers Volume (K) Forecast, by Application 2020 & 2033
- Table 91: Rest of Asia Pacific PLC Smart Transceivers Revenue (billion) Forecast, by Application 2020 & 2033
- Table 92: Rest of Asia Pacific PLC Smart Transceivers Volume (K) Forecast, by Application 2020 & 2033
Frequently Asked Questions
1. What is the projected Compound Annual Growth Rate (CAGR) of the PLC Smart Transceivers?
The projected CAGR is approximately 10.87%.
2. Which companies are prominent players in the PLC Smart Transceivers?
Key companies in the market include Texas Instruments, STMicroelectronics, Maxim Integrated, Cypress Semiconductor, Renesas Electronics, Semtech, ON Semiconductor, Analog Devices, Microchip Technology, Silicon Labs, Murata Manufacturing, NXP Semiconductors, Marvell Technology Group, Adesto Technologies, Broadcom, Mouser Electronics, Future Electronics, Shenzhen Wlink Technology, Beijing Huanuo, Shanghai Belling.
3. What are the main segments of the PLC Smart Transceivers?
The market segments include Application, Types.
4. Can you provide details about the market size?
The market size is estimated to be USD 14 billion as of 2022.
5. What are some drivers contributing to market growth?
N/A
6. What are the notable trends driving market growth?
N/A
7. Are there any restraints impacting market growth?
N/A
8. Can you provide examples of recent developments in the market?
N/A
9. What pricing options are available for accessing the report?
Pricing options include single-user, multi-user, and enterprise licenses priced at USD 3350.00, USD 5025.00, and USD 6700.00 respectively.
10. Is the market size provided in terms of value or volume?
The market size is provided in terms of value, measured in billion and volume, measured in K.
11. Are there any specific market keywords associated with the report?
Yes, the market keyword associated with the report is "PLC Smart Transceivers," which aids in identifying and referencing the specific market segment covered.
12. How do I determine which pricing option suits my needs best?
The pricing options vary based on user requirements and access needs. Individual users may opt for single-user licenses, while businesses requiring broader access may choose multi-user or enterprise licenses for cost-effective access to the report.
13. Are there any additional resources or data provided in the PLC Smart Transceivers report?
While the report offers comprehensive insights, it's advisable to review the specific contents or supplementary materials provided to ascertain if additional resources or data are available.
14. How can I stay updated on further developments or reports in the PLC Smart Transceivers?
To stay informed about further developments, trends, and reports in the PLC Smart Transceivers, consider subscribing to industry newsletters, following relevant companies and organizations, or regularly checking reputable industry news sources and publications.
Methodology
Step 1 - Identification of Relevant Samples Size from Population Database


Step 2 - Approaches for Defining Global Market Size (Value, Volume* & Price*)

Note*: In applicable scenarios
Step 3 - Data Sources
Primary Research
- Web Analytics
- Survey Reports
- Research Institute
- Latest Research Reports
- Opinion Leaders
Secondary Research
- Annual Reports
- White Paper
- Latest Press Release
- Industry Association
- Paid Database
- Investor Presentations

Step 4 - Data Triangulation
Involves using different sources of information in order to increase the validity of a study
These sources are likely to be stakeholders in a program - participants, other researchers, program staff, other community members, and so on.
Then we put all data in single framework & apply various statistical tools to find out the dynamic on the market.
During the analysis stage, feedback from the stakeholder groups would be compared to determine areas of agreement as well as areas of divergence